| Param | Original file | Final file |
|---|---|---|
| Filename | modeM0/AS1T03_243T01_9000003918_27280cztM0_level2.evt | modeM0/AS1T03_243T01_9000003918_27280cztM0_level2_quad_clean.evt |
| Size (bytes) | 513,627,840 | 72,192,960 |
| Size | 489.8 MB | 68.8 MB |
| Events in quadrant A | 3,216,189 | 442,155 |
| Events in quadrant B | 4,708,774 | 440,220 |
| Events in quadrant C | 3,249,476 | 426,058 |
| Events in quadrant D | 3,934,609 | 418,948 |
| Mode M9 | |||
|---|---|---|---|
| Quadrant | BADHDUFLAG | Total packets | Discarded packets |
| A | 0 | 10 | 0 |
| B | 0 | 10 | 0 |
| C | 0 | 10 | 0 |
| D | 0 | 10 | 0 |
| Mode M0 | |||
|---|---|---|---|
| Quadrant | BADHDUFLAG | Total packets | Discarded packets |
| A | 0 | 13546 | 0 |
| B | 0 | 18119 | 0 |
| C | 0 | 13686 | 0 |
| D | 0 | 15864 | 0 |
| Quadrant | Total seconds | Saturated seconds | Saturation percentage |
|---|---|---|---|
| A | 6578 | 47 | 0.714503% |
| B | 6579 | 503 | 7.645539% |
| C | 6579 | 89 | 1.352789% |
| D | 6579 | 117 | 1.778386% |
Noise dominated data is calculated using 1-second bins in cleaned event files. If a bin has >2000 counts, and if more than 50% of those come from <1% of pixels, then it is considered to be noise-dominated and hence unusable.
| Quadrant | # 1 sec bins | Bins with >0 counts | Bins with >2000 counts | High rate bins dominated by noise | Noise dominated (total time) | Noise dominated (detector-on time) | Marked lightcurve |
|---|---|---|---|---|---|---|---|
| A | 7553 | 6579 | 0 | 0 | 0.00% | 0.00% |  |
| B | 7554 | 6580 | 269 | 269 | 3.56% | 4.09% |  |
| C | 7554 | 6580 | 1 | 1 | 0.01% | 0.02% |  |
| D | 7554 | 6580 | 86 | 86 | 1.14% | 1.31% |  |
Top three noisy pixels from each quadrant. If the there are fewer than three noisy pixels in the level2.evt file, extra rows are filled as -1
| Pixel properties | Quadrant properties | ||||||
|---|---|---|---|---|---|---|---|
| Quadrant | DetID | PixID | Counts | Sigma | Mean | Median | Sigma |
| A | 13 | 254 | 9200 | 50.09 | 833 | 816 | 167.4 |
| A | 3 | 137 | 8014 | 43.01 | 833 | 816 | 167.4 |
| A | 0 | 226 | 7201 | 38.15 | 833 | 816 | 167.4 |
| B | 10 | 245 | 1506309 | 9800.16 | 806 | 788 | 153.6 |
| B | 0 | 230 | 25956 | 163.83 | 806 | 788 | 153.6 |
| B | 12 | 111 | 19074 | 119.03 | 806 | 788 | 153.6 |
| C | 14 | 238 | 127360 | 682.57 | 791 | 795 | 185.4 |
| C | 15 | 208 | 41751 | 220.88 | 791 | 795 | 185.4 |
| C | 13 | 61 | 5202 | 23.77 | 791 | 795 | 185.4 |
| D | 1 | 52 | 615906 | 3278.58 | 794 | 775 | 187.6 |
| D | 12 | 17 | 202213 | 1073.64 | 794 | 775 | 187.6 |
| D | 2 | 250 | 75727 | 399.49 | 794 | 775 | 187.6 |
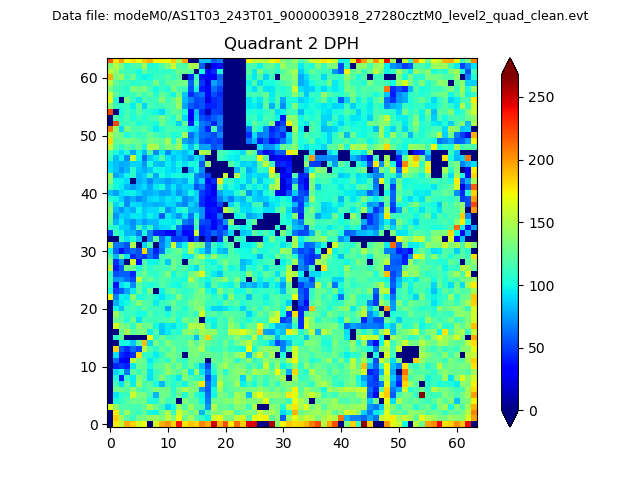
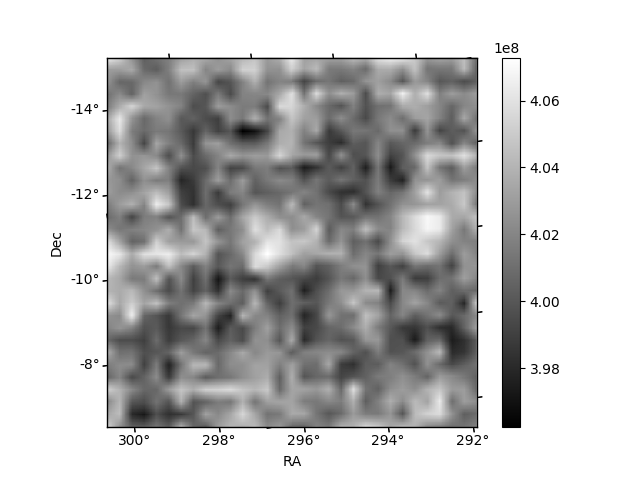
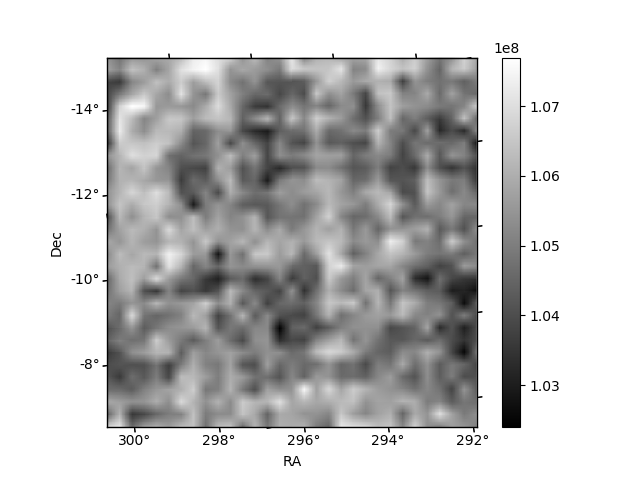
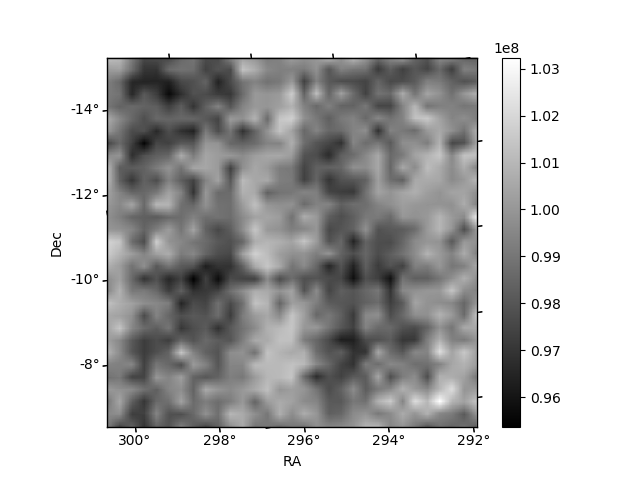
Histogram calculated using DETX and DETY for each event in the final _common_clean file
| Quadrant A |  |
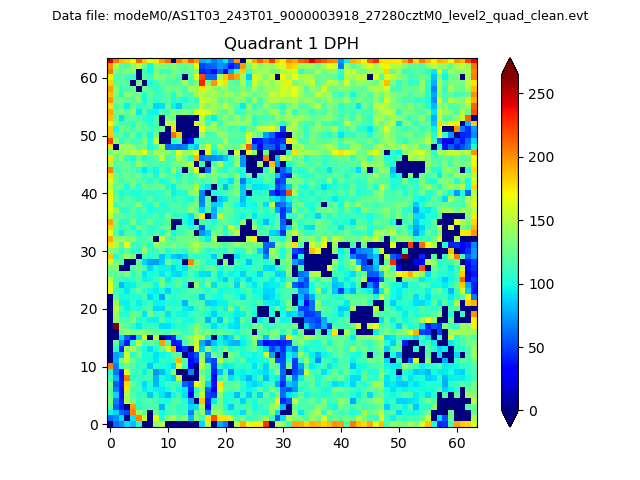 |
Quadrant B |
|---|---|---|---|
| Quadrant D | 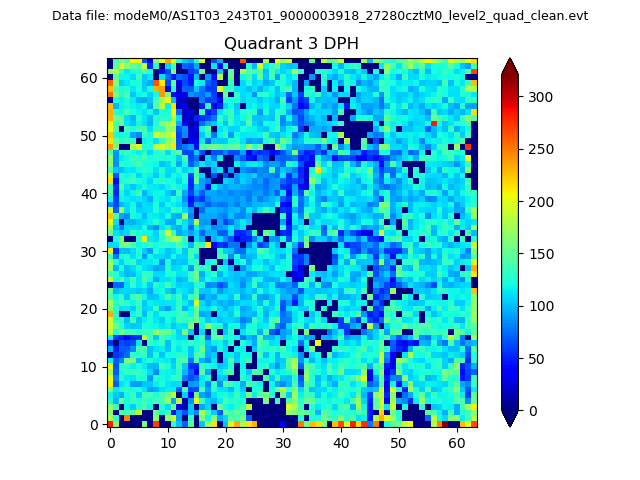 |
 |
Quadrant C |
| Plot type | Count rate plots | Images |
|---|---|---|
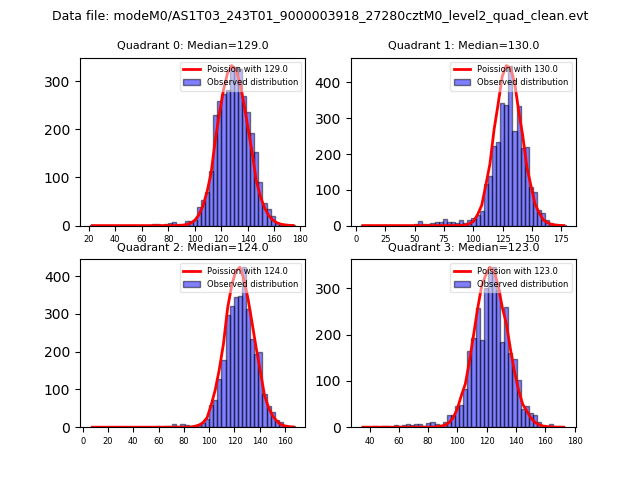
| Comparison with Poisson distribution Blue bars denote a histogram of data divided into 1 sec bins. Red curve is a Poisson curve with rate = median count rate of data. |
 |
 |
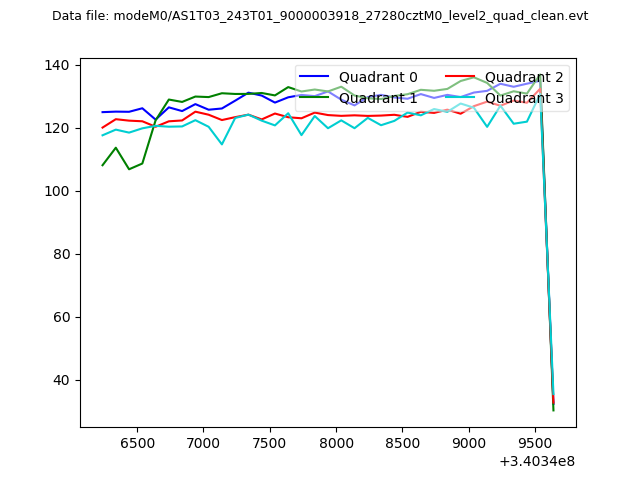
| Quadrant-wise count rates Data is divided into 100 sec bins |
 |
|
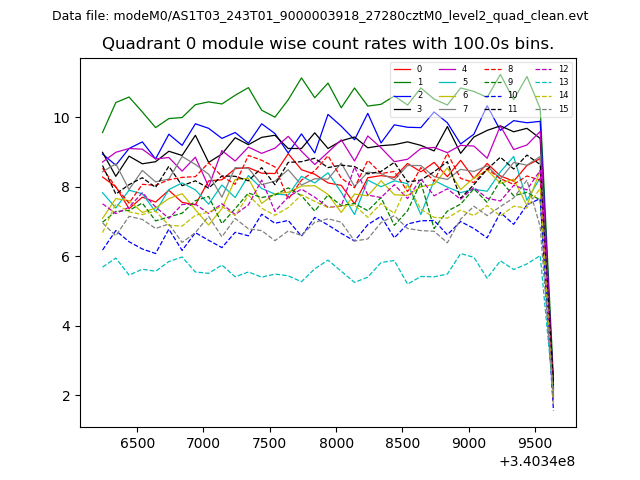
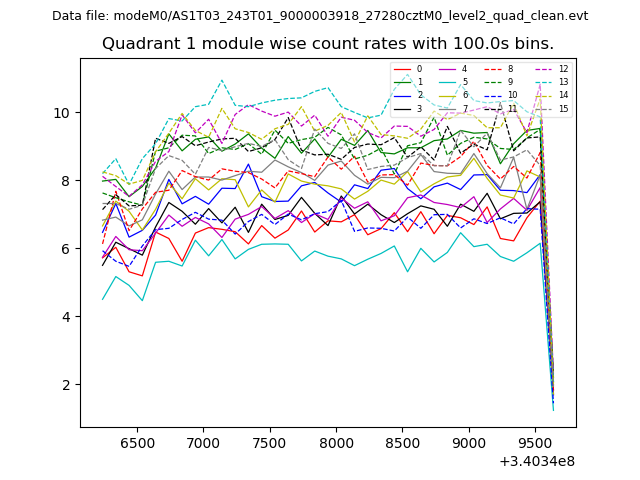
| Module-wise count rates for Quadrant A Data is divided into 100 sec bins |
 |
 |
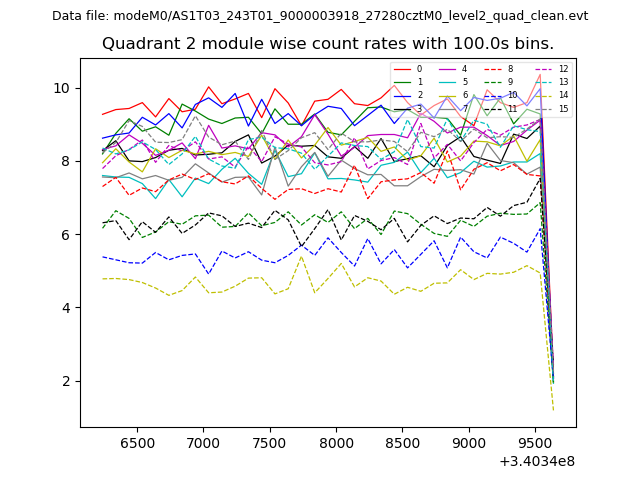
| Module-wise count rates for Quadrant B Data is divided into 100 sec bins |
 |
 |
| Module-wise count rates for Quadrant C Data is divided into 100 sec bins |
 |
 |
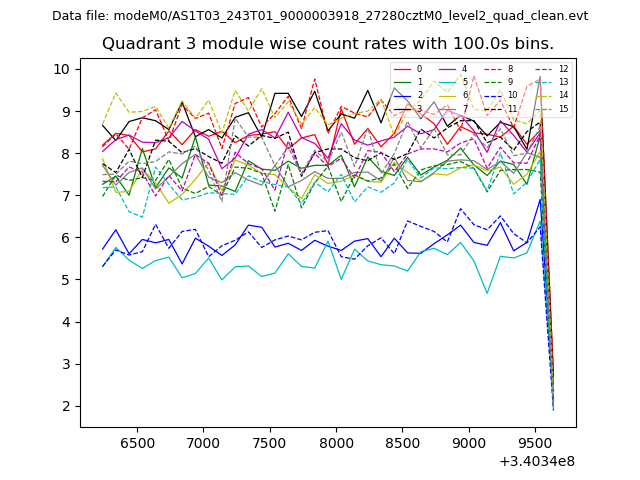
| Module-wise count rates for Quadrant D Data is divided into 100 sec bins |
 |
 |
| Parameter | Plot |
|---|---|
| CZT HV Monitor | 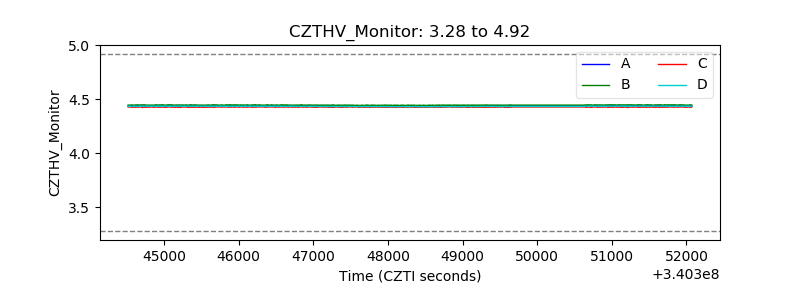 |
| D_VDD | 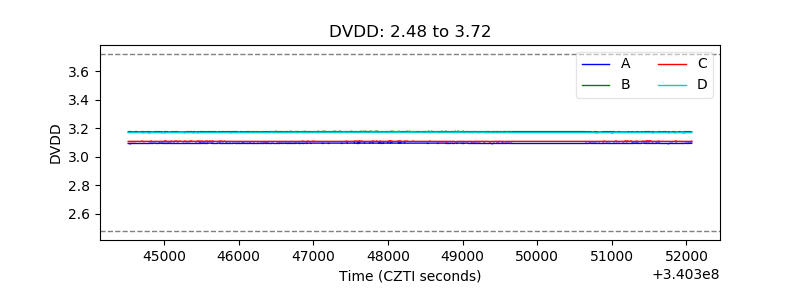 |
| Temperature 1 | 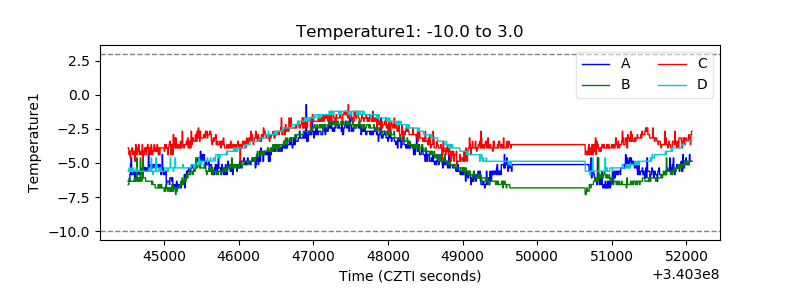 |
| Veto HV Monitor |  |
| Veto LLD | 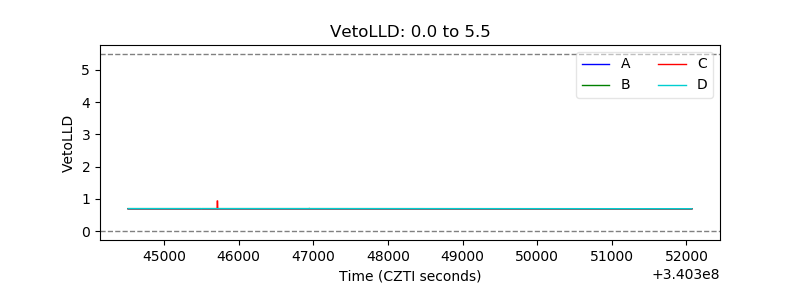 |
| Alpha Counter | 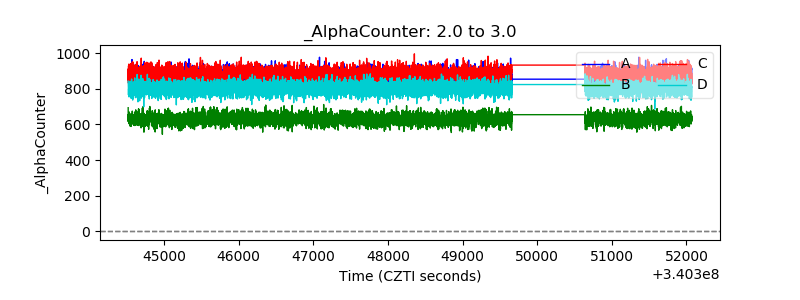 |
| _CPM_Rate | 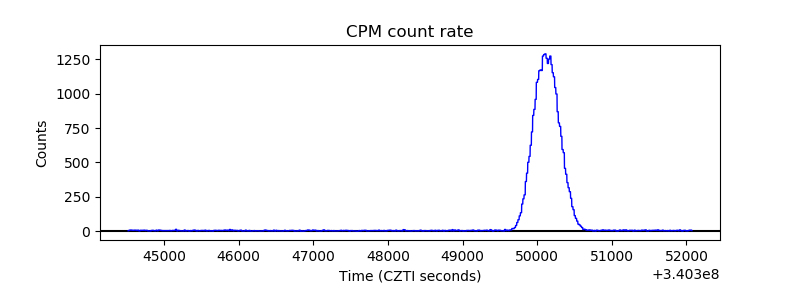 |
| CZT Counter | 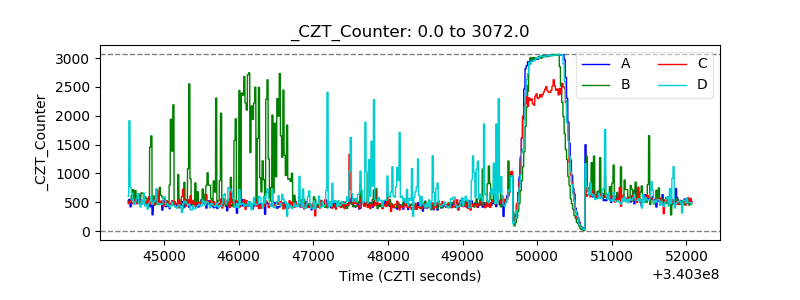 |
| +2.5 Volts monitor | 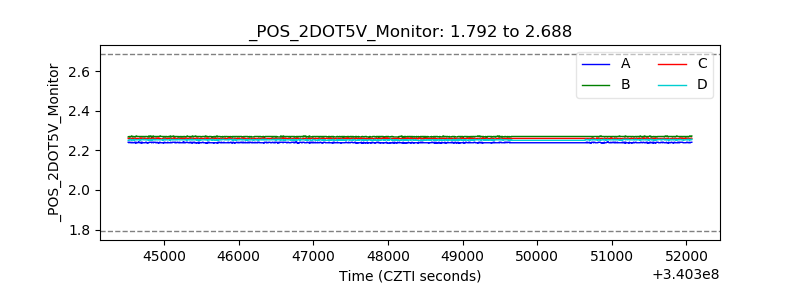 |
| +5 Volts monitor |  |
| _ROLL_ROT | 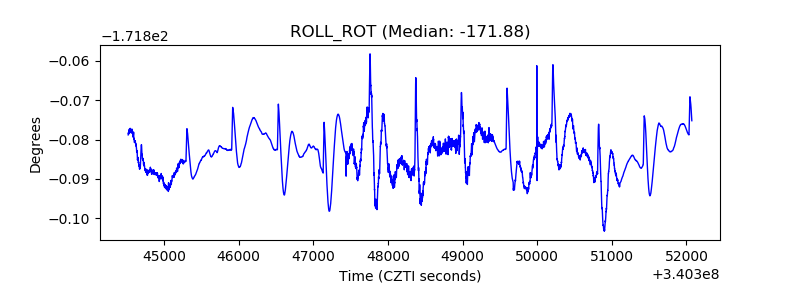 |
| _Roll_DEC | 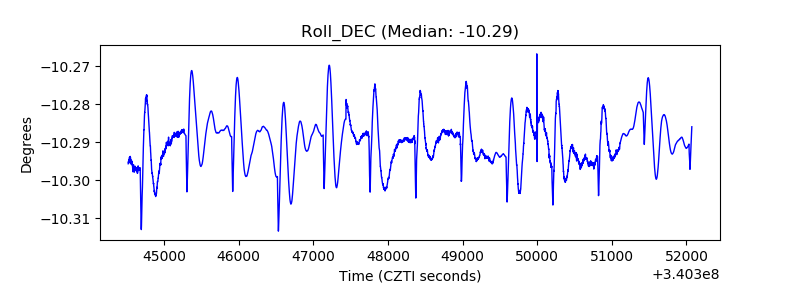 |
| _Roll_RA | 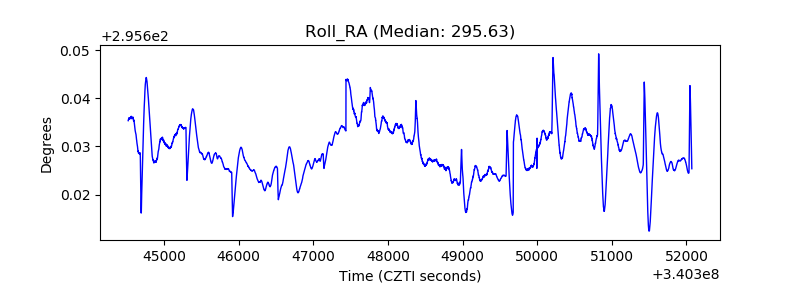 |
| Veto Counter | 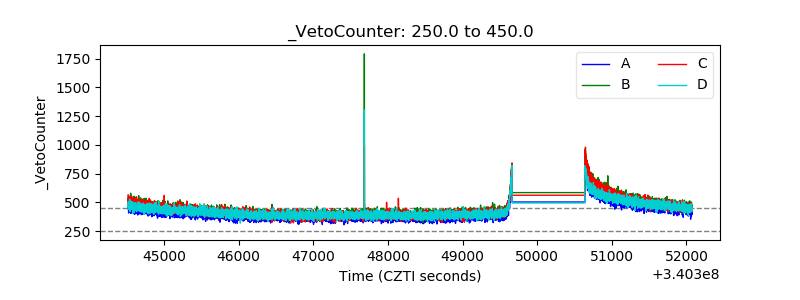 |