| Param | Original file | Final file |
|---|---|---|
| Filename | modeM0/AS1T03_243T01_9000003918_27284cztM0_level2.evt | modeM0/AS1T03_243T01_9000003918_27284cztM0_level2_quad_clean.evt |
| Size (bytes) | 469,281,600 | 99,028,800 |
| Size | 447.5 MB | 94.4 MB |
| Events in quadrant A | 2,925,250 | 691,589 |
| Events in quadrant B | 3,044,841 | 695,761 |
| Events in quadrant C | 2,827,867 | 642,282 |
| Events in quadrant D | 5,061,164 | 604,955 |
| Mode M9 | |||
|---|---|---|---|
| Quadrant | BADHDUFLAG | Total packets | Discarded packets |
| A | 0 | 13 | 0 |
| B | 0 | 13 | 0 |
| C | 0 | 13 | 0 |
| D | 0 | 13 | 0 |
| Mode M0 | |||
|---|---|---|---|
| Quadrant | BADHDUFLAG | Total packets | Discarded packets |
| A | 0 | 12058 | 0 |
| B | 0 | 12433 | 0 |
| C | 0 | 11703 | 0 |
| D | 0 | 18567 | 0 |
| Quadrant | Total seconds | Saturated seconds | Saturation percentage |
|---|---|---|---|
| A | 5206 | 105 | 2.016904% |
| B | 5190 | 97 | 1.868979% |
| C | 5182 | 121 | 2.335006% |
| D | 5195 | 707 | 13.609240% |
Noise dominated data is calculated using 1-second bins in cleaned event files. If a bin has >2000 counts, and if more than 50% of those come from <1% of pixels, then it is considered to be noise-dominated and hence unusable.
| Quadrant | # 1 sec bins | Bins with >0 counts | Bins with >2000 counts | High rate bins dominated by noise | Noise dominated (total time) | Noise dominated (detector-on time) | Marked lightcurve |
|---|---|---|---|---|---|---|---|
| A | 7180 | 5276 | 4 | 4 | 0.06% | 0.08% | 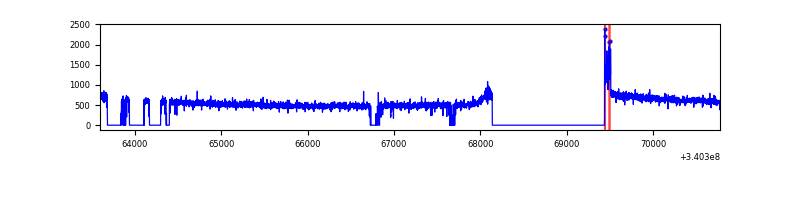 |
| B | 7180 | 5270 | 10 | 10 | 0.14% | 0.19% | 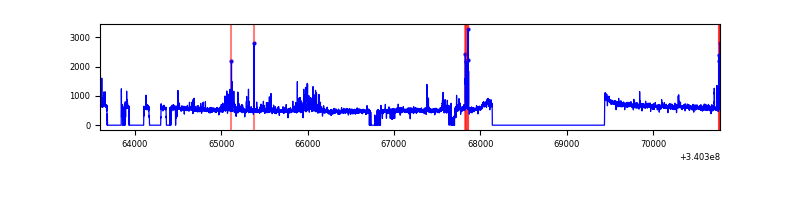 |
| C | 7180 | 5261 | 5 | 5 | 0.07% | 0.10% | 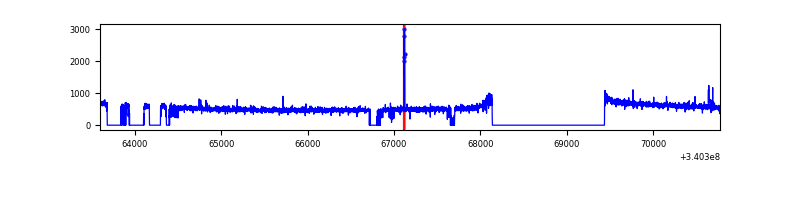 |
| D | 7179 | 5271 | 590 | 590 | 8.22% | 11.19% | 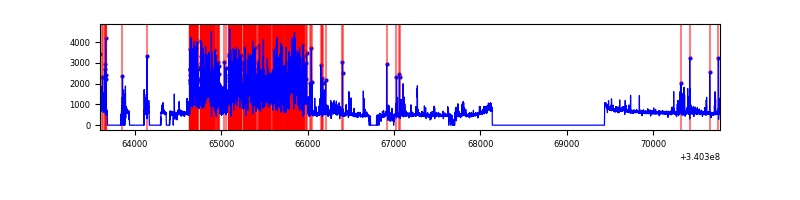 |
Top three noisy pixels from each quadrant. If the there are fewer than three noisy pixels in the level2.evt file, extra rows are filled as -1
| Pixel properties | Quadrant properties | ||||||
|---|---|---|---|---|---|---|---|
| Quadrant | DetID | PixID | Counts | Sigma | Mean | Median | Sigma |
| A | 13 | 170 | 41853 | 277.94 | 747 | 736 | 147.9 |
| A | 13 | 254 | 7771 | 47.55 | 747 | 736 | 147.9 |
| A | 3 | 137 | 6429 | 38.48 | 747 | 736 | 147.9 |
| B | 10 | 245 | 118880 | 862.73 | 728 | 713 | 137.0 |
| B | 15 | 32 | 72217 | 522.04 | 728 | 713 | 137.0 |
| B | 12 | 111 | 15711 | 109.5 | 728 | 713 | 137.0 |
| C | 14 | 238 | 113088 | 709.48 | 689 | 695 | 158.4 |
| C | 15 | 208 | 29238 | 180.18 | 689 | 695 | 158.4 |
| C | 13 | 61 | 4800 | 25.91 | 689 | 695 | 158.4 |
| D | 12 | 233 | 1813577 | 11168.08 | 683 | 670 | 162.3 |
| D | 1 | 52 | 532410 | 3275.69 | 683 | 670 | 162.3 |
| D | 2 | 250 | 71573 | 436.78 | 683 | 670 | 162.3 |
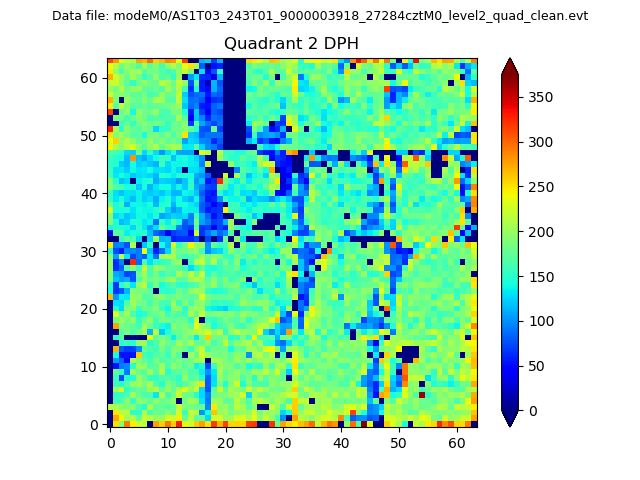
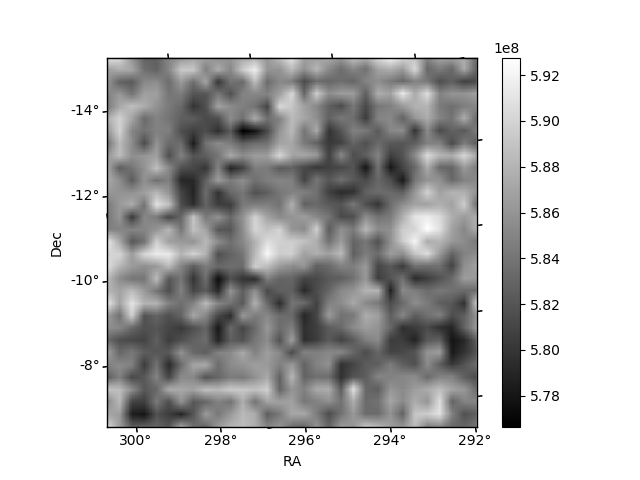
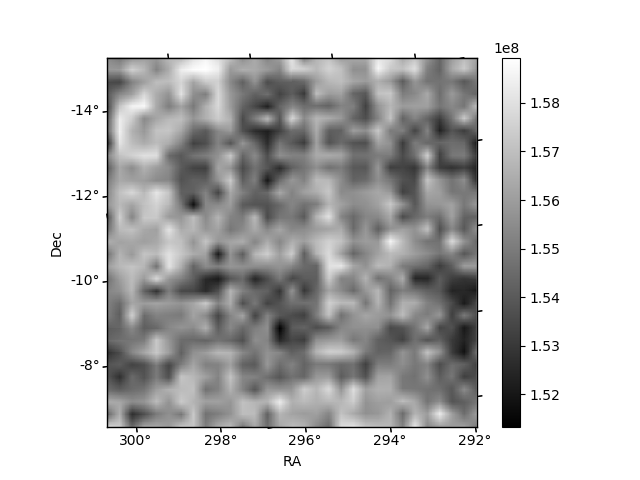
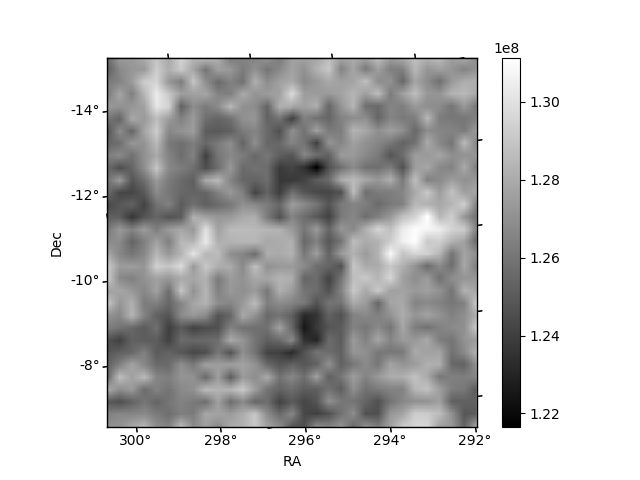
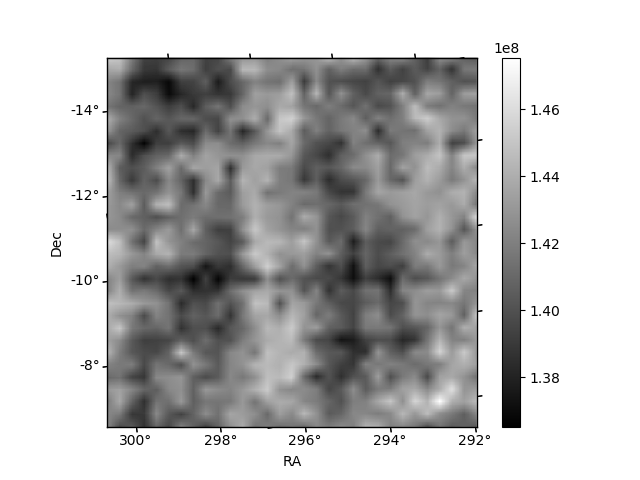
Histogram calculated using DETX and DETY for each event in the final _common_clean file
| Quadrant A | 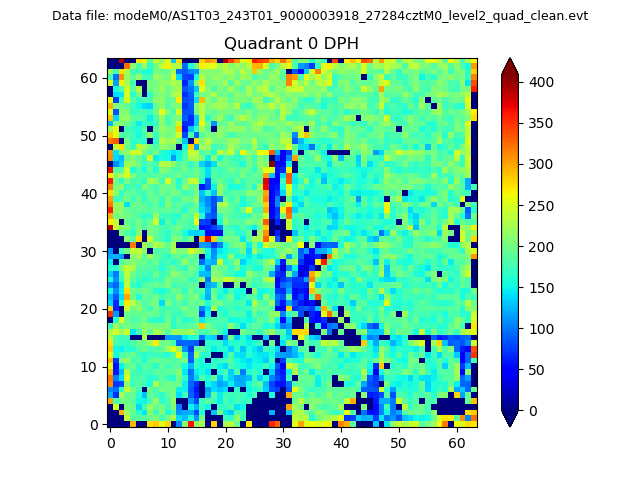 |
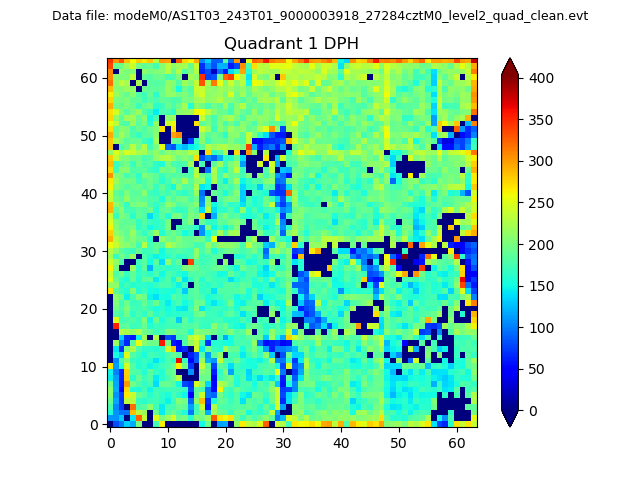 |
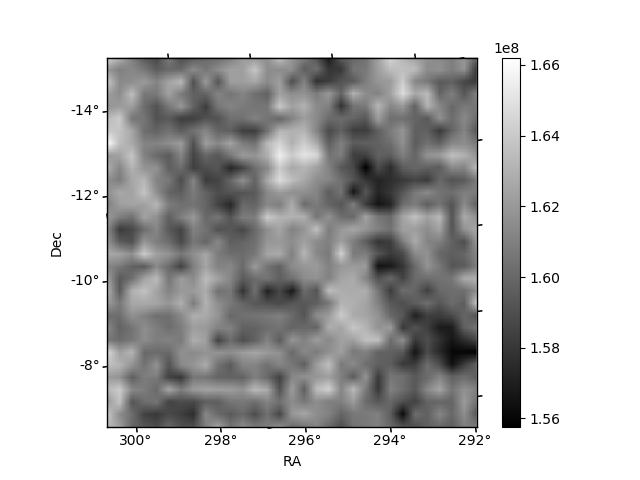
Quadrant B |
|---|---|---|---|
| Quadrant D | 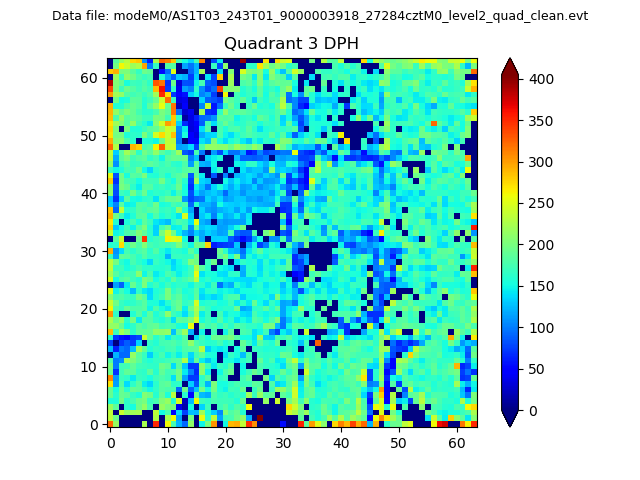 |
 |
Quadrant C |
| Plot type | Count rate plots | Images |
|---|---|---|
| Comparison with Poisson distribution Blue bars denote a histogram of data divided into 1 sec bins. Red curve is a Poisson curve with rate = median count rate of data. |
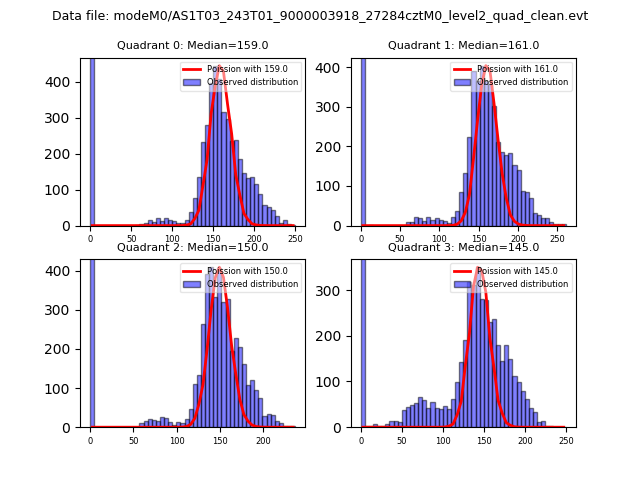 |
 |
| Quadrant-wise count rates Data is divided into 100 sec bins |
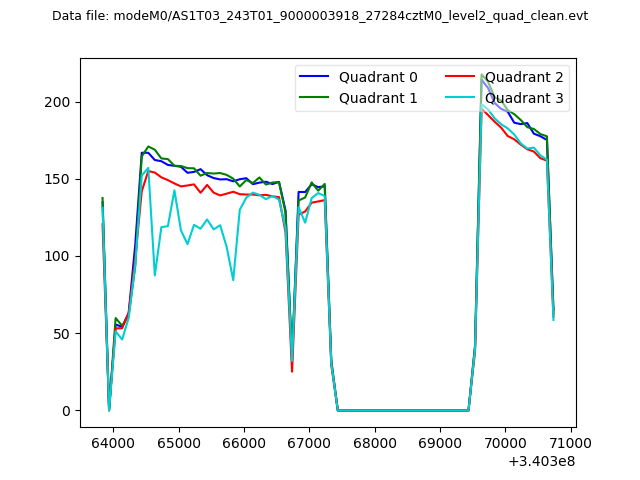 |
|
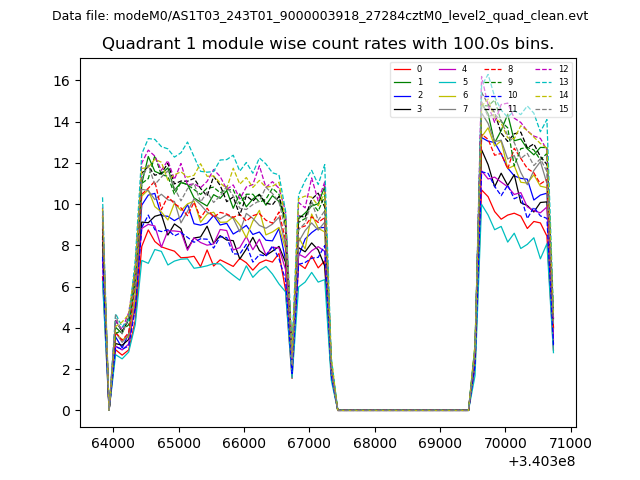
| Module-wise count rates for Quadrant A Data is divided into 100 sec bins |
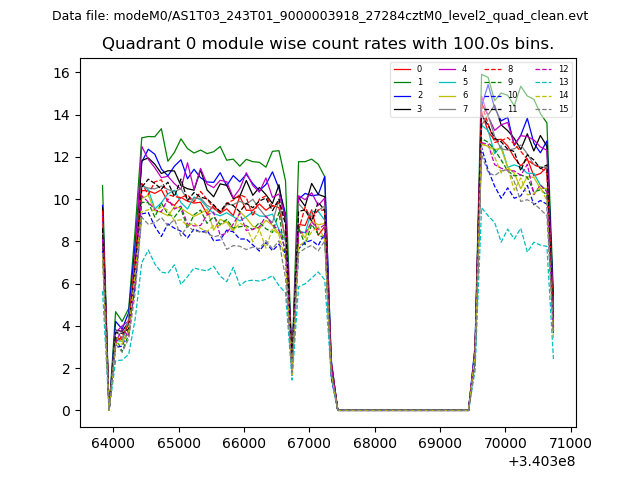 |
 |
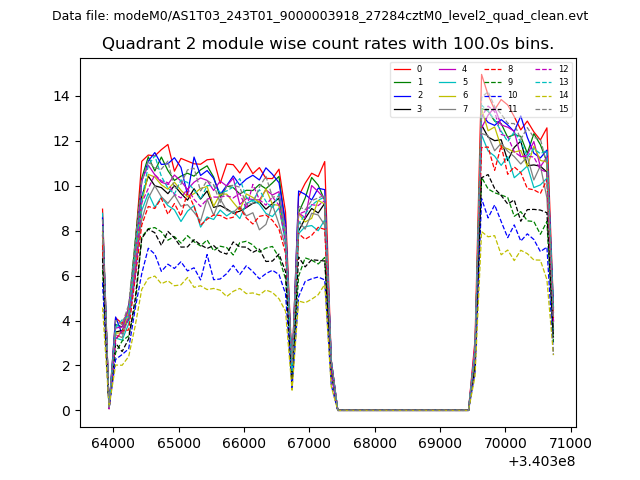
| Module-wise count rates for Quadrant B Data is divided into 100 sec bins |
 |
 |
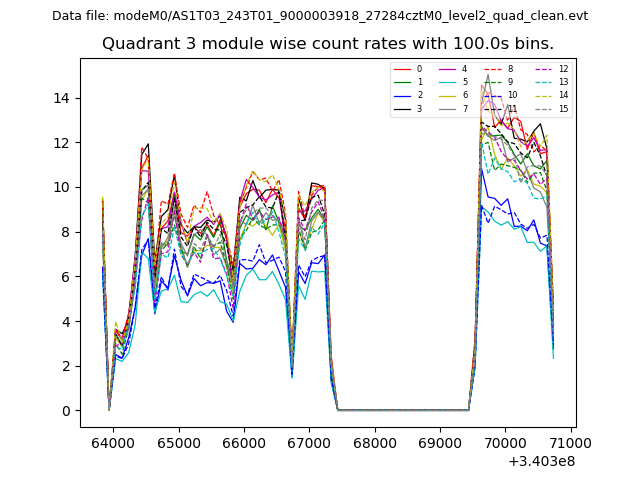
| Module-wise count rates for Quadrant C Data is divided into 100 sec bins |
 |
 |
| Module-wise count rates for Quadrant D Data is divided into 100 sec bins |
 |
 |
| Parameter | Plot |
|---|---|
| CZT HV Monitor | 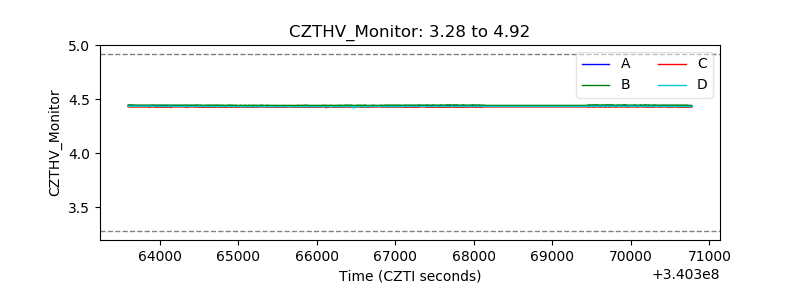 |
| D_VDD | 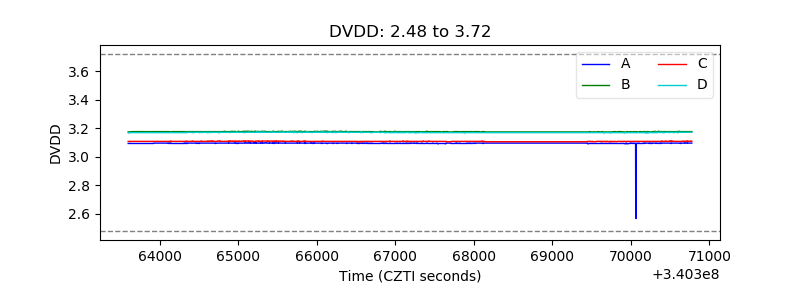 |
| Temperature 1 | 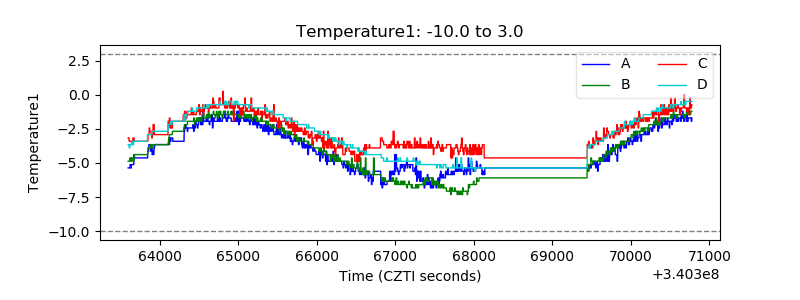 |
| Veto HV Monitor | 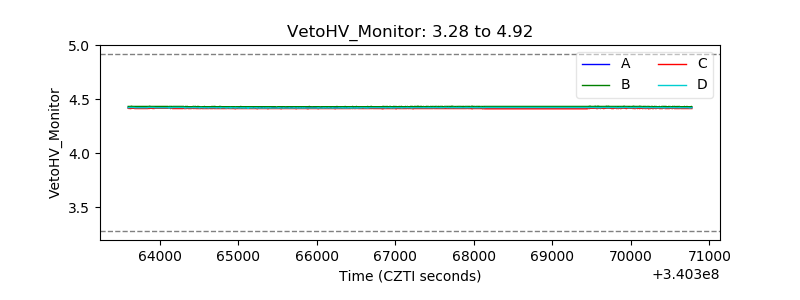 |
| Veto LLD | 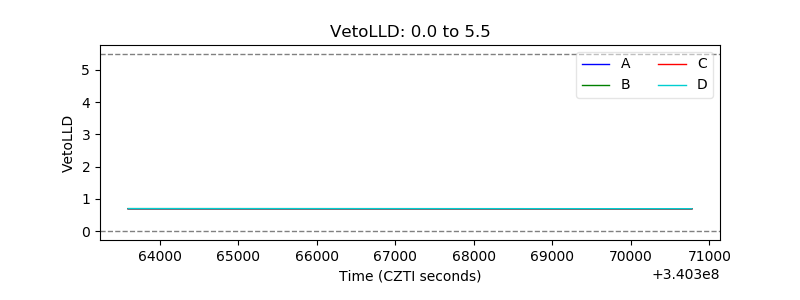 |
| Alpha Counter | 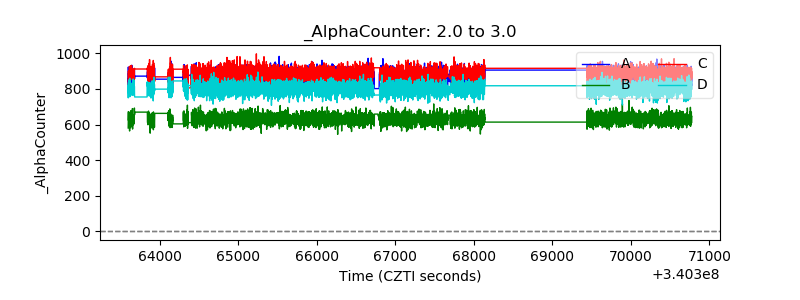 |
| _CPM_Rate | 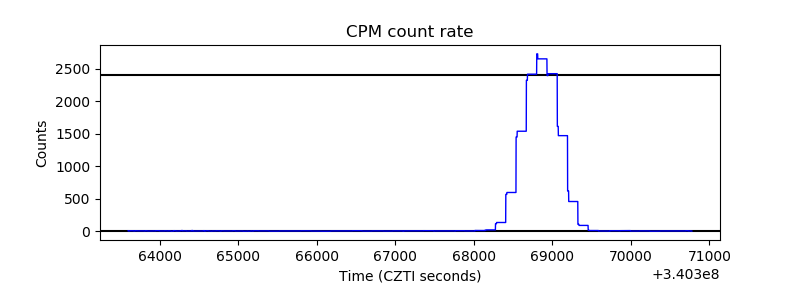 |
| CZT Counter | 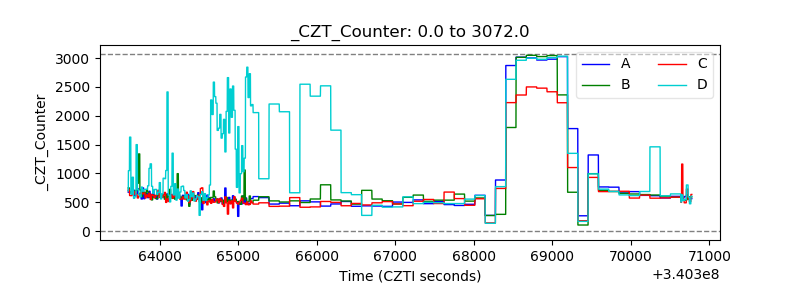 |
| +2.5 Volts monitor |  |
| +5 Volts monitor |  |
| _ROLL_ROT | 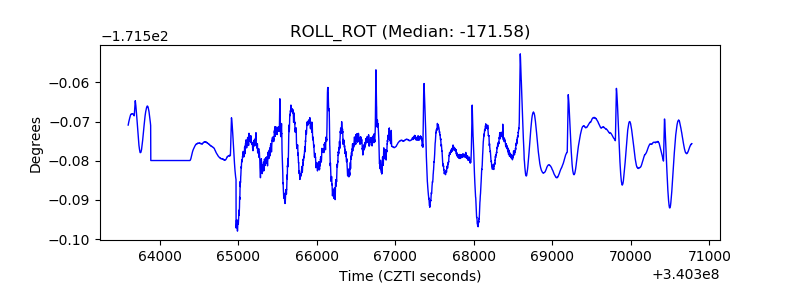 |
| _Roll_DEC |  |
| _Roll_RA | 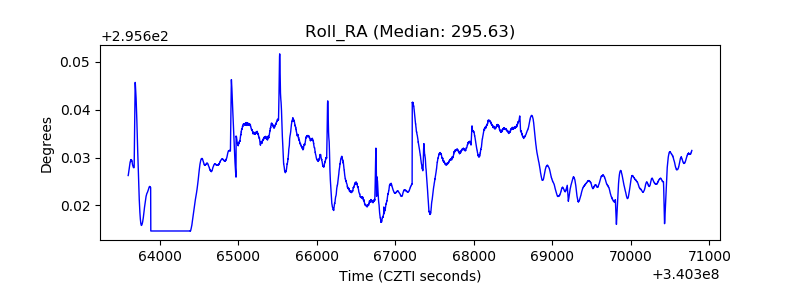 |
| Veto Counter | 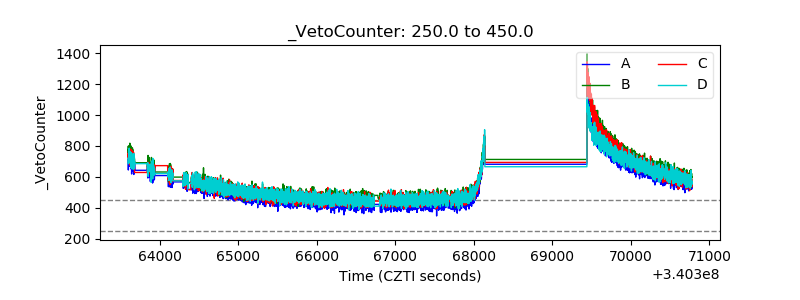 |