| Param | Original file | Final file |
|---|---|---|
| Filename | modeM0/AS1T03_243T01_9000003918_27285cztM0_level2.evt | modeM0/AS1T03_243T01_9000003918_27285cztM0_level2_quad_clean.evt |
| Size (bytes) | 906,557,760 | 188,066,880 |
| Size | 864.6 MB | 179.4 MB |
| Events in quadrant A | 5,534,628 | 1,309,796 |
| Events in quadrant B | 6,546,008 | 1,314,822 |
| Events in quadrant C | 5,393,451 | 1,222,294 |
| Events in quadrant D | 9,299,380 | 1,149,919 |
| Mode M9 | |||
|---|---|---|---|
| Quadrant | BADHDUFLAG | Total packets | Discarded packets |
| A | 0 | 27 | 0 |
| B | 0 | 27 | 0 |
| C | 0 | 27 | 0 |
| D | 0 | 27 | 0 |
| Mode M0 | |||
|---|---|---|---|
| Quadrant | BADHDUFLAG | Total packets | Discarded packets |
| A | 0 | 22785 | 0 |
| B | 0 | 25934 | 0 |
| C | 0 | 22300 | 0 |
| D | 0 | 34406 | 0 |
| Quadrant | Total seconds | Saturated seconds | Saturation percentage |
|---|---|---|---|
| A | 10091 | 218 | 2.160341% |
| B | 10092 | 509 | 5.043599% |
| C | 10092 | 242 | 2.397939% |
| D | 10092 | 1286 | 12.742767% |
Noise dominated data is calculated using 1-second bins in cleaned event files. If a bin has >2000 counts, and if more than 50% of those come from <1% of pixels, then it is considered to be noise-dominated and hence unusable.
| Quadrant | # 1 sec bins | Bins with >0 counts | Bins with >2000 counts | High rate bins dominated by noise | Noise dominated (total time) | Noise dominated (detector-on time) | Marked lightcurve |
|---|---|---|---|---|---|---|---|
| A | 12736 | 10092 | 4 | 4 | 0.03% | 0.04% | 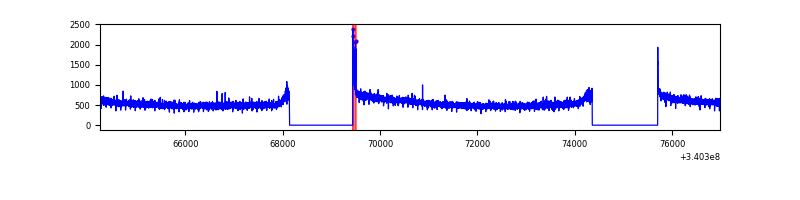 |
| B | 12737 | 10093 | 152 | 152 | 1.19% | 1.51% | 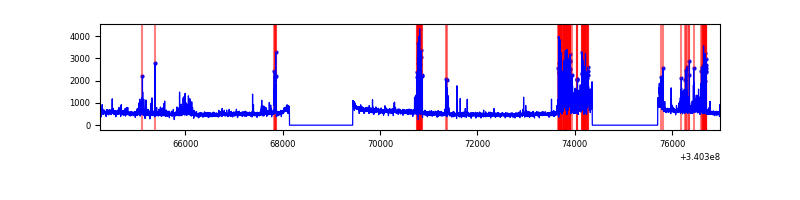 |
| C | 12737 | 10093 | 5 | 5 | 0.04% | 0.05% | 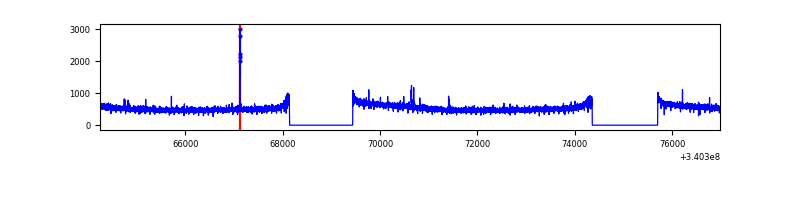 |
| D | 12737 | 10094 | 990 | 990 | 7.77% | 9.81% | 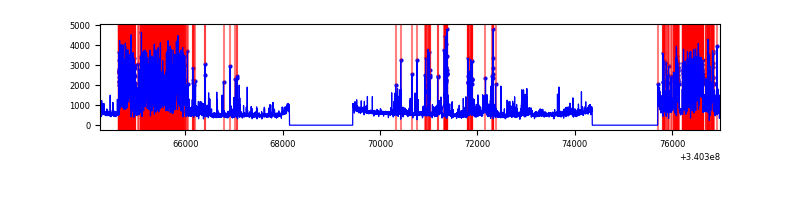 |
Top three noisy pixels from each quadrant. If the there are fewer than three noisy pixels in the level2.evt file, extra rows are filled as -1
| Pixel properties | Quadrant properties | ||||||
|---|---|---|---|---|---|---|---|
| Quadrant | DetID | PixID | Counts | Sigma | Mean | Median | Sigma |
| A | 13 | 170 | 42359 | 145.88 | 1422 | 1402 | 280.8 |
| A | 13 | 254 | 15626 | 50.66 | 1422 | 1402 | 280.8 |
| A | 0 | 226 | 12376 | 39.09 | 1422 | 1402 | 280.8 |
| B | 10 | 245 | 1086604 | 4225.15 | 1379 | 1351 | 256.9 |
| B | 15 | 32 | 76149 | 291.21 | 1379 | 1351 | 256.9 |
| B | 12 | 111 | 29487 | 109.54 | 1379 | 1351 | 256.9 |
| C | 14 | 238 | 217178 | 713.51 | 1320 | 1334 | 302.5 |
| C | 15 | 208 | 30929 | 97.83 | 1320 | 1334 | 302.5 |
| C | 13 | 61 | 9102 | 25.68 | 1320 | 1334 | 302.5 |
| D | 1 | 52 | 2239051 | 7136.68 | 1305 | 1274 | 313.6 |
| D | 12 | 233 | 1849281 | 5893.63 | 1305 | 1274 | 313.6 |
| D | 2 | 250 | 184376 | 583.95 | 1305 | 1274 | 313.6 |
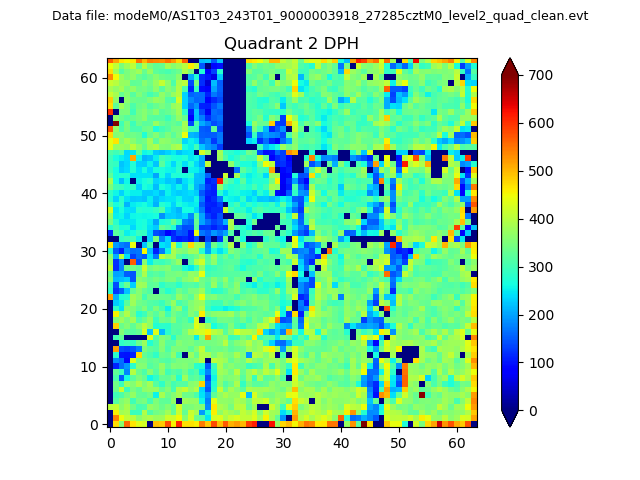
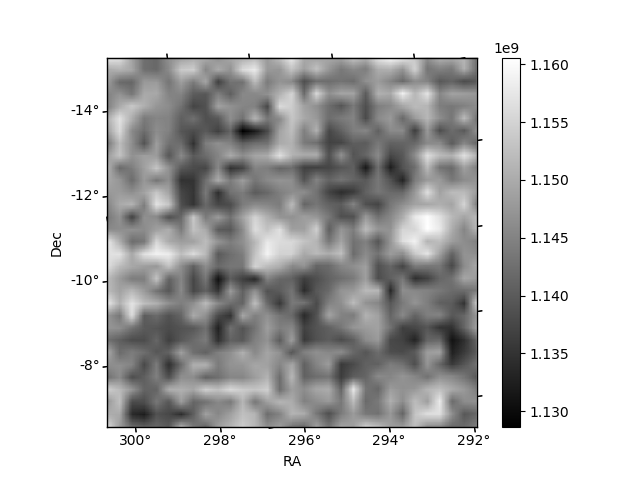
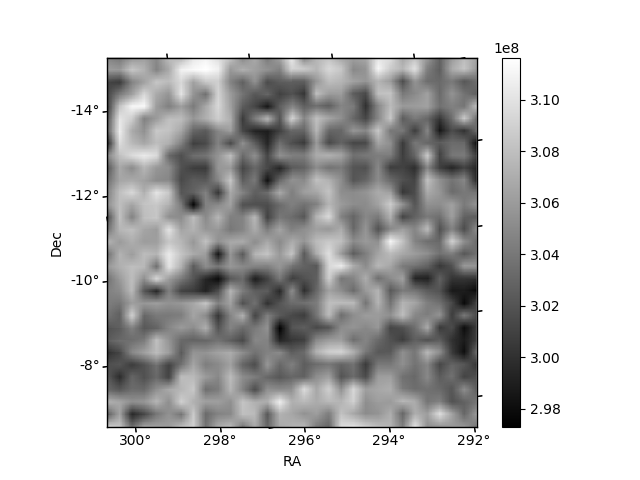
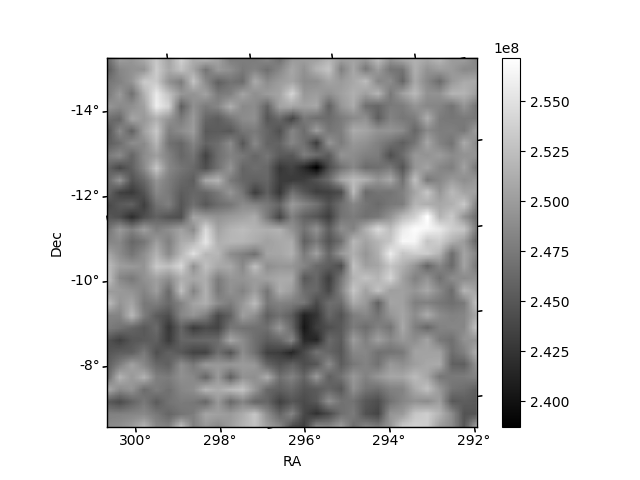
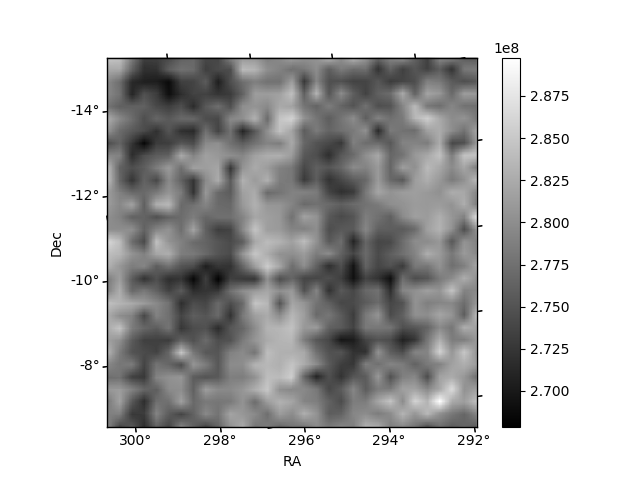
Histogram calculated using DETX and DETY for each event in the final _common_clean file
| Quadrant A | 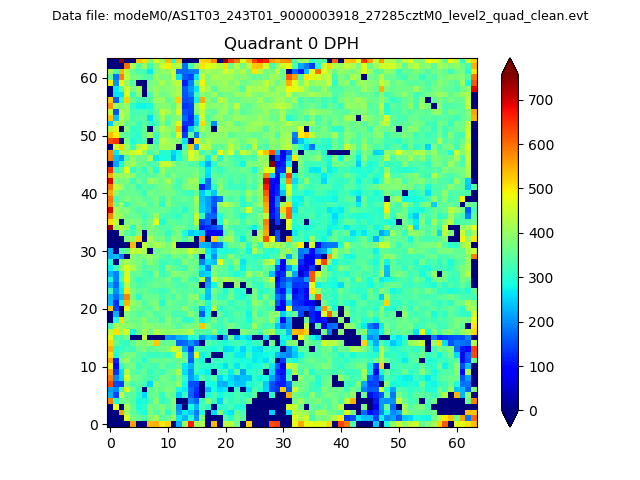 |
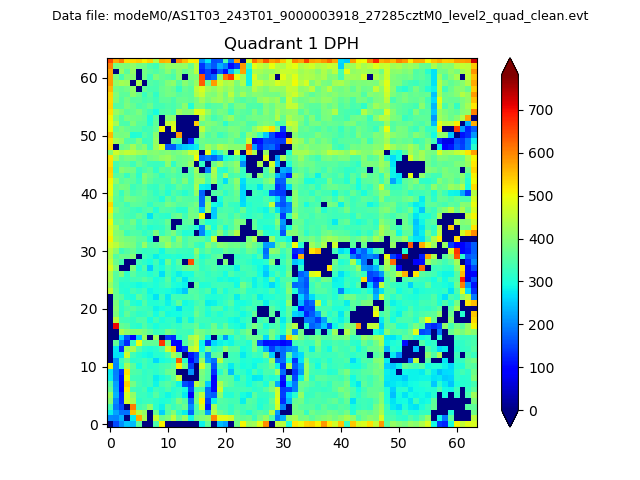 |
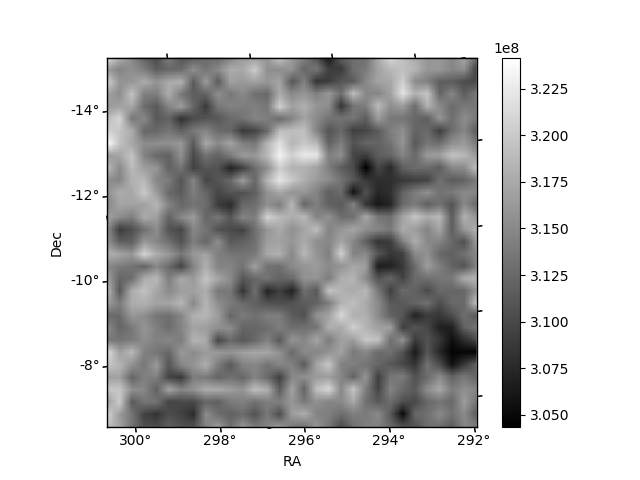
Quadrant B |
|---|---|---|---|
| Quadrant D | 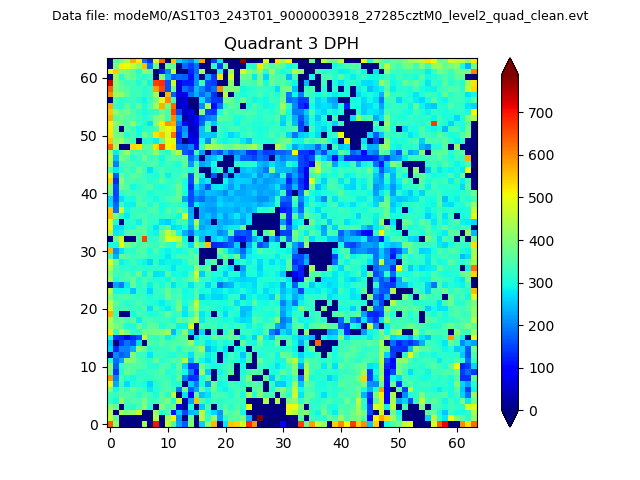 |
 |
Quadrant C |
| Plot type | Count rate plots | Images |
|---|---|---|
| Comparison with Poisson distribution Blue bars denote a histogram of data divided into 1 sec bins. Red curve is a Poisson curve with rate = median count rate of data. |
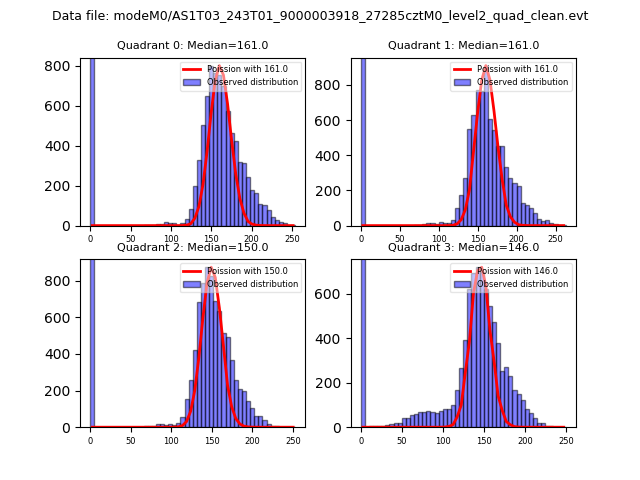 |
 |
| Quadrant-wise count rates Data is divided into 100 sec bins |
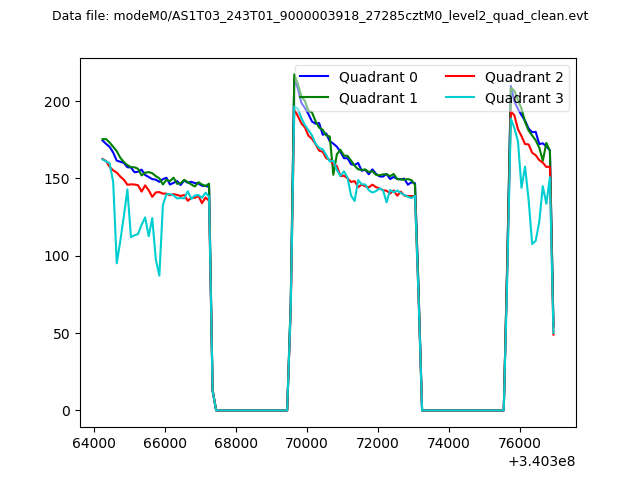 |
|
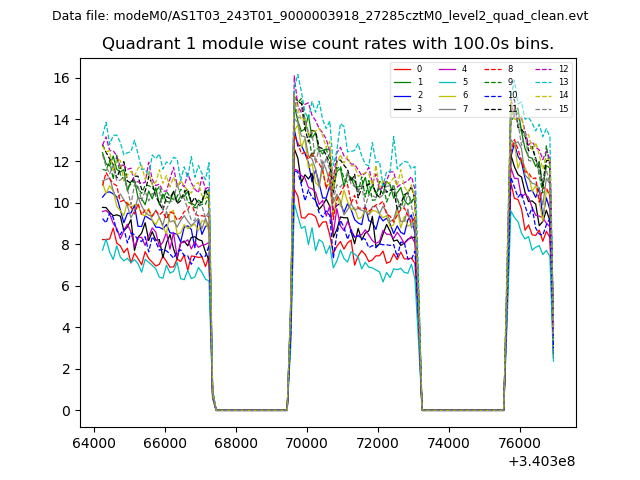
| Module-wise count rates for Quadrant A Data is divided into 100 sec bins |
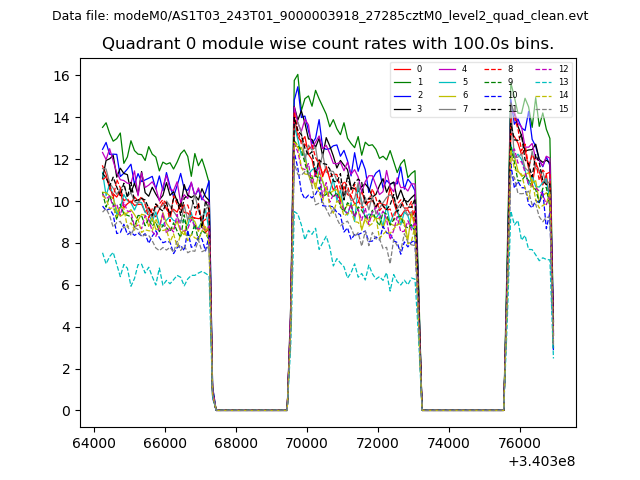 |
 |
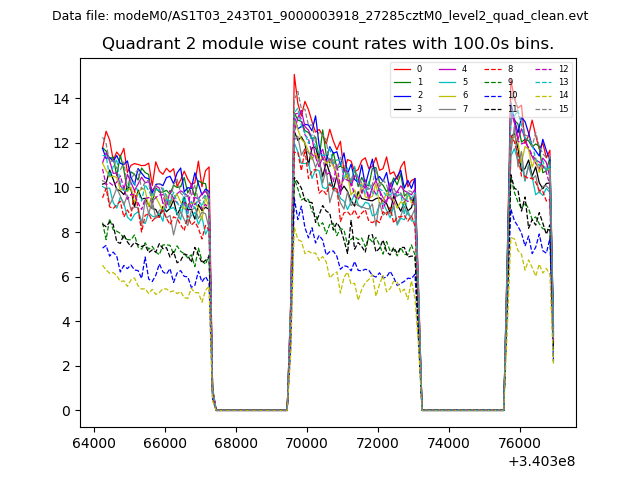
| Module-wise count rates for Quadrant B Data is divided into 100 sec bins |
 |
 |
| Module-wise count rates for Quadrant C Data is divided into 100 sec bins |
 |
 |
| Module-wise count rates for Quadrant D Data is divided into 100 sec bins |
 |
 |
| Parameter | Plot |
|---|---|
| CZT HV Monitor | 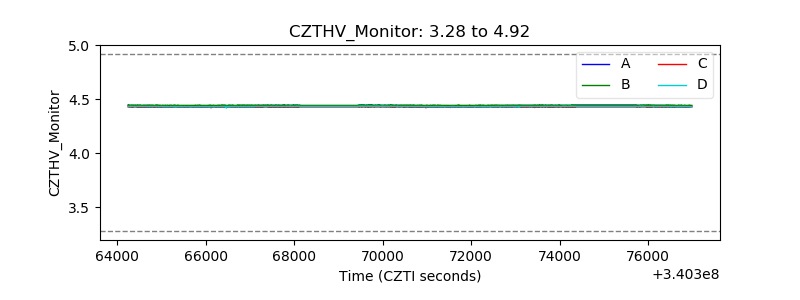 |
| D_VDD | 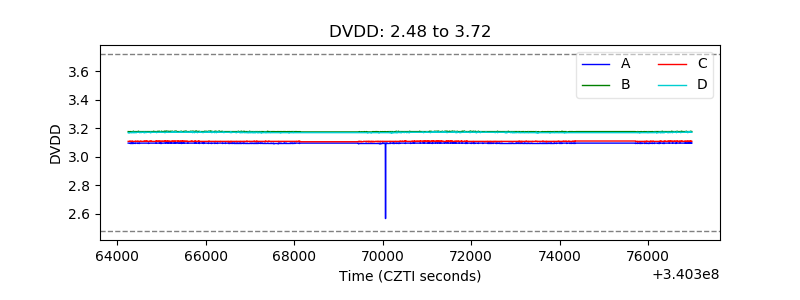 |
| Temperature 1 | 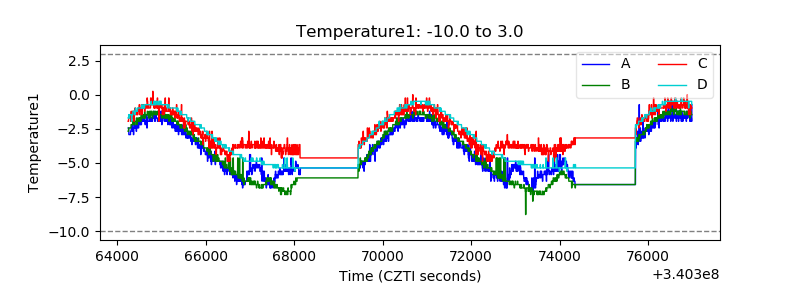 |
| Veto HV Monitor | 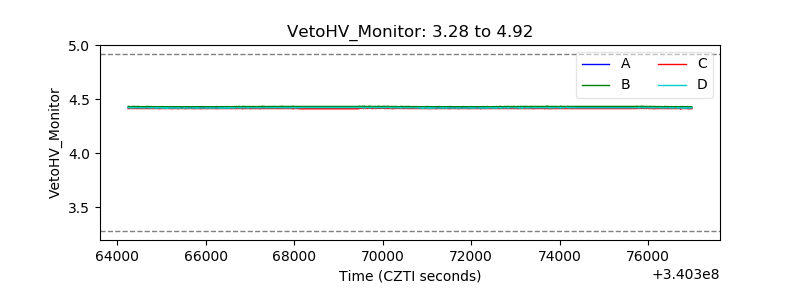 |
| Veto LLD | 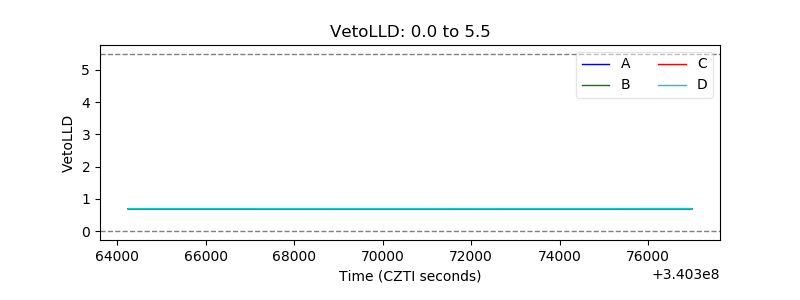 |
| Alpha Counter | 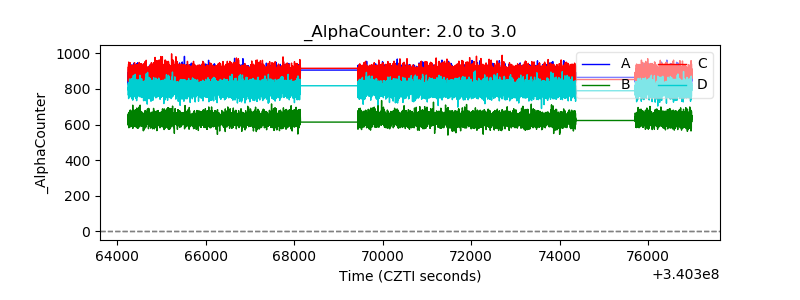 |
| _CPM_Rate | 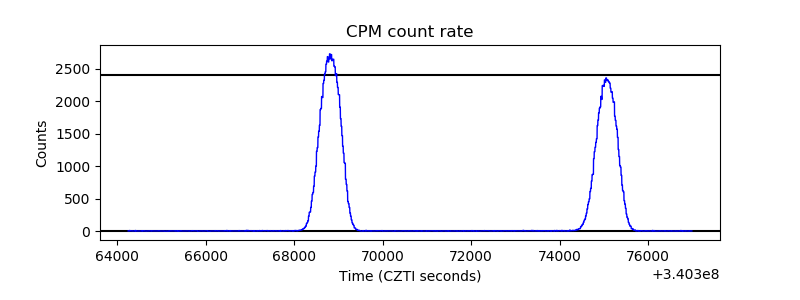 |
| CZT Counter | 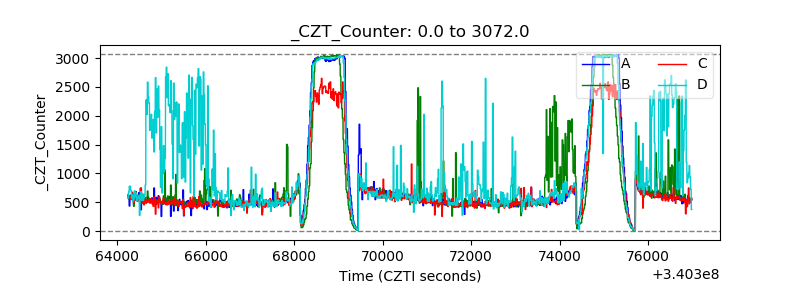 |
| +2.5 Volts monitor | 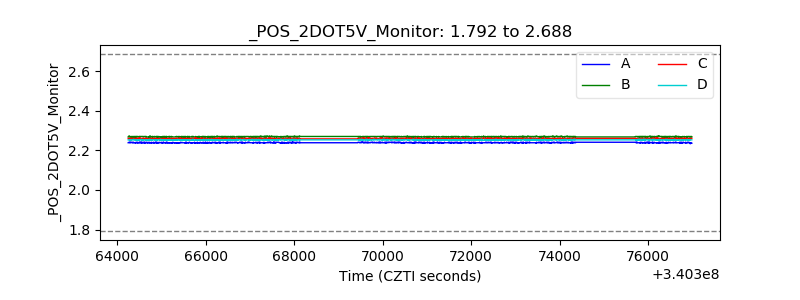 |
| +5 Volts monitor | 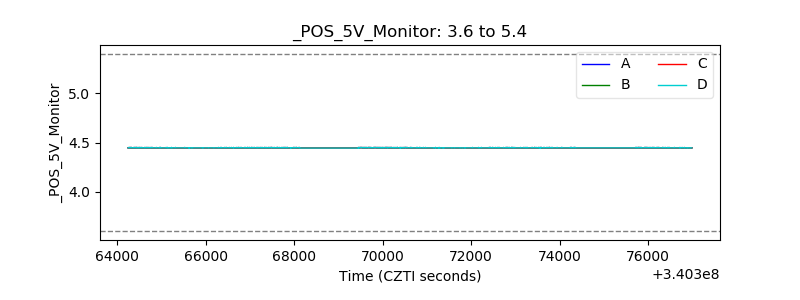 |
| _ROLL_ROT | 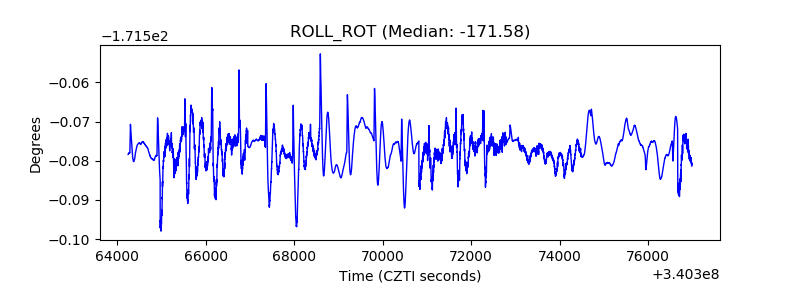 |
| _Roll_DEC |  |
| _Roll_RA | 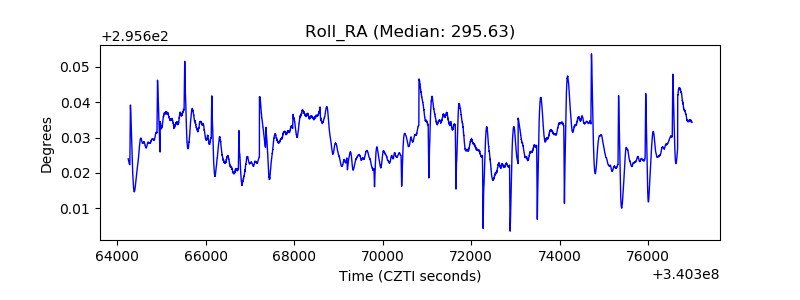 |
| Veto Counter | 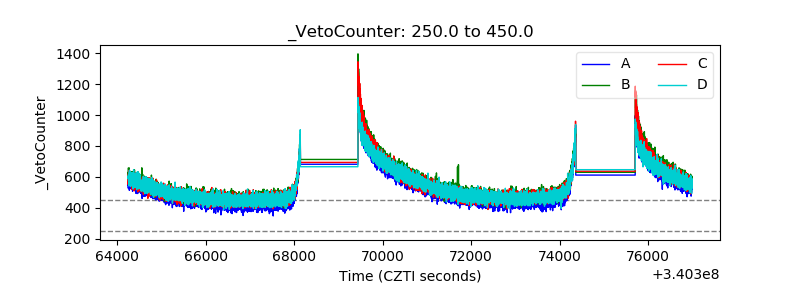 |