| Param | Original file | Final file |
|---|---|---|
| Filename | modeM0/AS1T03_243T01_9000003918_27287cztM0_level2.evt | modeM0/AS1T03_243T01_9000003918_27287cztM0_level2_quad_clean.evt |
| Size (bytes) | 493,188,480 | 95,800,320 |
| Size | 470.3 MB | 91.4 MB |
| Events in quadrant A | 3,354,928 | 632,712 |
| Events in quadrant B | 3,893,378 | 638,521 |
| Events in quadrant C | 3,262,148 | 596,656 |
| Events in quadrant D | 3,990,679 | 586,167 |
| Mode M9 | |||
|---|---|---|---|
| Quadrant | BADHDUFLAG | Total packets | Discarded packets |
| A | 0 | 11 | 0 |
| B | 0 | 11 | 0 |
| C | 0 | 11 | 0 |
| D | 0 | 11 | 0 |
| Mode M0 | |||
|---|---|---|---|
| Quadrant | BADHDUFLAG | Total packets | Discarded packets |
| A | 0 | 13947 | 0 |
| B | 0 | 15609 | 0 |
| C | 0 | 13678 | 0 |
| D | 0 | 16005 | 0 |
| Quadrant | Total seconds | Saturated seconds | Saturation percentage |
|---|---|---|---|
| A | 6411 | 91 | 1.419435% |
| B | 6411 | 151 | 2.355327% |
| C | 6411 | 128 | 1.996568% |
| D | 6412 | 138 | 2.152215% |
Noise dominated data is calculated using 1-second bins in cleaned event files. If a bin has >2000 counts, and if more than 50% of those come from <1% of pixels, then it is considered to be noise-dominated and hence unusable.
| Quadrant | # 1 sec bins | Bins with >0 counts | Bins with >2000 counts | High rate bins dominated by noise | Noise dominated (total time) | Noise dominated (detector-on time) | Marked lightcurve |
|---|---|---|---|---|---|---|---|
| A | 7511 | 6412 | 3 | 3 | 0.04% | 0.05% | 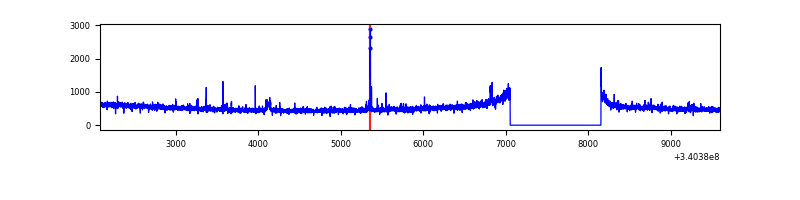 |
| B | 7511 | 6412 | 9 | 9 | 0.12% | 0.14% | 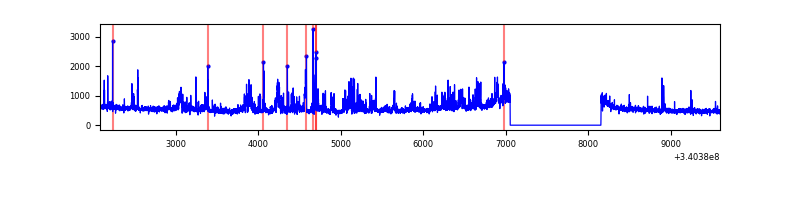 |
| C | 7511 | 6412 | 0 | 0 | 0.00% | 0.00% | 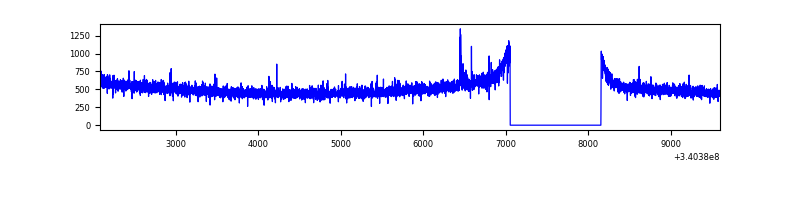 |
| D | 7511 | 6412 | 76 | 76 | 1.01% | 1.19% | 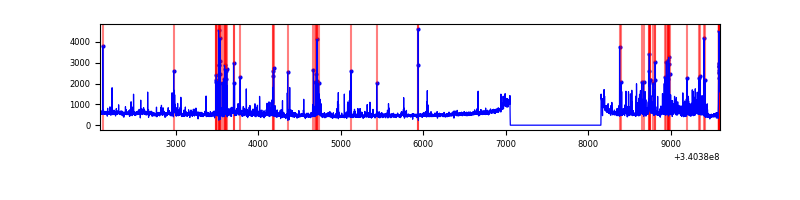 |
Top three noisy pixels from each quadrant. If the there are fewer than three noisy pixels in the level2.evt file, extra rows are filled as -1
| Pixel properties | Quadrant properties | ||||||
|---|---|---|---|---|---|---|---|
| Quadrant | DetID | PixID | Counts | Sigma | Mean | Median | Sigma |
| A | 15 | 174 | 27469 | 155.7 | 850 | 834 | 171.1 |
| A | 12 | 189 | 20883 | 117.2 | 850 | 834 | 171.1 |
| A | 12 | 96 | 19196 | 107.34 | 850 | 834 | 171.1 |
| B | 10 | 245 | 604340 | 3807.5 | 838 | 820 | 158.5 |
| B | 12 | 111 | 18876 | 113.91 | 838 | 820 | 158.5 |
| B | 11 | 111 | 16875 | 101.29 | 838 | 820 | 158.5 |
| C | 14 | 238 | 128018 | 684.43 | 798 | 805 | 185.9 |
| C | 15 | 208 | 20836 | 107.77 | 798 | 805 | 185.9 |
| C | 13 | 61 | 5545 | 25.5 | 798 | 805 | 185.9 |
| D | 1 | 52 | 606562 | 2963.93 | 807 | 789 | 204.4 |
| D | 2 | 250 | 215179 | 1048.97 | 807 | 789 | 204.4 |
| D | 12 | 227 | 69996 | 338.62 | 807 | 789 | 204.4 |
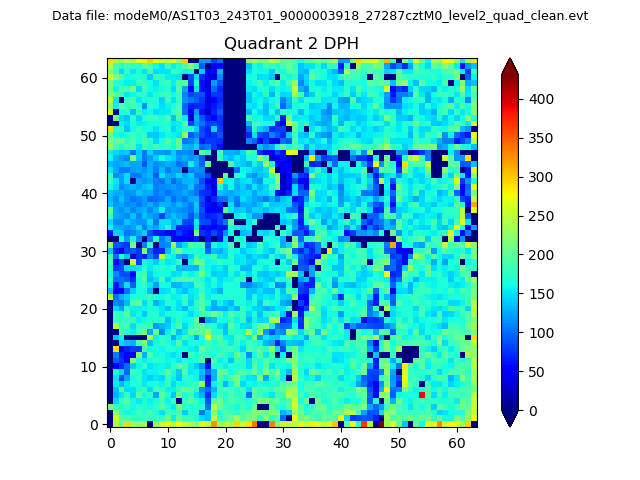
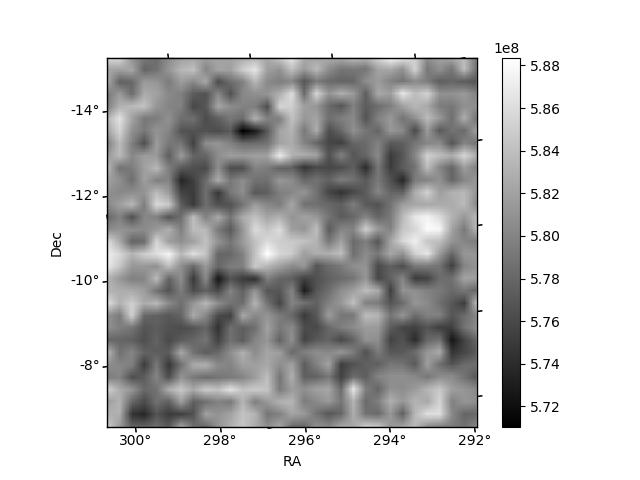
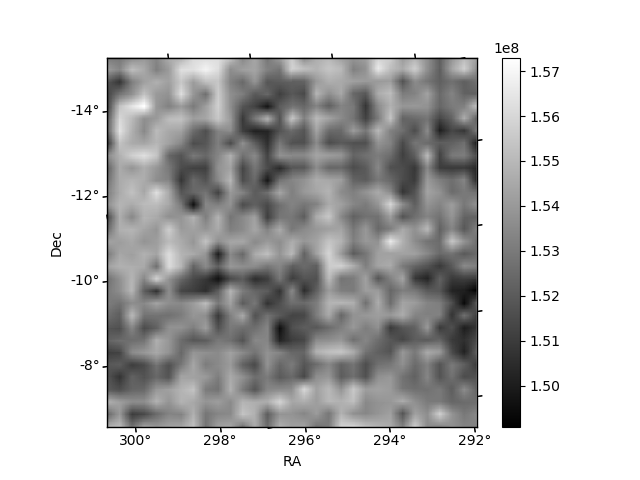
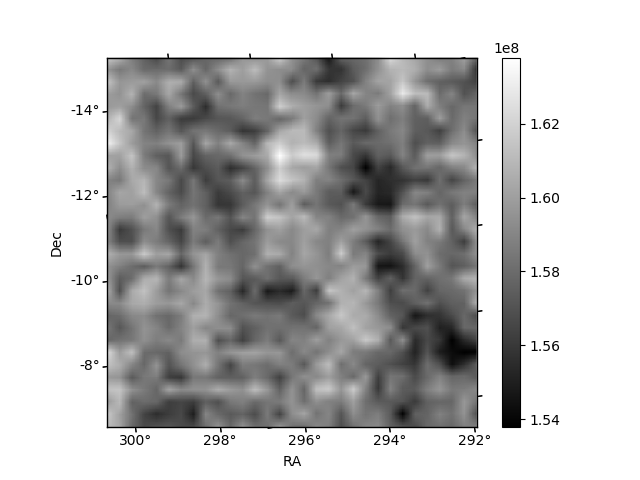
Histogram calculated using DETX and DETY for each event in the final _common_clean file
| Quadrant A | 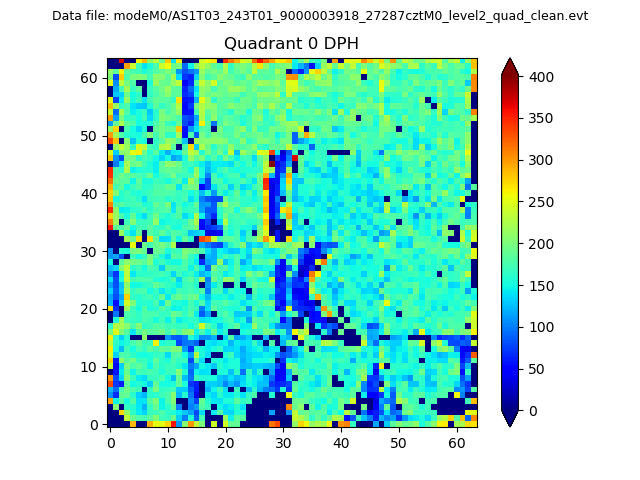 |
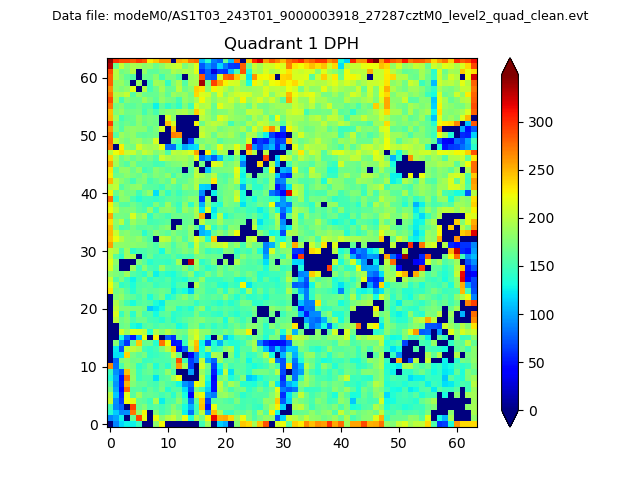 |
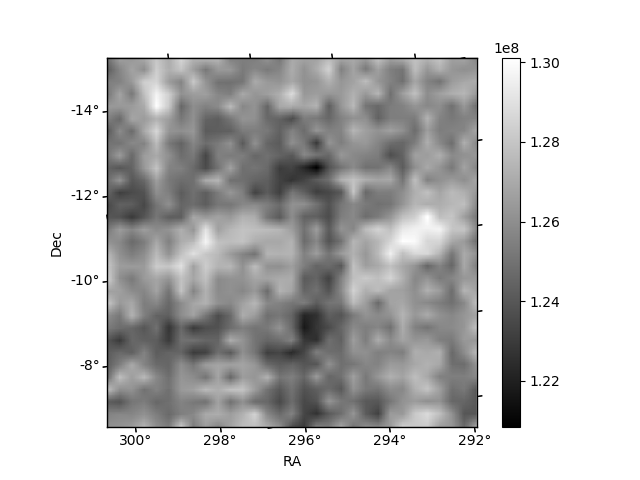
Quadrant B |
|---|---|---|---|
| Quadrant D | 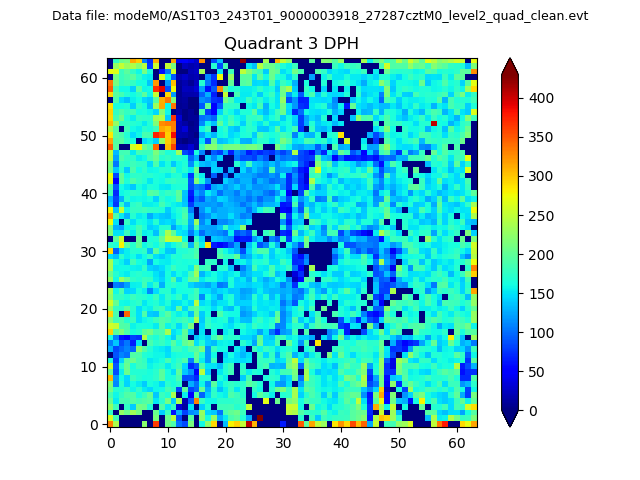 |
 |
Quadrant C |
| Plot type | Count rate plots | Images |
|---|---|---|
| Comparison with Poisson distribution Blue bars denote a histogram of data divided into 1 sec bins. Red curve is a Poisson curve with rate = median count rate of data. |
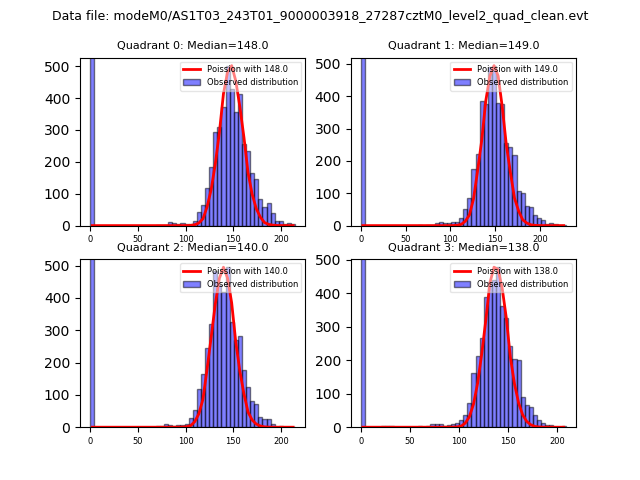 |
 |
| Quadrant-wise count rates Data is divided into 100 sec bins |
 |
|
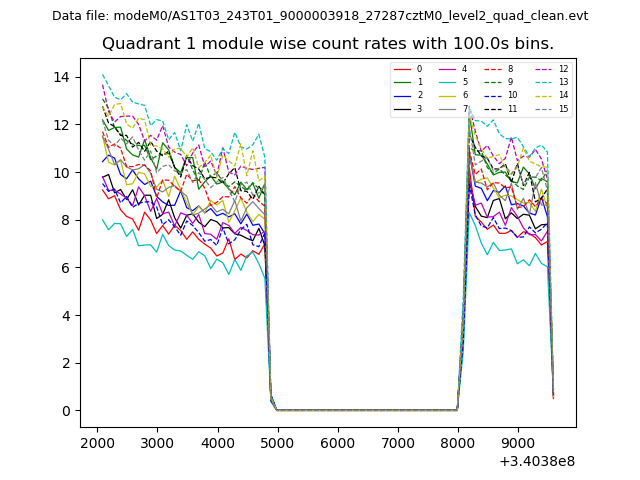
| Module-wise count rates for Quadrant A Data is divided into 100 sec bins |
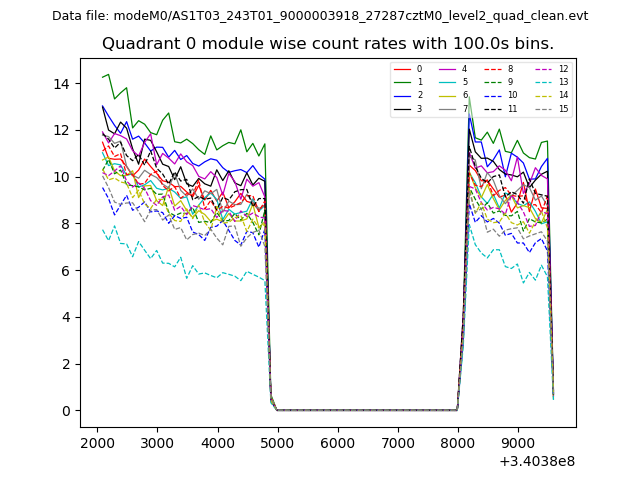 |
 |
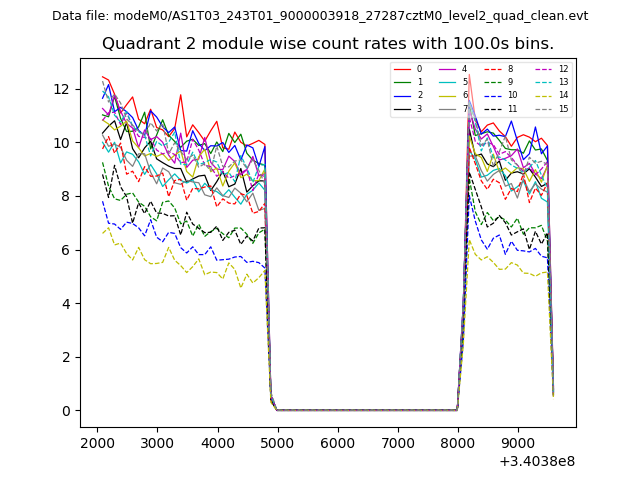
| Module-wise count rates for Quadrant B Data is divided into 100 sec bins |
 |
 |
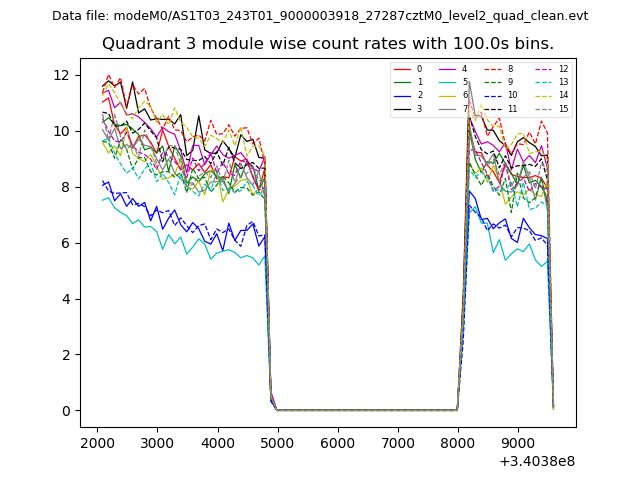
| Module-wise count rates for Quadrant C Data is divided into 100 sec bins |
 |
 |
| Module-wise count rates for Quadrant D Data is divided into 100 sec bins |
 |
 |
| Parameter | Plot |
|---|---|
| CZT HV Monitor | 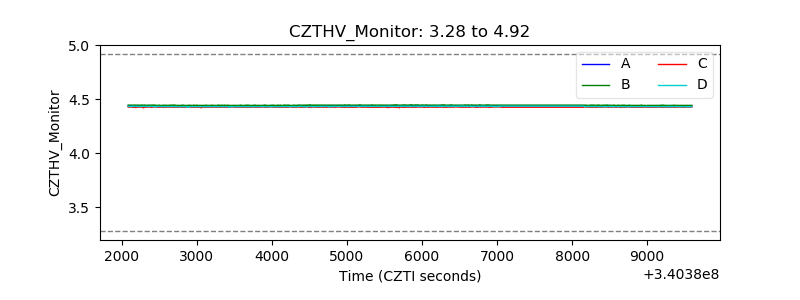 |
| D_VDD | 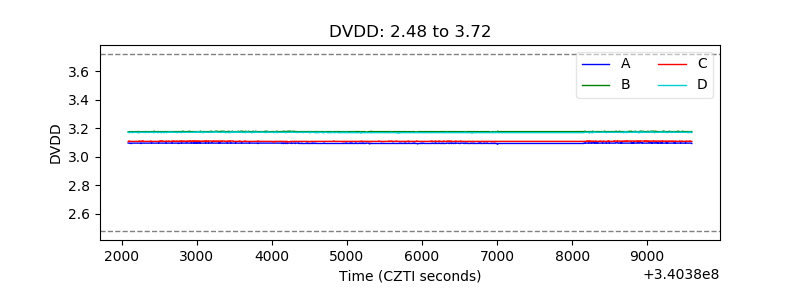 |
| Temperature 1 | 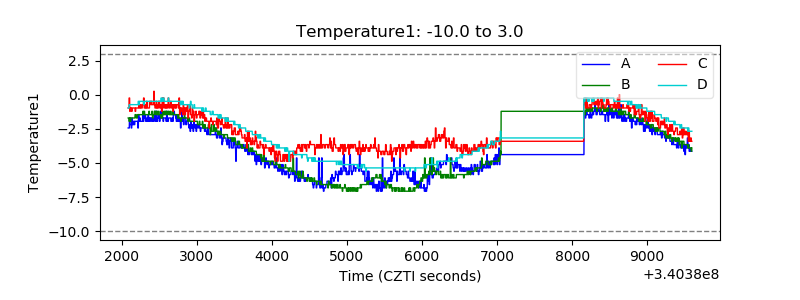 |
| Veto HV Monitor | 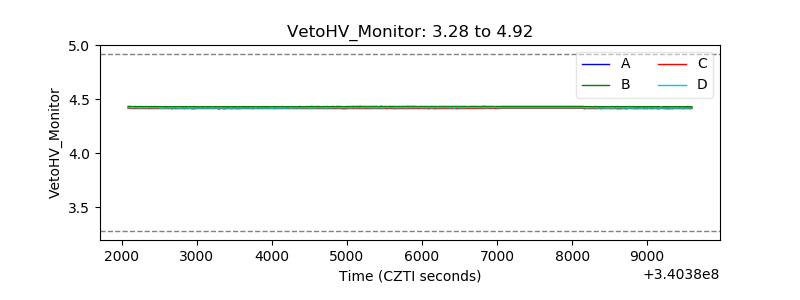 |
| Veto LLD | 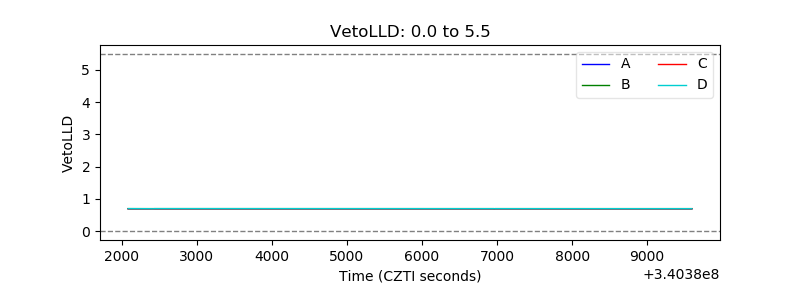 |
| Alpha Counter | 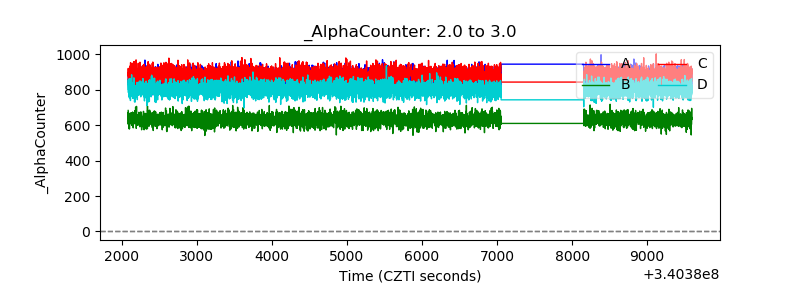 |
| _CPM_Rate |  |
| CZT Counter | 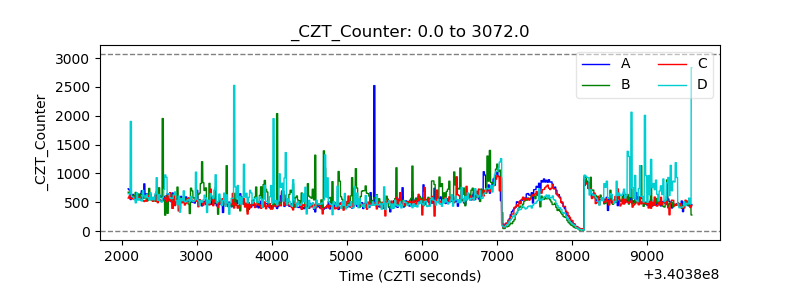 |
| +2.5 Volts monitor |  |
| +5 Volts monitor |  |
| _ROLL_ROT | 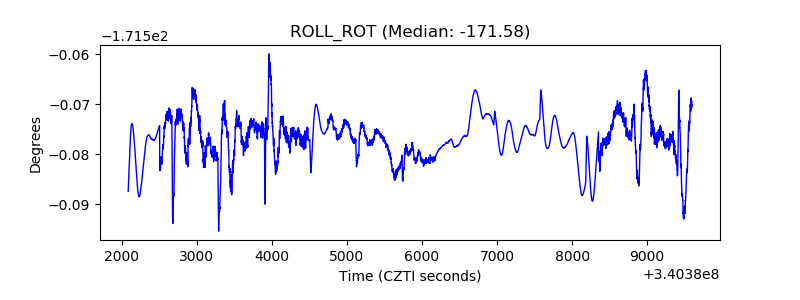 |
| _Roll_DEC | 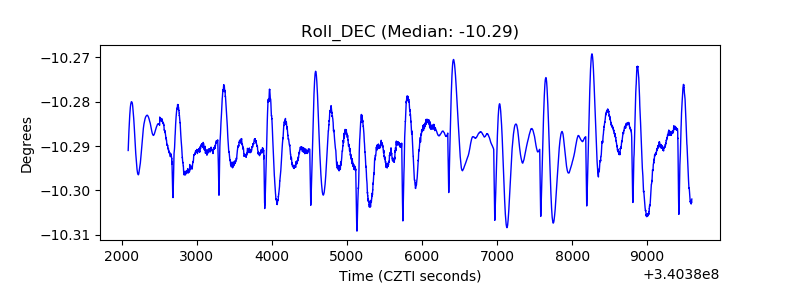 |
| _Roll_RA | 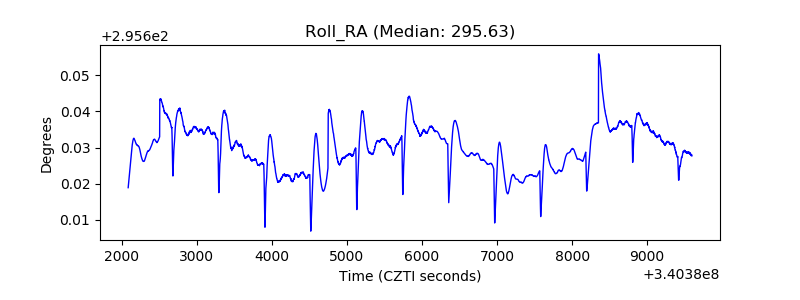 |
| Veto Counter | 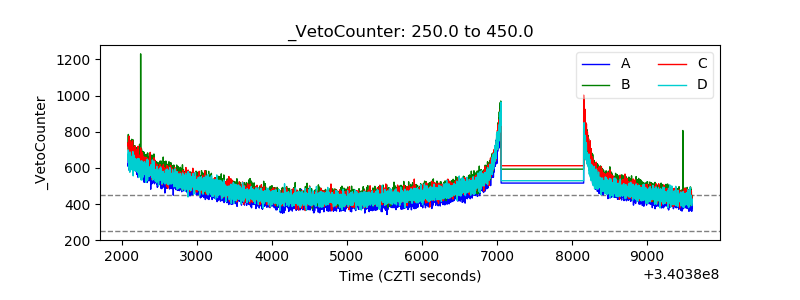 |