| Param | Original file | Final file |
|---|---|---|
| Filename | modeM0/AS1T03_243T01_9000003918_27290cztM0_level2.evt | modeM0/AS1T03_243T01_9000003918_27290cztM0_level2_quad_clean.evt |
| Size (bytes) | 643,253,760 | 118,638,720 |
| Size | 613.5 MB | 113.1 MB |
| Events in quadrant A | 4,061,204 | 786,260 |
| Events in quadrant B | 4,321,794 | 796,203 |
| Events in quadrant C | 4,017,740 | 752,453 |
| Events in quadrant D | 6,518,815 | 682,335 |
| Mode M9 | |||
|---|---|---|---|
| Quadrant | BADHDUFLAG | Total packets | Discarded packets |
| A | 0 | 4 | 0 |
| B | 0 | 4 | 0 |
| C | 0 | 4 | 0 |
| D | 0 | 4 | 0 |
| Mode M0 | |||
|---|---|---|---|
| Quadrant | BADHDUFLAG | Total packets | Discarded packets |
| A | 0 | 17406 | 0 |
| B | 0 | 18114 | 0 |
| C | 0 | 17198 | 0 |
| D | 0 | 25092 | 0 |
| Quadrant | Total seconds | Saturated seconds | Saturation percentage |
|---|---|---|---|
| A | 8271 | 107 | 1.293677% |
| B | 8272 | 179 | 2.163926% |
| C | 8272 | 152 | 1.837524% |
| D | 8272 | 959 | 11.593327% |
Noise dominated data is calculated using 1-second bins in cleaned event files. If a bin has >2000 counts, and if more than 50% of those come from <1% of pixels, then it is considered to be noise-dominated and hence unusable.
| Quadrant | # 1 sec bins | Bins with >0 counts | Bins with >2000 counts | High rate bins dominated by noise | Noise dominated (total time) | Noise dominated (detector-on time) | Marked lightcurve |
|---|---|---|---|---|---|---|---|
| A | 8811 | 8274 | 6 | 6 | 0.07% | 0.07% | 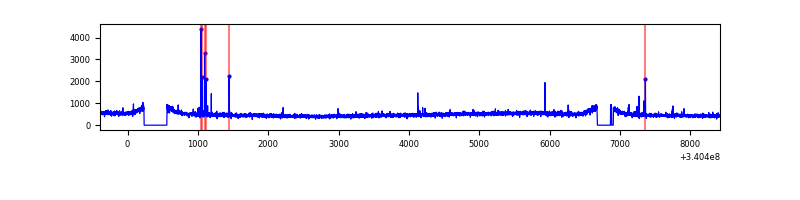 |
| B | 8812 | 8275 | 26 | 26 | 0.30% | 0.31% | 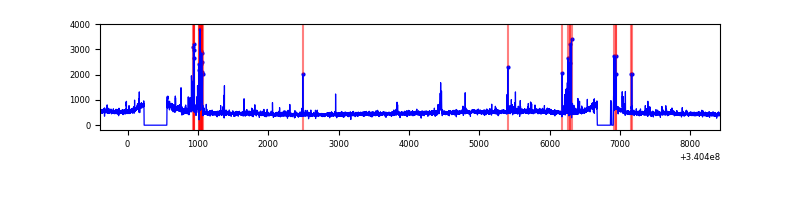 |
| C | 8812 | 8275 | 2 | 2 | 0.02% | 0.02% | 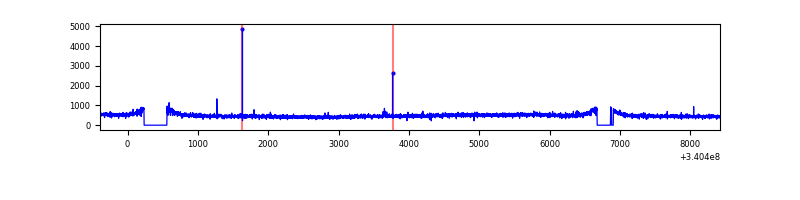 |
| D | 8812 | 8275 | 718 | 718 | 8.15% | 8.68% | 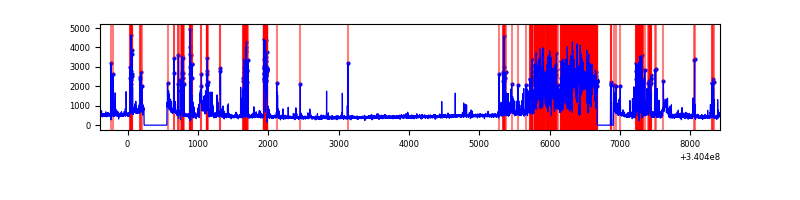 |
Top three noisy pixels from each quadrant. If the there are fewer than three noisy pixels in the level2.evt file, extra rows are filled as -1
| Pixel properties | Quadrant properties | ||||||
|---|---|---|---|---|---|---|---|
| Quadrant | DetID | PixID | Counts | Sigma | Mean | Median | Sigma |
| A | 13 | 248 | 50765 | 237.91 | 1036 | 1014 | 209.1 |
| A | 13 | 254 | 14852 | 66.17 | 1036 | 1014 | 209.1 |
| A | 15 | 174 | 10286 | 44.34 | 1036 | 1014 | 209.1 |
| B | 0 | 245 | 87312 | 435.88 | 1028 | 1002 | 198.0 |
| B | 10 | 245 | 61620 | 306.13 | 1028 | 1002 | 198.0 |
| B | 5 | 172 | 53098 | 263.09 | 1028 | 1002 | 198.0 |
| C | 14 | 238 | 157524 | 674.34 | 984 | 989 | 232.1 |
| C | 15 | 208 | 15778 | 63.71 | 984 | 989 | 232.1 |
| C | 2 | 16 | 9138 | 35.11 | 984 | 989 | 232.1 |
| D | 12 | 233 | 1658748 | 7117.23 | 936 | 910 | 232.9 |
| D | 1 | 52 | 1061218 | 4551.99 | 936 | 910 | 232.9 |
| D | 2 | 250 | 202398 | 865.0 | 936 | 910 | 232.9 |
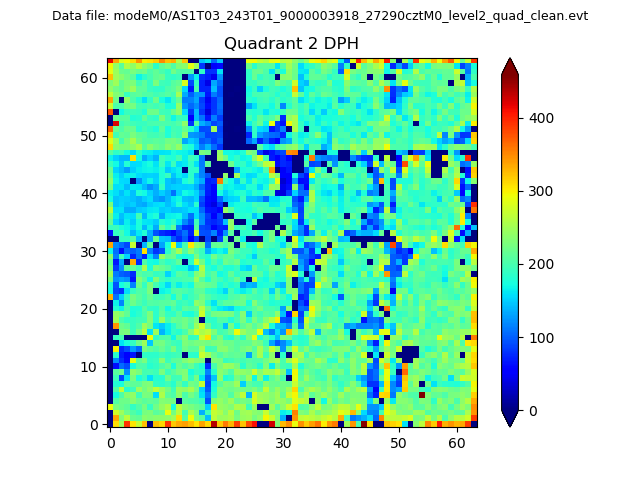
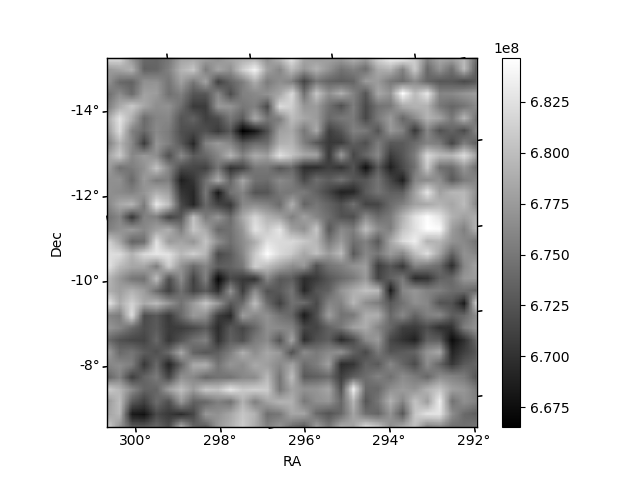
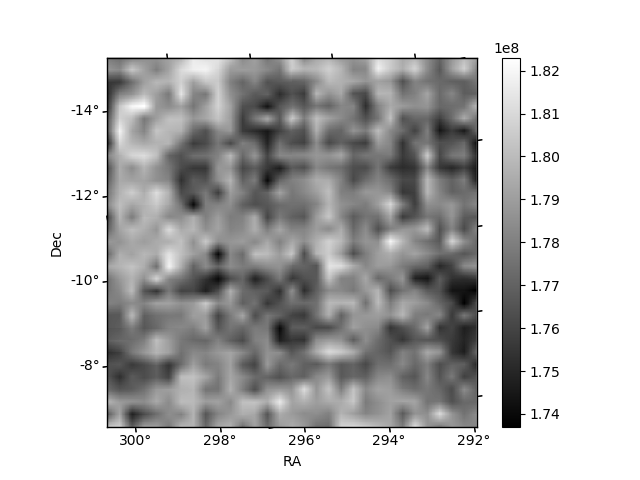
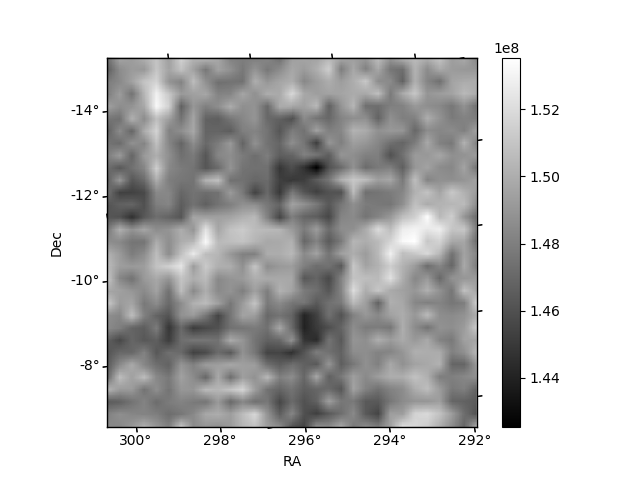
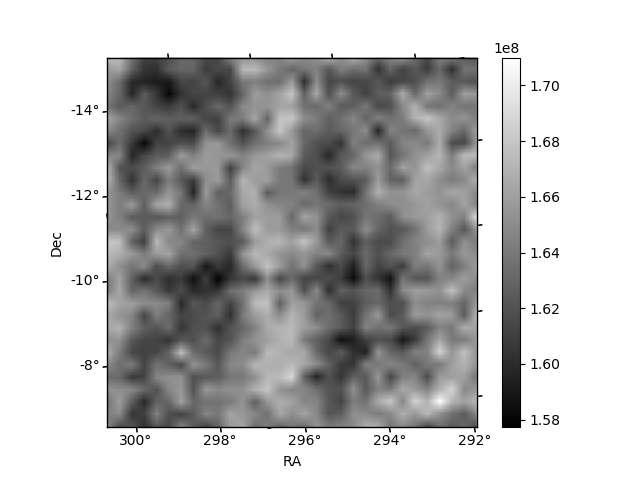
Histogram calculated using DETX and DETY for each event in the final _common_clean file
| Quadrant A | 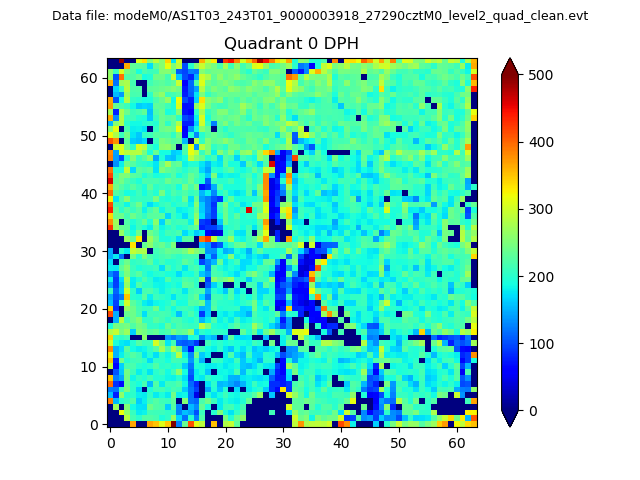 |
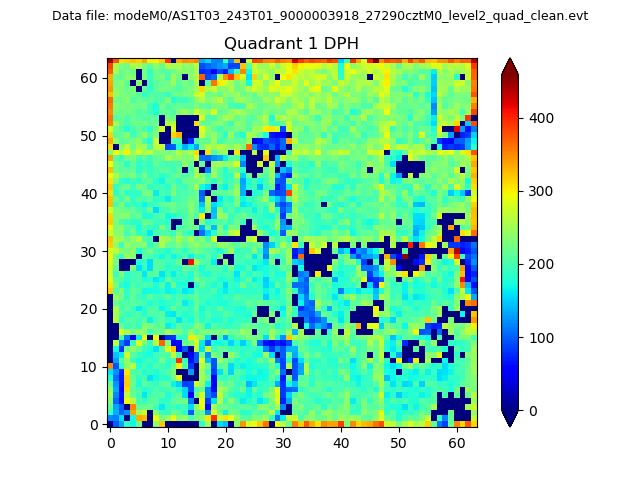 |
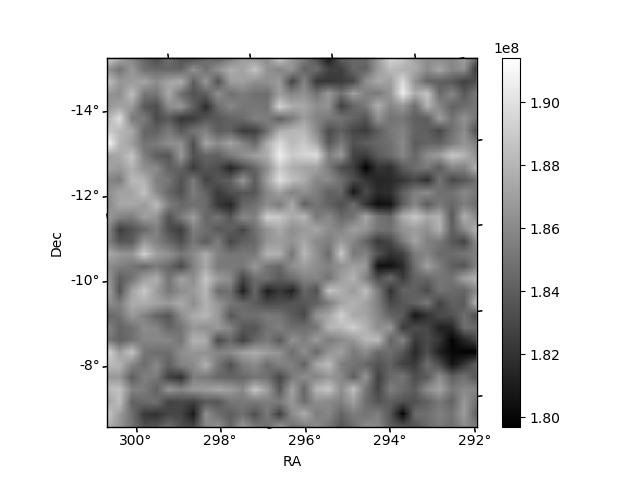
Quadrant B |
|---|---|---|---|
| Quadrant D | 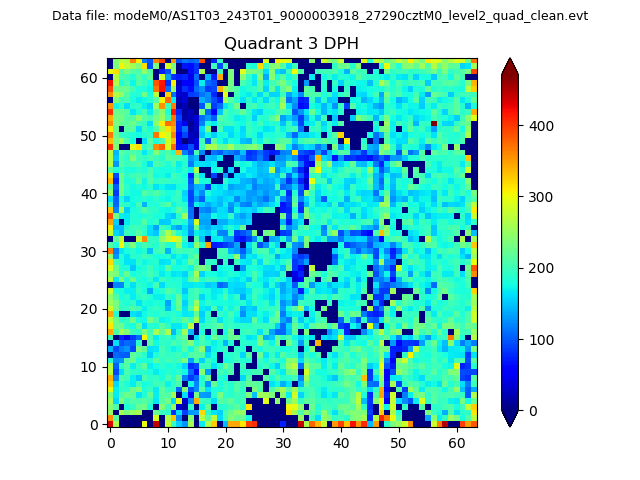 |
 |
Quadrant C |
| Plot type | Count rate plots | Images |
|---|---|---|
| Comparison with Poisson distribution Blue bars denote a histogram of data divided into 1 sec bins. Red curve is a Poisson curve with rate = median count rate of data. |
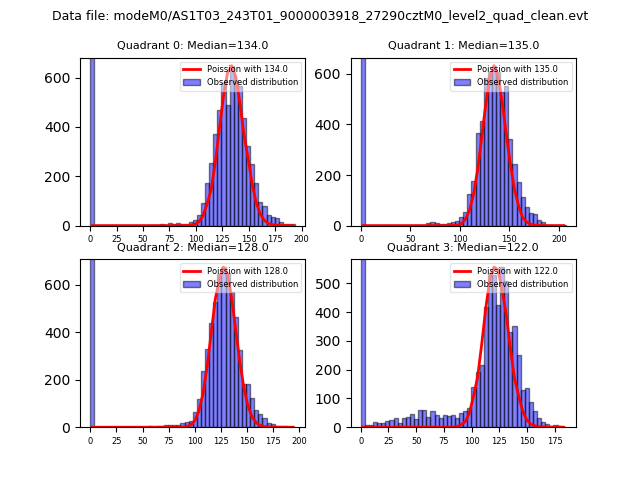 |
 |
| Quadrant-wise count rates Data is divided into 100 sec bins |
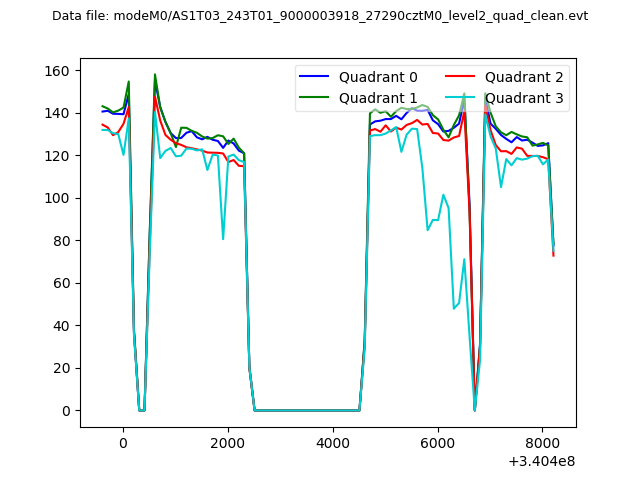 |
|
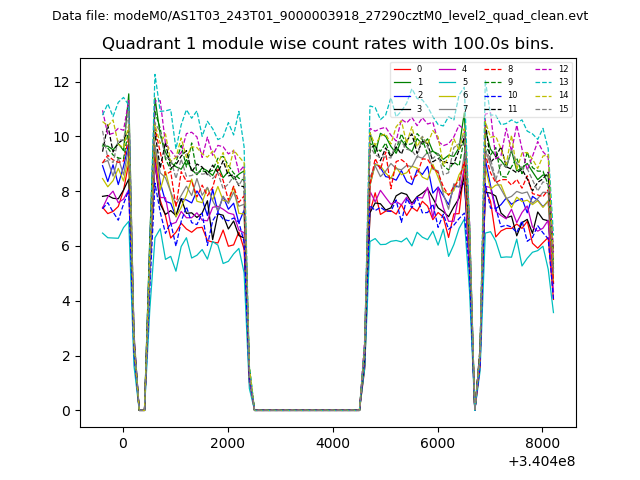
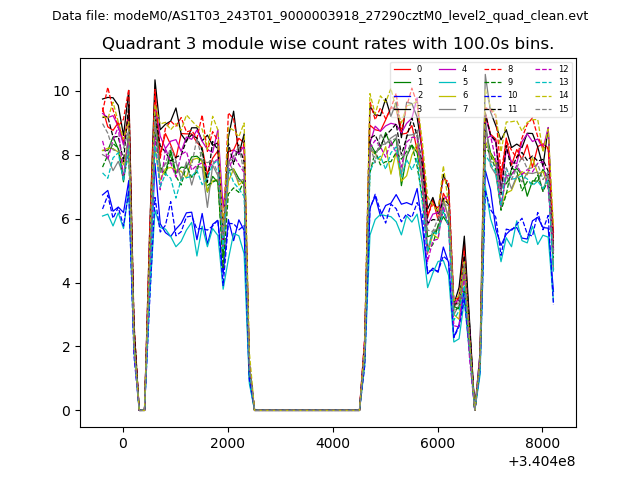
| Module-wise count rates for Quadrant A Data is divided into 100 sec bins |
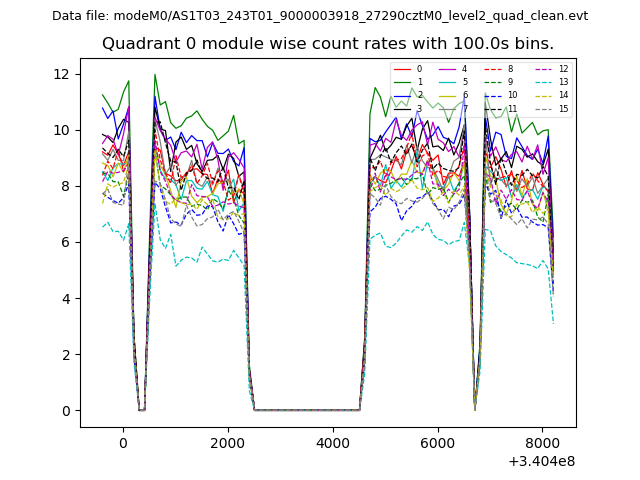 |
 |
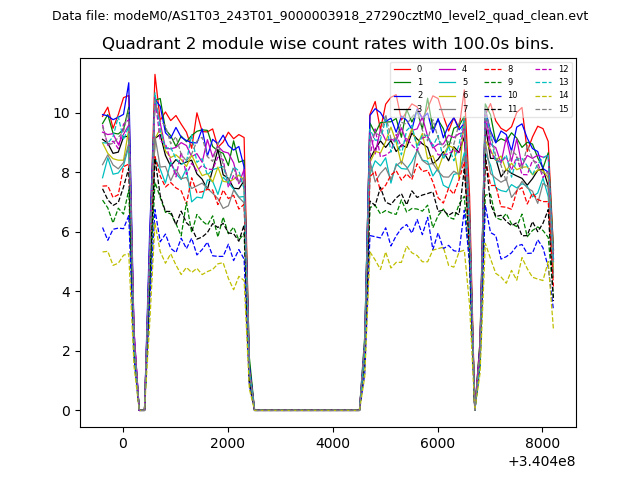
| Module-wise count rates for Quadrant B Data is divided into 100 sec bins |
 |
 |
| Module-wise count rates for Quadrant C Data is divided into 100 sec bins |
 |
 |
| Module-wise count rates for Quadrant D Data is divided into 100 sec bins |
 |
 |
| Parameter | Plot |
|---|---|
| CZT HV Monitor | 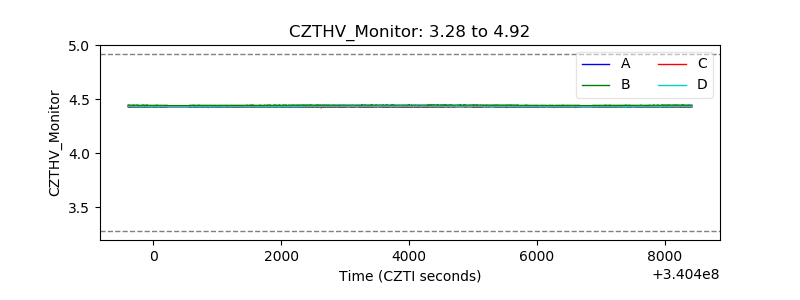 |
| D_VDD | 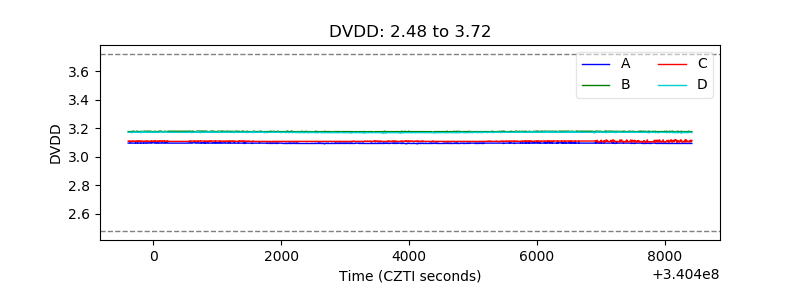 |
| Temperature 1 | 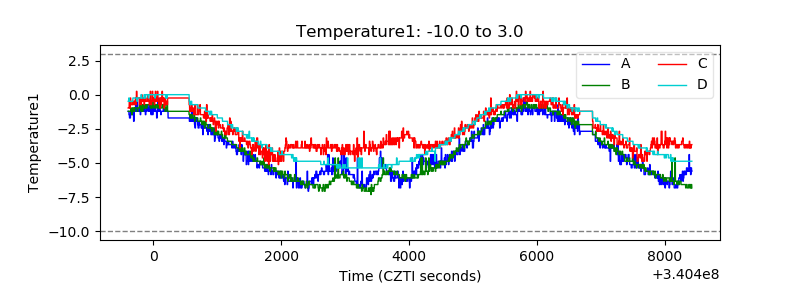 |
| Veto HV Monitor | 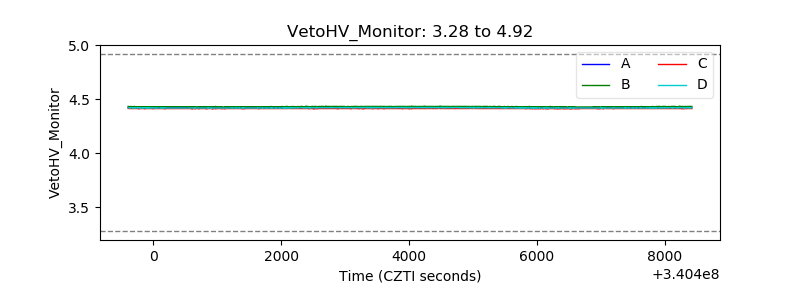 |
| Veto LLD | 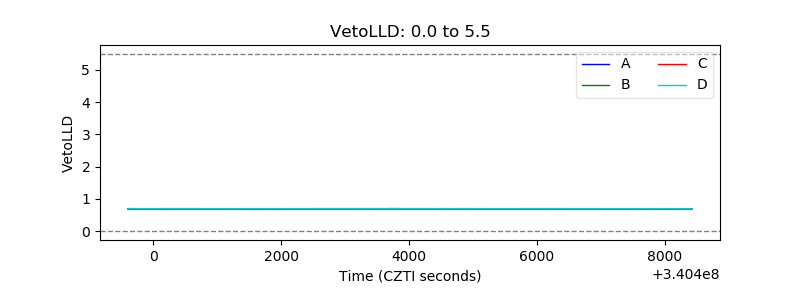 |
| Alpha Counter | 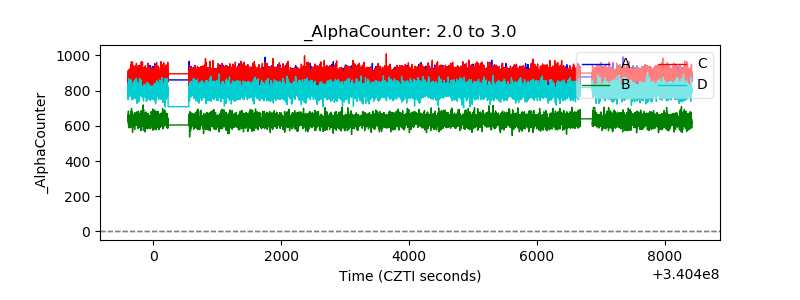 |
| _CPM_Rate | 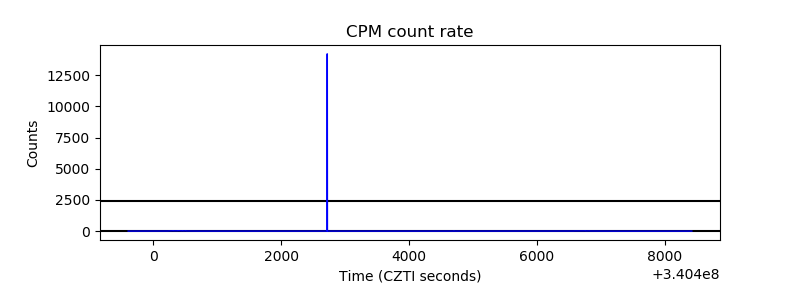 |
| CZT Counter | 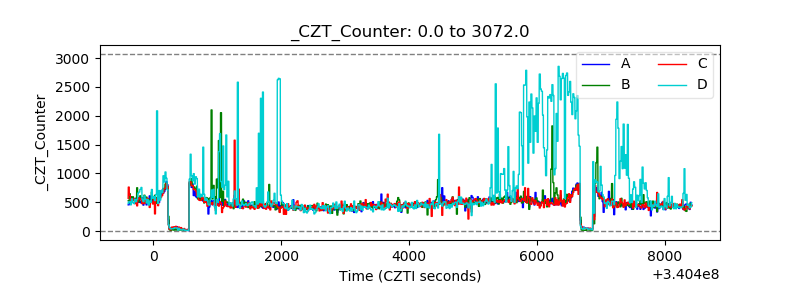 |
| +2.5 Volts monitor | 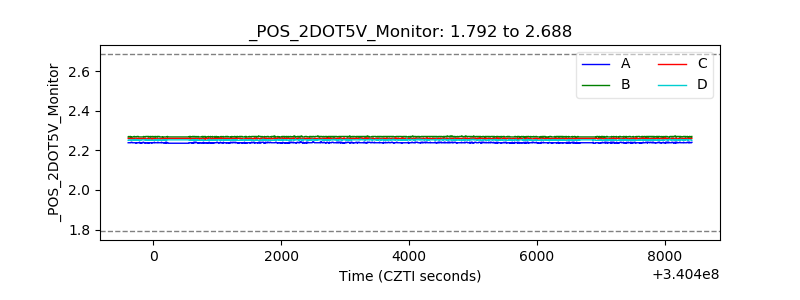 |
| +5 Volts monitor | 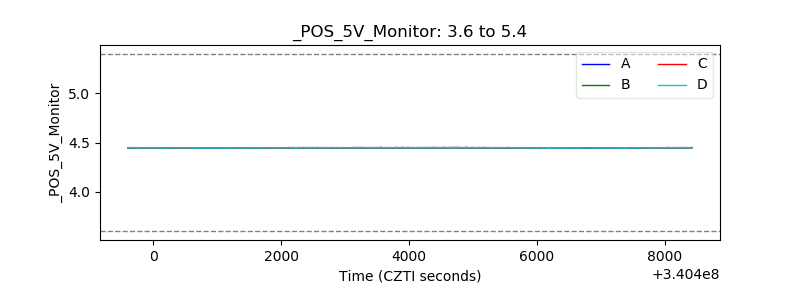 |
| _ROLL_ROT | 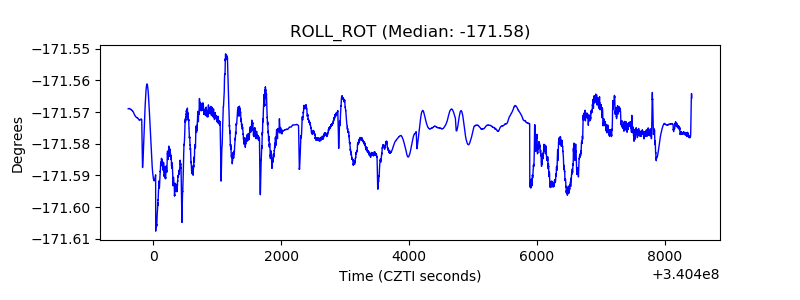 |
| _Roll_DEC | 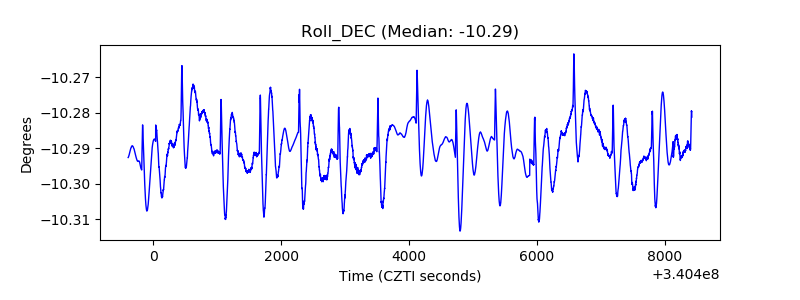 |
| _Roll_RA | 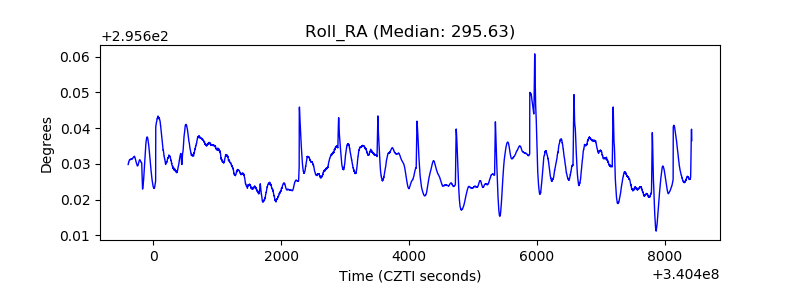 |
| Veto Counter | 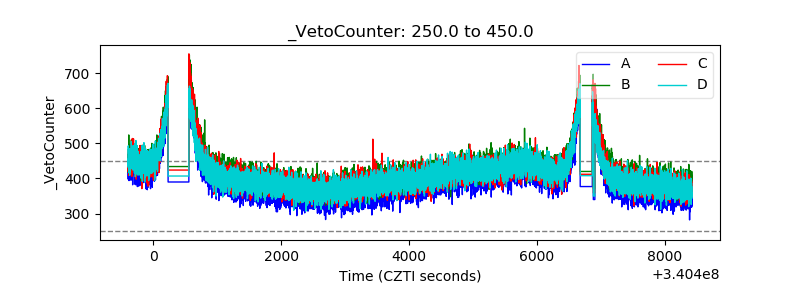 |