| Param | Original file | Final file |
|---|---|---|
| Filename | modeM0/AS1T03_243T01_9000003918_27293cztM0_level2.evt | modeM0/AS1T03_243T01_9000003918_27293cztM0_level2_quad_clean.evt |
| Size (bytes) | 1,459,474,560 | 232,764,480 |
| Size | 1.4 GB | 222.0 MB |
| Events in quadrant A | 9,326,478 | 1,465,863 |
| Events in quadrant B | 9,888,635 | 1,489,992 |
| Events in quadrant C | 9,296,398 | 1,415,306 |
| Events in quadrant D | 14,369,881 | 1,332,803 |
| Mode M9 | |||
|---|---|---|---|
| Quadrant | BADHDUFLAG | Total packets | Discarded packets |
| A | 0 | 18 | 0 |
| B | 0 | 18 | 0 |
| C | 0 | 18 | 0 |
| D | 0 | 18 | 0 |
| Mode M0 | |||
|---|---|---|---|
| Quadrant | BADHDUFLAG | Total packets | Discarded packets |
| A | 0 | 40214 | 0 |
| B | 0 | 40915 | 0 |
| C | 0 | 39915 | 0 |
| D | 0 | 56000 | 0 |
| Quadrant | Total seconds | Saturated seconds | Saturation percentage |
|---|---|---|---|
| A | 19517 | 151 | 0.773684% |
| B | 19517 | 231 | 1.183584% |
| C | 19517 | 208 | 1.065738% |
| D | 19517 | 1208 | 6.189476% |
Noise dominated data is calculated using 1-second bins in cleaned event files. If a bin has >2000 counts, and if more than 50% of those come from <1% of pixels, then it is considered to be noise-dominated and hence unusable.
| Quadrant | # 1 sec bins | Bins with >0 counts | Bins with >2000 counts | High rate bins dominated by noise | Noise dominated (total time) | Noise dominated (detector-on time) | Marked lightcurve |
|---|---|---|---|---|---|---|---|
| A | 21423 | 19522 | 18 | 18 | 0.08% | 0.09% | 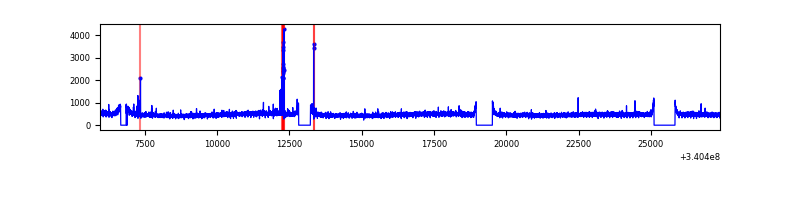 |
| B | 21423 | 19522 | 16 | 16 | 0.07% | 0.08% | 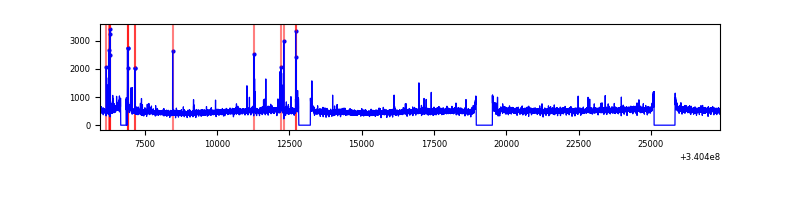 |
| C | 21423 | 19522 | 0 | 0 | 0.00% | 0.00% | 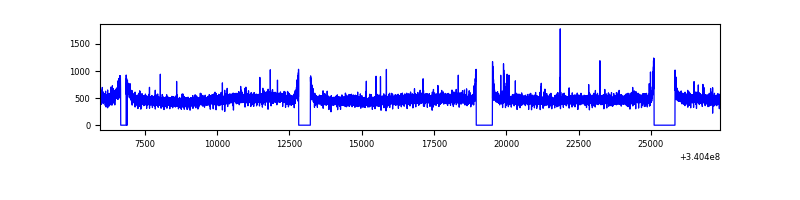 |
| D | 21423 | 19522 | 960 | 960 | 4.48% | 4.92% | 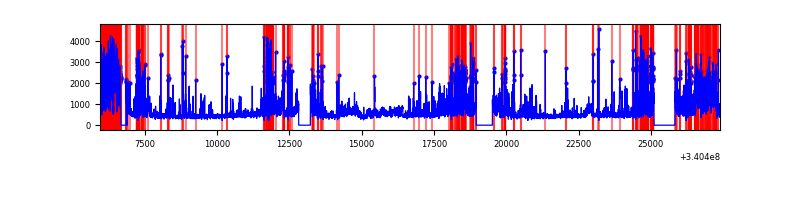 |
Top three noisy pixels from each quadrant. If the there are fewer than three noisy pixels in the level2.evt file, extra rows are filled as -1
| Pixel properties | Quadrant properties | ||||||
|---|---|---|---|---|---|---|---|
| Quadrant | DetID | PixID | Counts | Sigma | Mean | Median | Sigma |
| A | 13 | 248 | 104215 | 212.13 | 2389 | 2337 | 480.3 |
| A | 13 | 254 | 30873 | 59.42 | 2389 | 2337 | 480.3 |
| A | 3 | 137 | 22692 | 42.38 | 2389 | 2337 | 480.3 |
| B | 7 | 205 | 385221 | 841.7 | 2377 | 2317 | 454.9 |
| B | 12 | 111 | 56496 | 119.1 | 2377 | 2317 | 454.9 |
| B | 0 | 244 | 51764 | 108.7 | 2377 | 2317 | 454.9 |
| C | 14 | 238 | 364938 | 676.8 | 2276 | 2291 | 535.8 |
| C | 15 | 208 | 40968 | 72.18 | 2276 | 2291 | 535.8 |
| C | 13 | 61 | 15844 | 25.29 | 2276 | 2291 | 535.8 |
| D | 1 | 52 | 4120624 | 7623.85 | 2229 | 2180 | 540.2 |
| D | 12 | 233 | 1140503 | 2107.2 | 2229 | 2180 | 540.2 |
| D | 2 | 250 | 391604 | 720.88 | 2229 | 2180 | 540.2 |
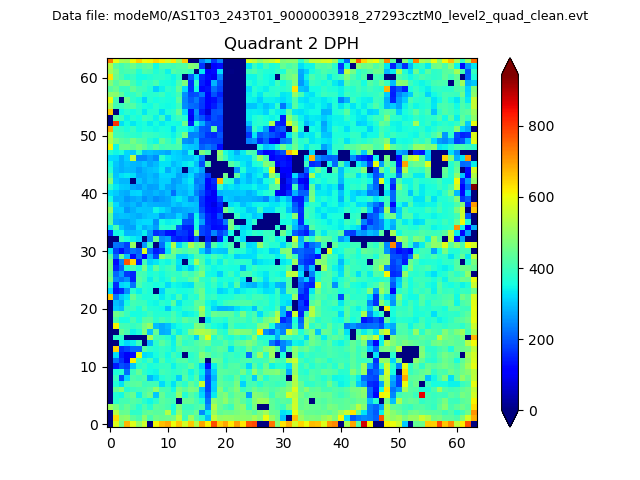
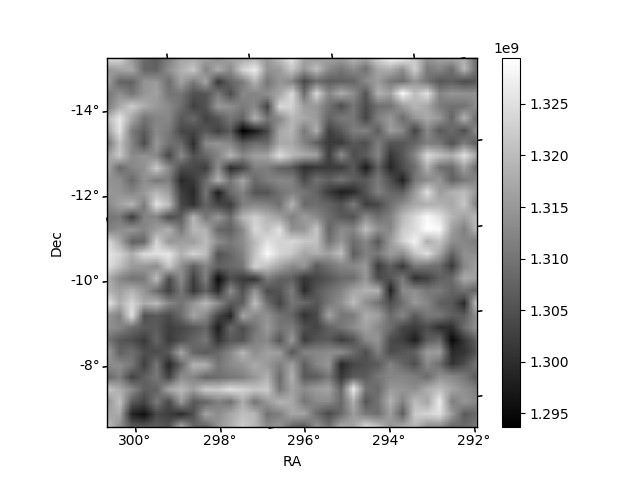
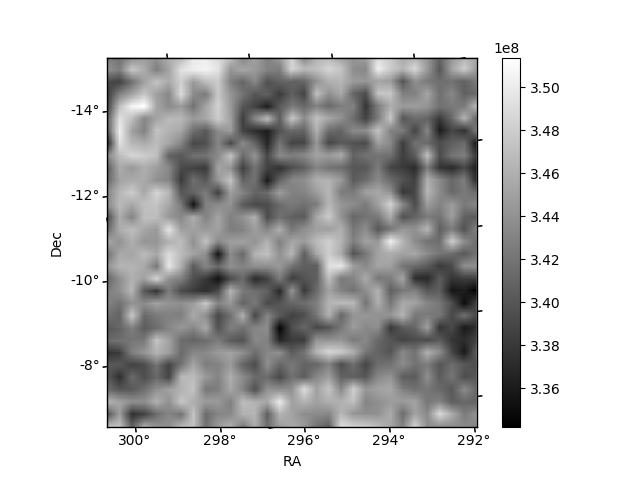
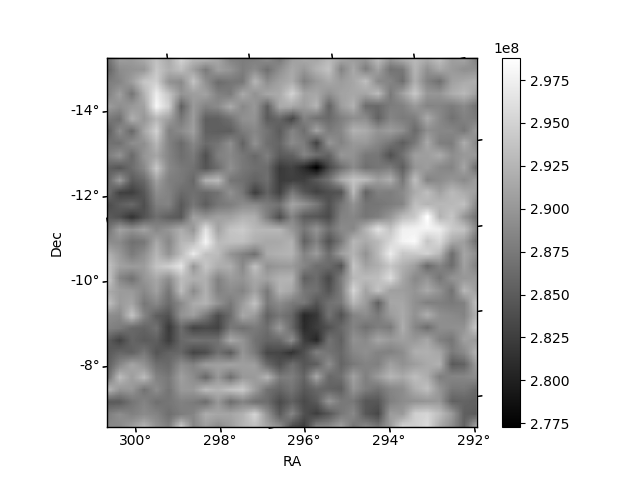
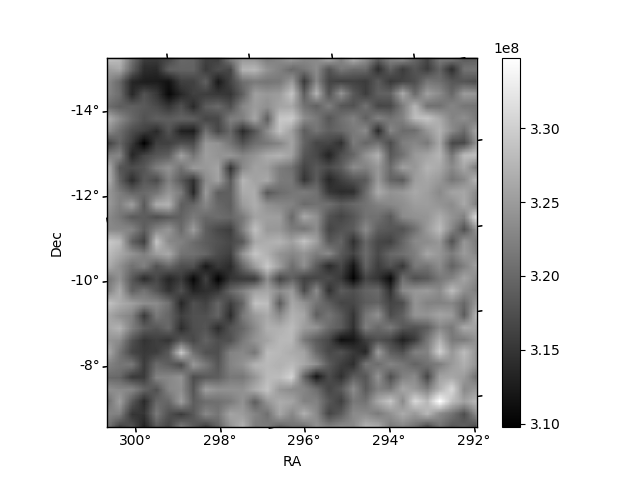
Histogram calculated using DETX and DETY for each event in the final _common_clean file
| Quadrant A | 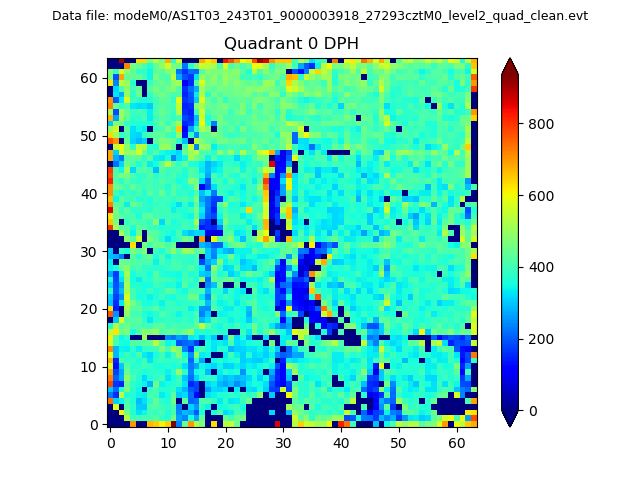 |
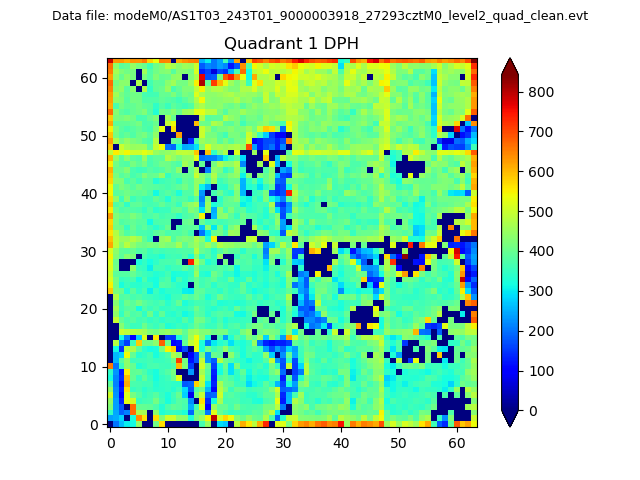 |
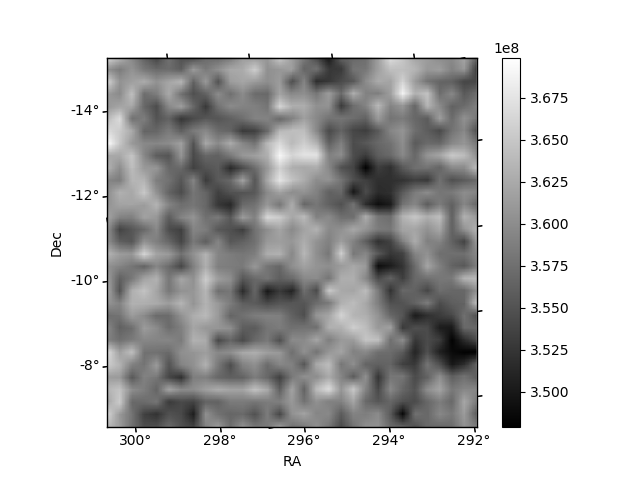
Quadrant B |
|---|---|---|---|
| Quadrant D | 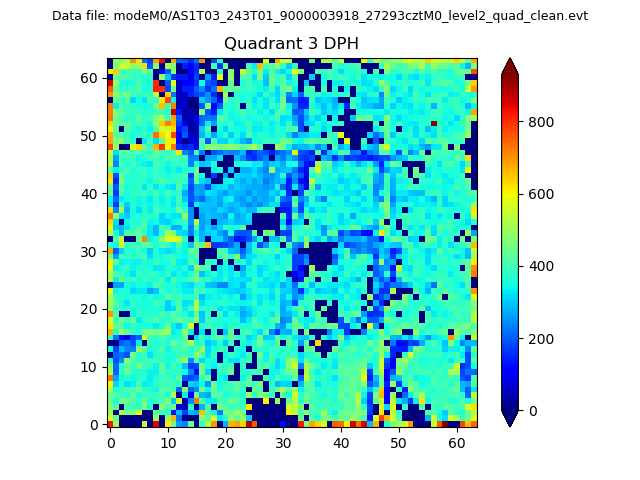 |
 |
Quadrant C |
| Plot type | Count rate plots | Images |
|---|---|---|
| Comparison with Poisson distribution Blue bars denote a histogram of data divided into 1 sec bins. Red curve is a Poisson curve with rate = median count rate of data. |
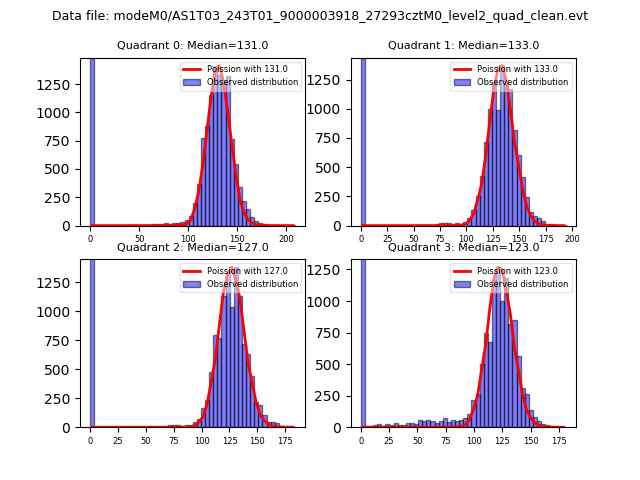 |
 |
| Quadrant-wise count rates Data is divided into 100 sec bins |
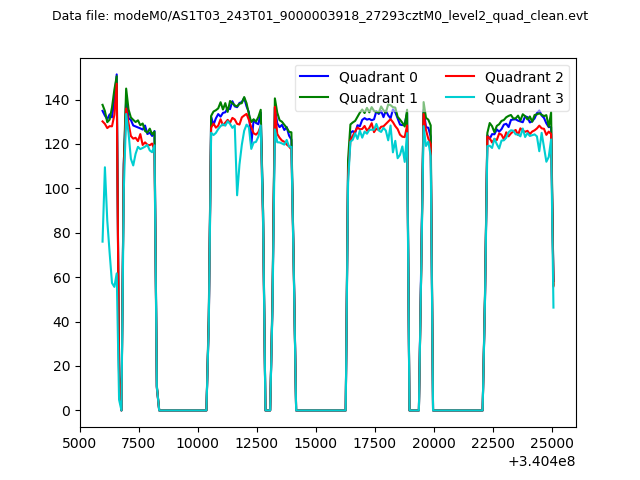 |
|
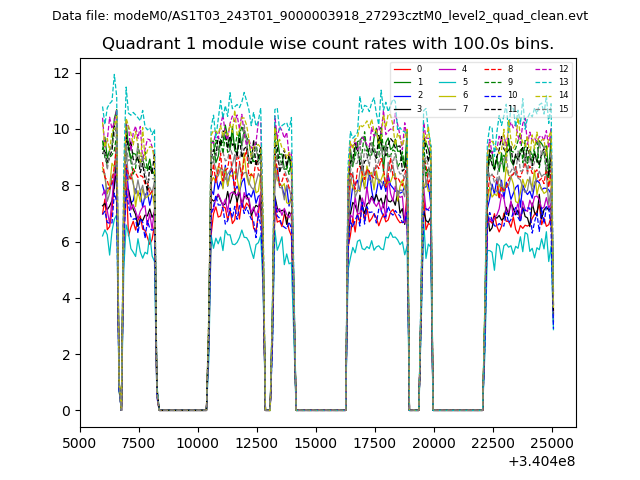
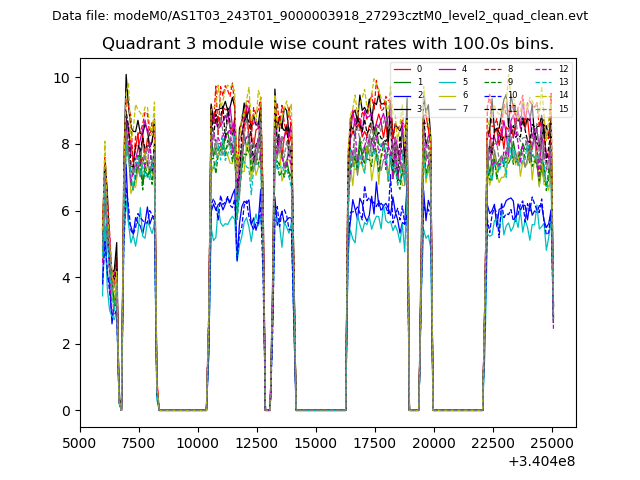
| Module-wise count rates for Quadrant A Data is divided into 100 sec bins |
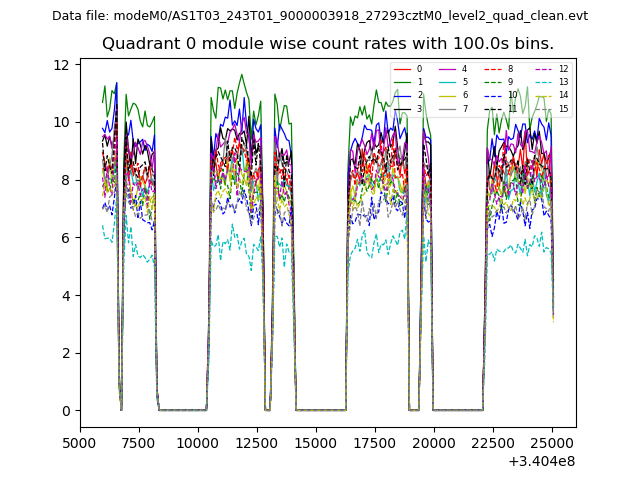 |
 |
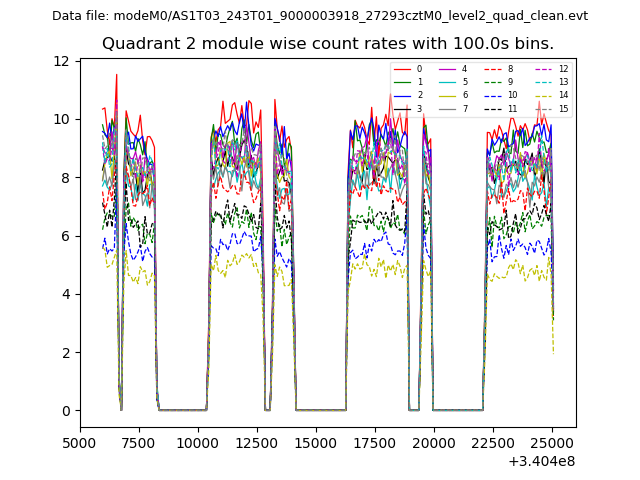
| Module-wise count rates for Quadrant B Data is divided into 100 sec bins |
 |
 |
| Module-wise count rates for Quadrant C Data is divided into 100 sec bins |
 |
 |
| Module-wise count rates for Quadrant D Data is divided into 100 sec bins |
 |
 |
| Parameter | Plot |
|---|---|
| CZT HV Monitor | 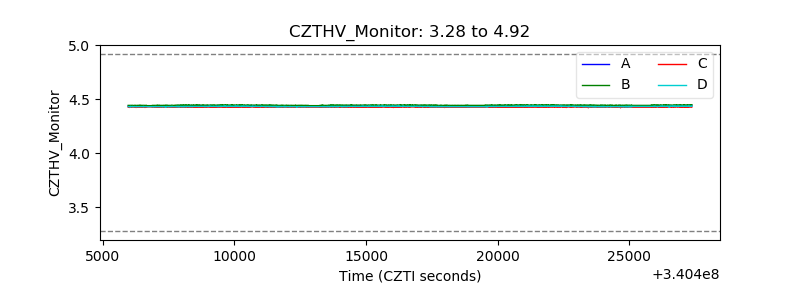 |
| D_VDD | 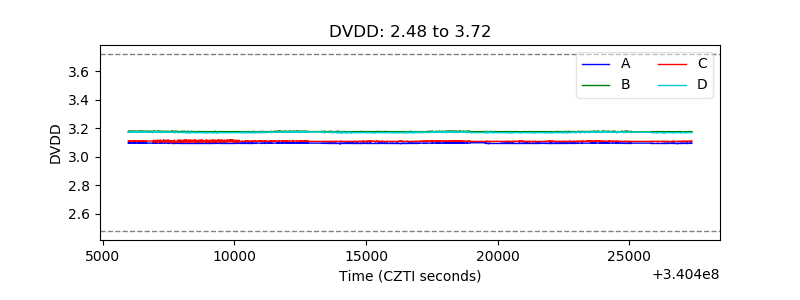 |
| Temperature 1 | 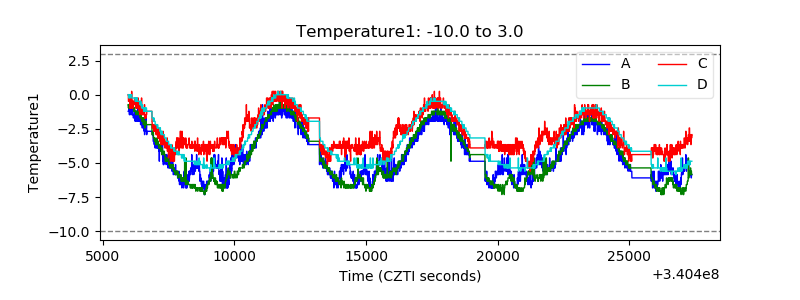 |
| Veto HV Monitor | 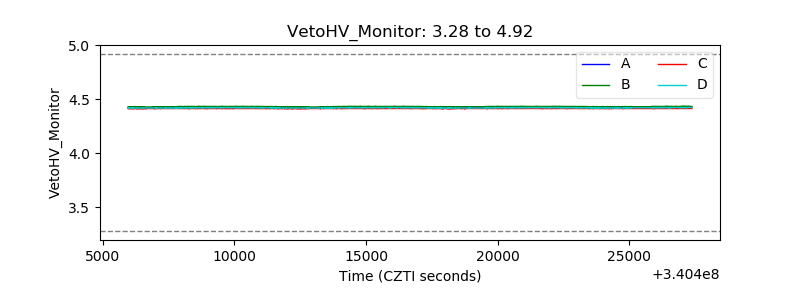 |
| Veto LLD | 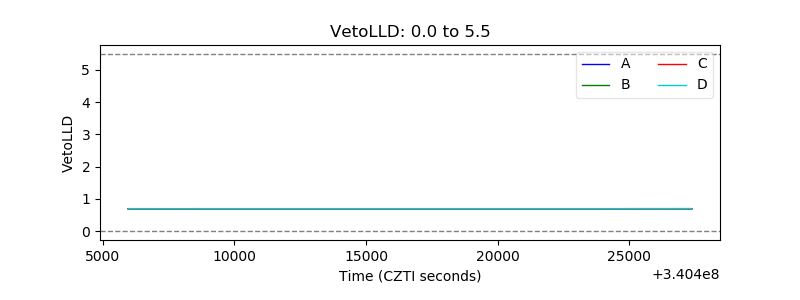 |
| Alpha Counter | 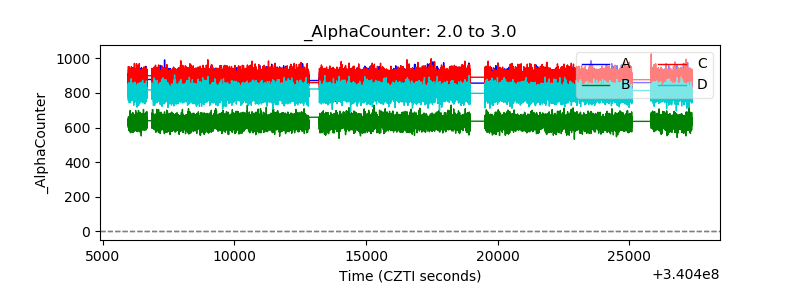 |
| _CPM_Rate | 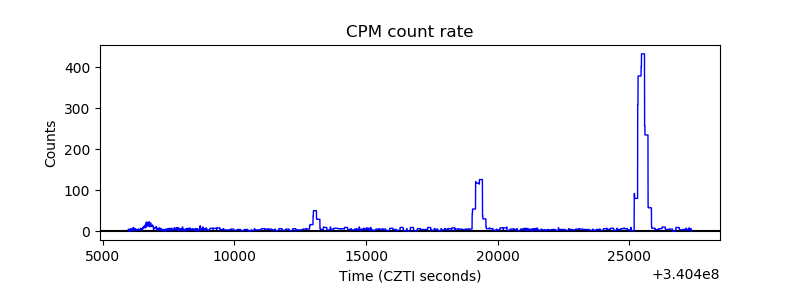 |
| CZT Counter | 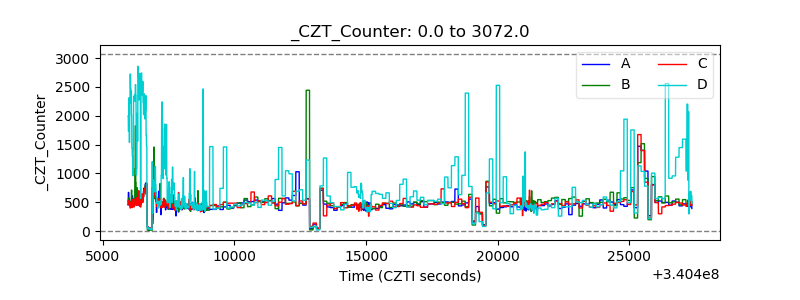 |
| +2.5 Volts monitor |  |
| +5 Volts monitor |  |
| _ROLL_ROT | 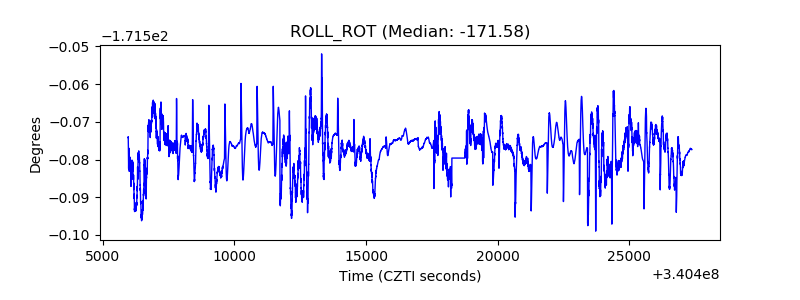 |
| _Roll_DEC | 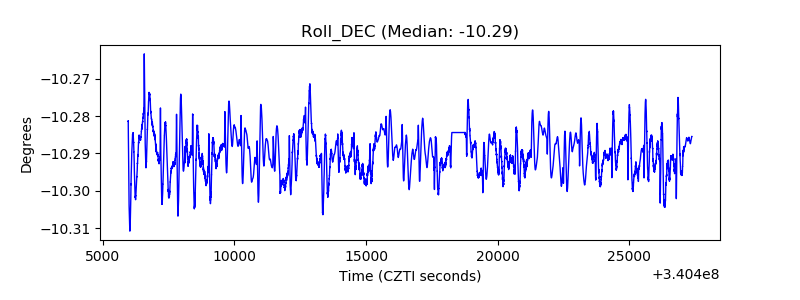 |
| _Roll_RA | 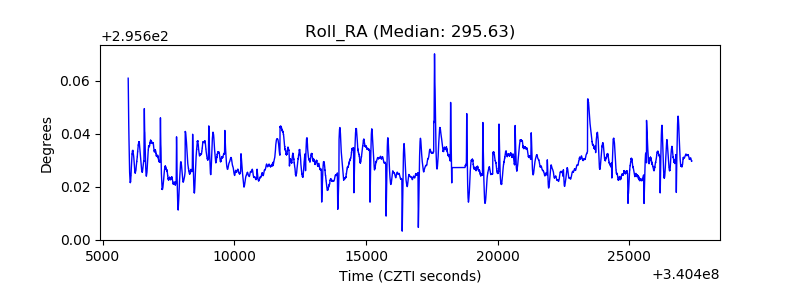 |
| Veto Counter | 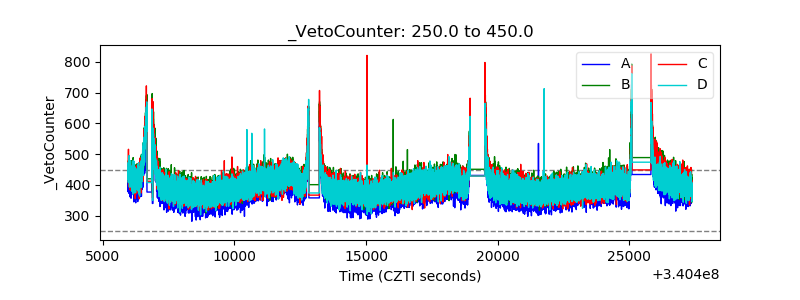 |