| Param | Original file | Final file |
|---|---|---|
| Filename | modeM0/AS1T03_243T01_9000003918_27294cztM0_level2.evt | modeM0/AS1T03_243T01_9000003918_27294cztM0_level2_quad_clean.evt |
| Size (bytes) | 595,788,480 | 67,970,880 |
| Size | 568.2 MB | 64.8 MB |
| Events in quadrant A | 3,317,266 | 409,836 |
| Events in quadrant B | 3,774,695 | 414,286 |
| Events in quadrant C | 3,346,388 | 395,961 |
| Events in quadrant D | 7,138,475 | 357,423 |
| Mode M9 | |||
|---|---|---|---|
| Quadrant | BADHDUFLAG | Total packets | Discarded packets |
| A | 0 | 9 | 0 |
| B | 0 | 10 | 0 |
| C | 0 | 10 | 0 |
| D | 0 | 10 | 0 |
| Mode M0 | |||
|---|---|---|---|
| Quadrant | BADHDUFLAG | Total packets | Discarded packets |
| A | 0 | 14086 | 0 |
| B | 0 | 15035 | 0 |
| C | 0 | 14146 | 0 |
| D | 0 | 25812 | 0 |
| Quadrant | Total seconds | Saturated seconds | Saturation percentage |
|---|---|---|---|
| A | 6889 | 53 | 0.769342% |
| B | 6889 | 81 | 1.175787% |
| C | 6889 | 87 | 1.262883% |
| D | 6889 | 928 | 13.470750% |
Noise dominated data is calculated using 1-second bins in cleaned event files. If a bin has >2000 counts, and if more than 50% of those come from <1% of pixels, then it is considered to be noise-dominated and hence unusable.
| Quadrant | # 1 sec bins | Bins with >0 counts | Bins with >2000 counts | High rate bins dominated by noise | Noise dominated (total time) | Noise dominated (detector-on time) | Marked lightcurve |
|---|---|---|---|---|---|---|---|
| A | 7774 | 6889 | 0 | 0 | 0.00% | 0.00% |  |
| B | 7774 | 6889 | 3 | 3 | 0.04% | 0.04% |  |
| C | 7774 | 6889 | 0 | 0 | 0.00% | 0.00% |  |
| D | 7774 | 6889 | 762 | 762 | 9.80% | 11.06% |  |
Top three noisy pixels from each quadrant. If the there are fewer than three noisy pixels in the level2.evt file, extra rows are filled as -1
| Pixel properties | Quadrant properties | ||||||
|---|---|---|---|---|---|---|---|
| Quadrant | DetID | PixID | Counts | Sigma | Mean | Median | Sigma |
| A | 13 | 254 | 10531 | 55.91 | 859 | 842 | 173.3 |
| A | 3 | 137 | 8244 | 42.71 | 859 | 842 | 173.3 |
| A | 0 | 226 | 7076 | 35.97 | 859 | 842 | 173.3 |
| B | 7 | 205 | 371182 | 2249.42 | 856 | 833 | 164.6 |
| B | 10 | 245 | 28202 | 166.23 | 856 | 833 | 164.6 |
| B | 12 | 111 | 20474 | 119.3 | 856 | 833 | 164.6 |
| C | 14 | 238 | 132073 | 676.29 | 822 | 826 | 194.1 |
| C | 15 | 208 | 13265 | 64.1 | 822 | 826 | 194.1 |
| C | 13 | 61 | 5540 | 24.29 | 822 | 826 | 194.1 |
| D | 1 | 52 | 3806837 | 20135.72 | 794 | 775 | 189.0 |
| D | 12 | 227 | 154995 | 815.89 | 794 | 775 | 189.0 |
| D | 2 | 250 | 69384 | 362.97 | 794 | 775 | 189.0 |
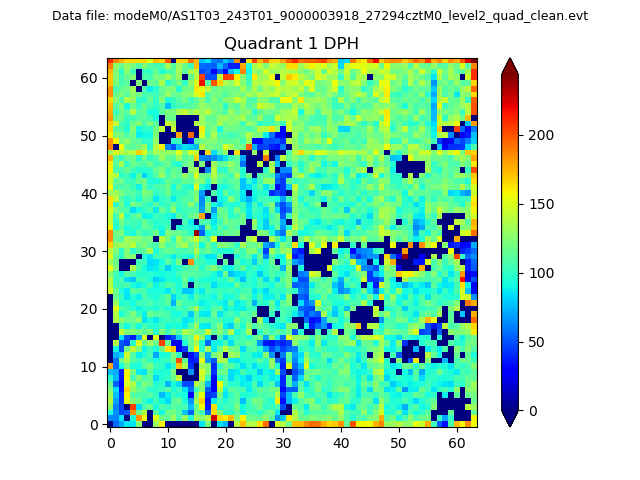
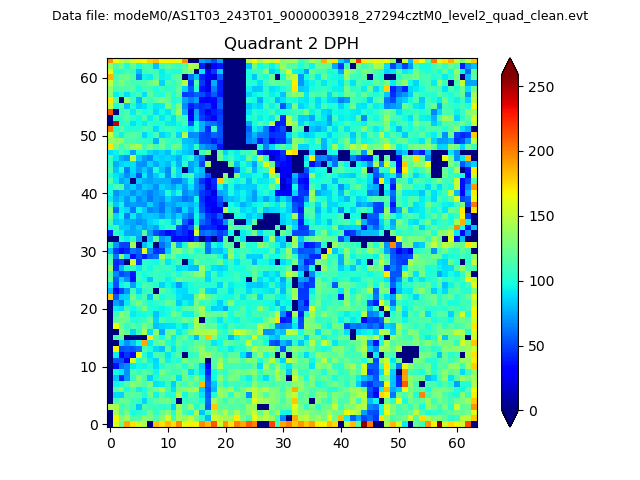
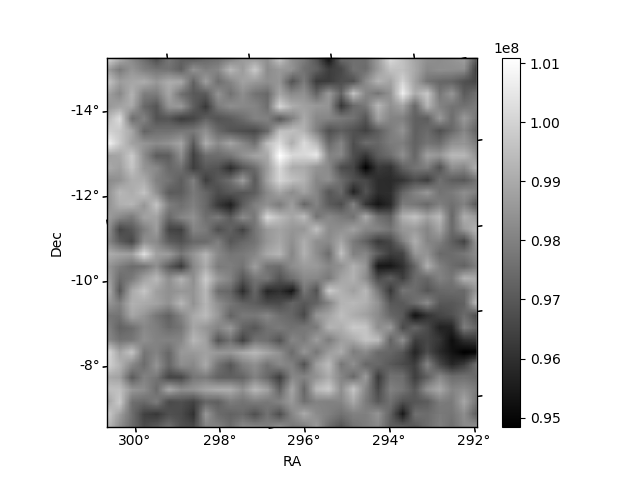
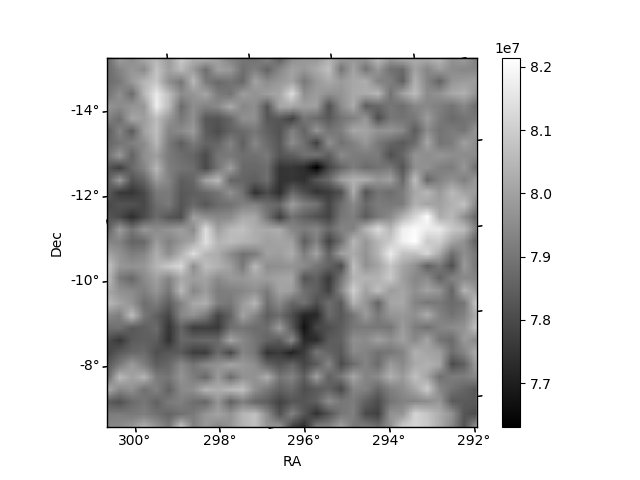
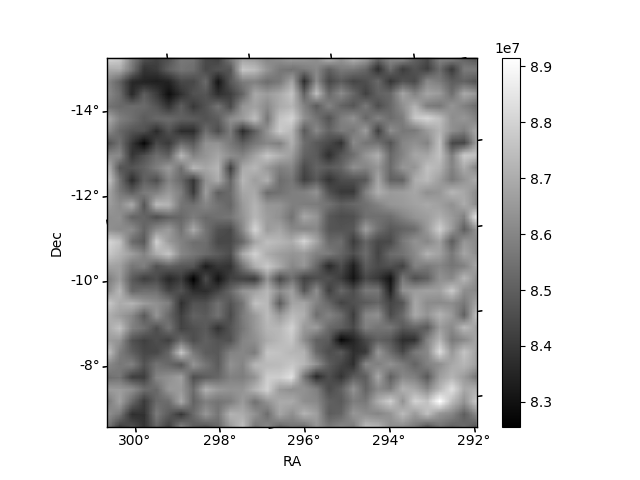
Histogram calculated using DETX and DETY for each event in the final _common_clean file
| Quadrant A |  |
 |
Quadrant B |
|---|---|---|---|
| Quadrant D | 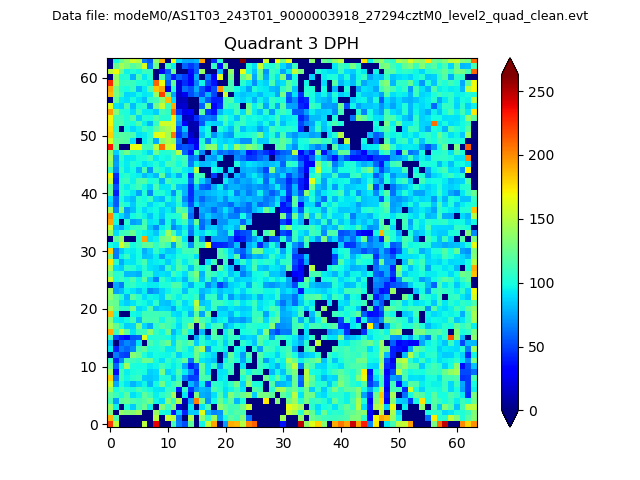 |
 |
Quadrant C |
| Plot type | Count rate plots | Images |
|---|---|---|
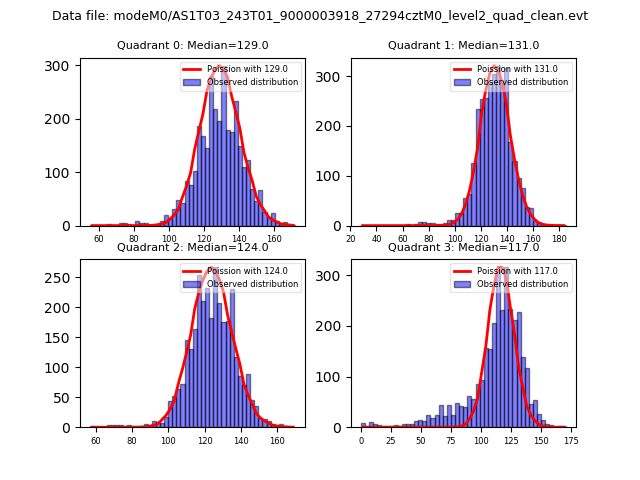
| Comparison with Poisson distribution Blue bars denote a histogram of data divided into 1 sec bins. Red curve is a Poisson curve with rate = median count rate of data. |
 |
 |
| Quadrant-wise count rates Data is divided into 100 sec bins |
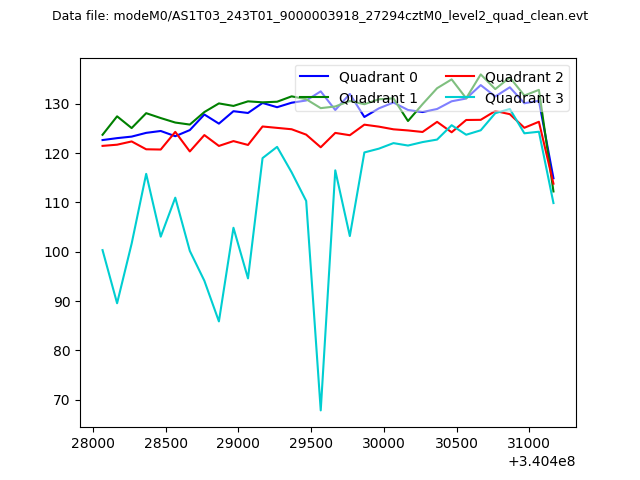 |
|
| Module-wise count rates for Quadrant A Data is divided into 100 sec bins |
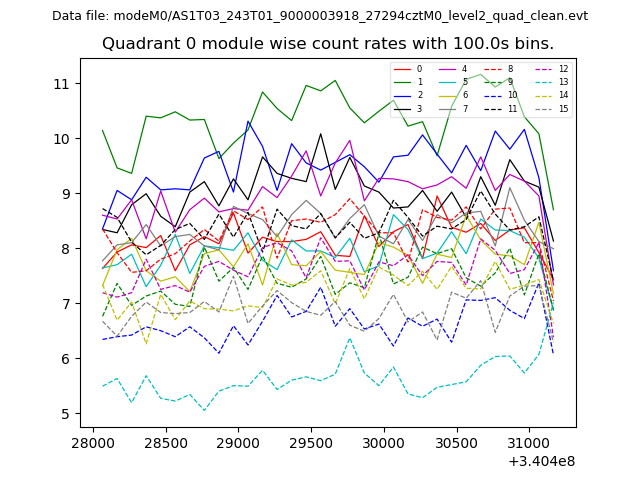 |
 |
| Module-wise count rates for Quadrant B Data is divided into 100 sec bins |
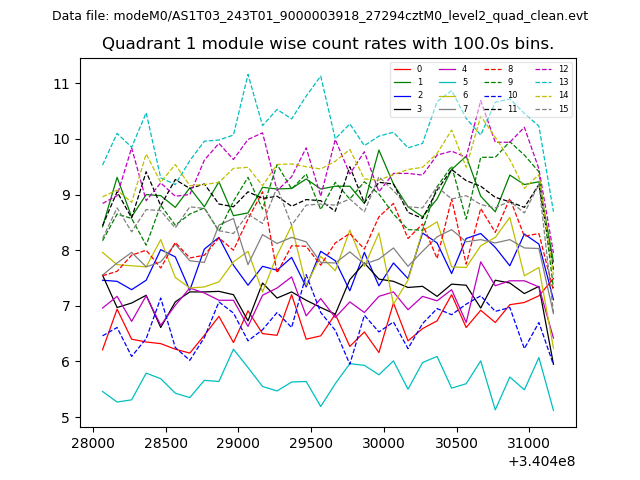 |
 |
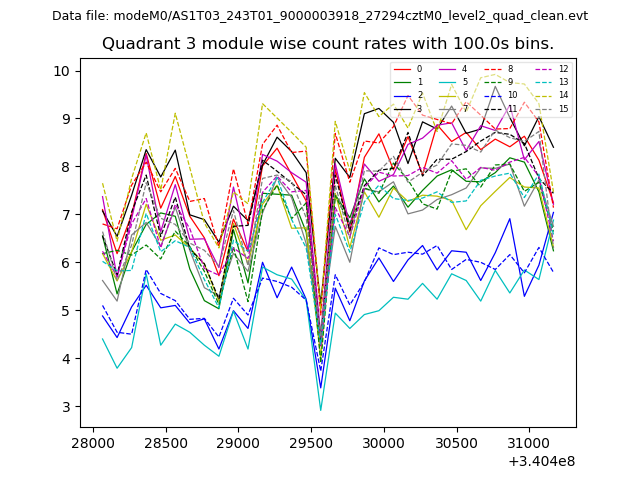
| Module-wise count rates for Quadrant C Data is divided into 100 sec bins |
 |
 |
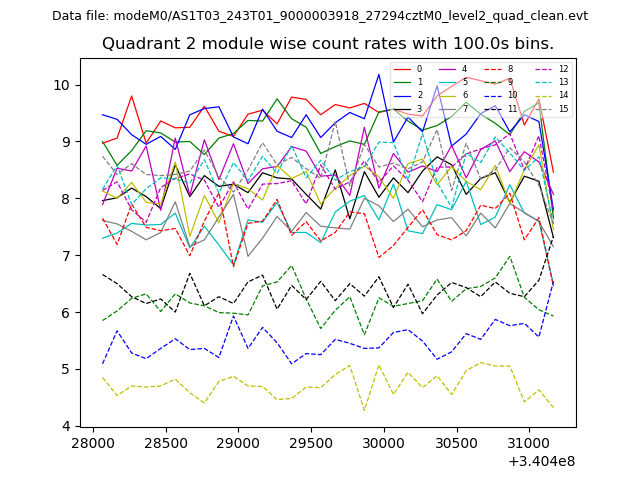
| Module-wise count rates for Quadrant D Data is divided into 100 sec bins |
 |
 |
| Parameter | Plot |
|---|---|
| CZT HV Monitor | 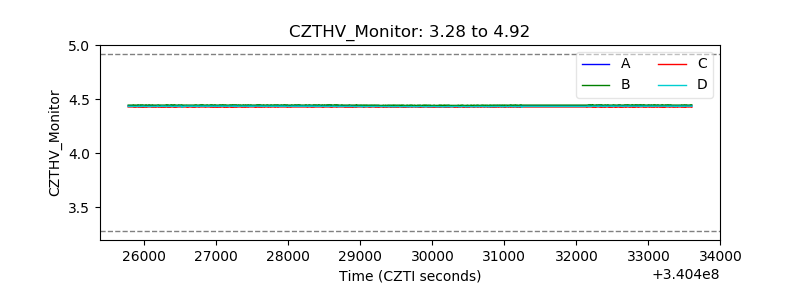 |
| D_VDD | 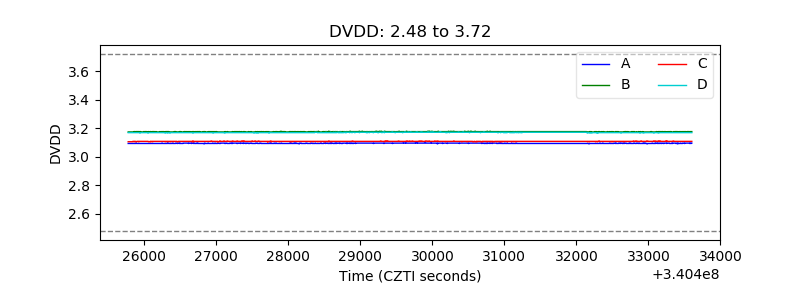 |
| Temperature 1 | 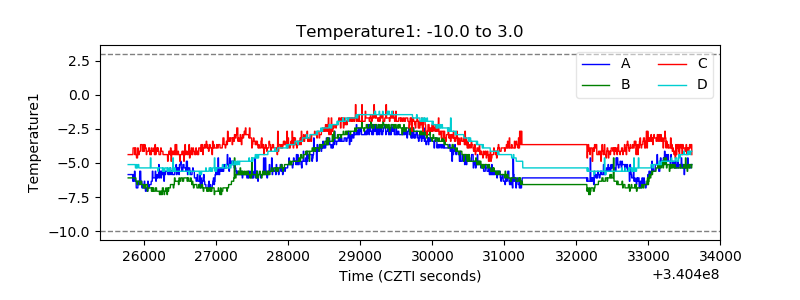 |
| Veto HV Monitor | 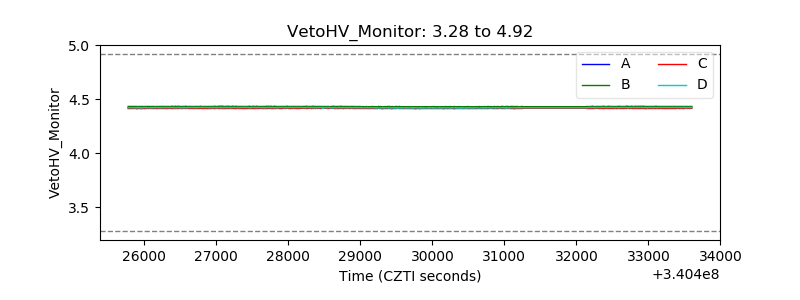 |
| Veto LLD | 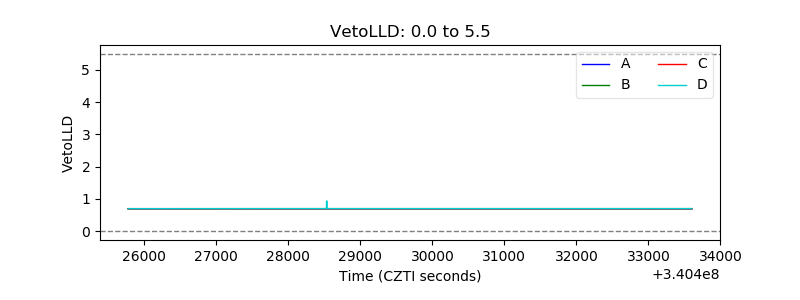 |
| Alpha Counter | 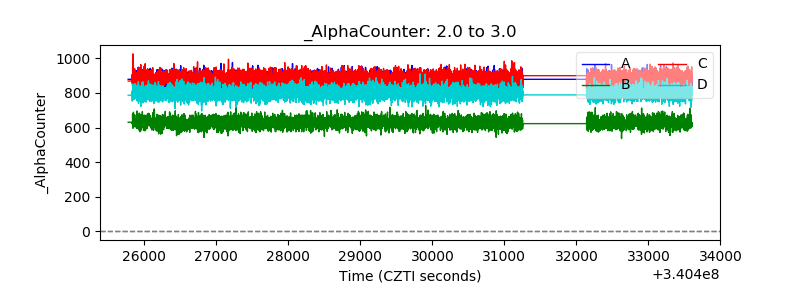 |
| _CPM_Rate | 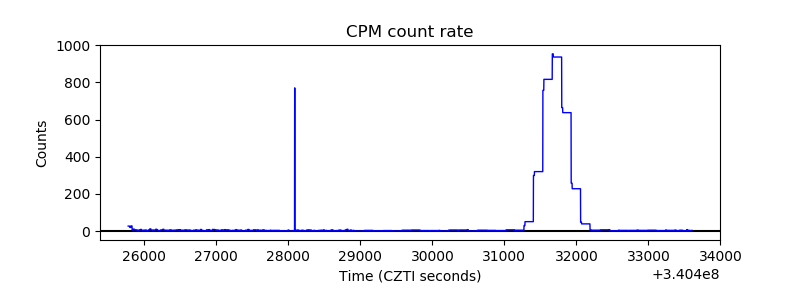 |
| CZT Counter |  |
| +2.5 Volts monitor |  |
| +5 Volts monitor |  |
| _ROLL_ROT | 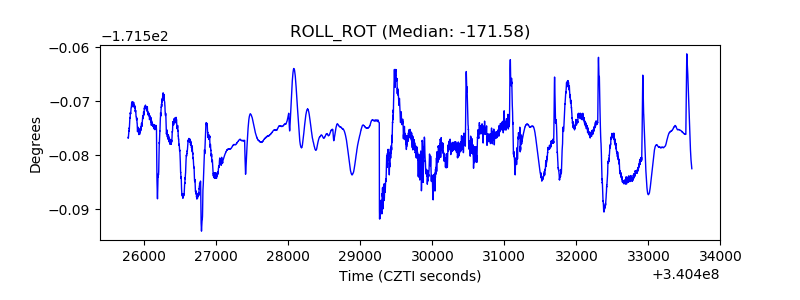 |
| _Roll_DEC | 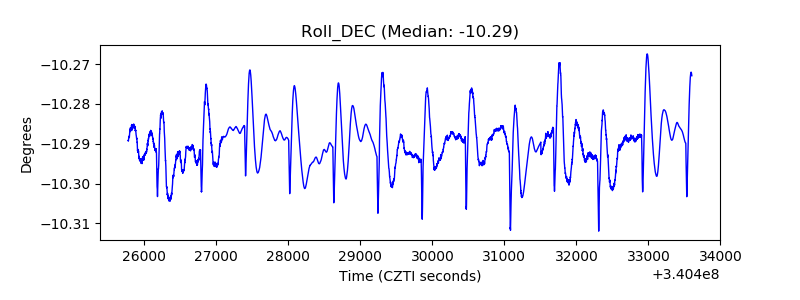 |
| _Roll_RA |  |
| Veto Counter | 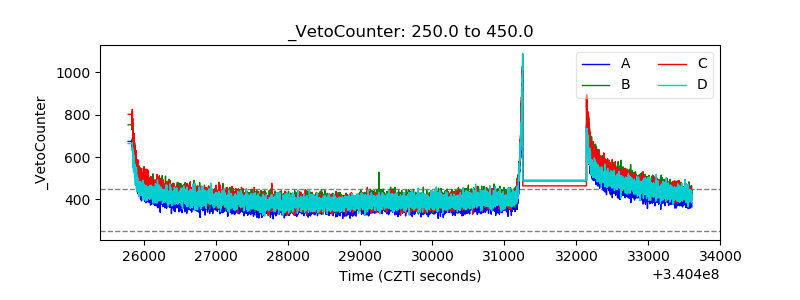 |