| Param | Original file | Final file |
|---|---|---|
| Filename | modeM0/AS1T03_243T01_9000003918_27295cztM0_level2.evt | modeM0/AS1T03_243T01_9000003918_27295cztM0_level2_quad_clean.evt |
| Size (bytes) | 496,281,600 | 75,297,600 |
| Size | 473.3 MB | 71.8 MB |
| Events in quadrant A | 3,329,827 | 464,115 |
| Events in quadrant B | 3,696,489 | 470,145 |
| Events in quadrant C | 3,331,759 | 447,174 |
| Events in quadrant D | 4,221,455 | 435,675 |
| Mode M9 | |||
|---|---|---|---|
| Quadrant | BADHDUFLAG | Total packets | Discarded packets |
| A | 0 | 10 | 0 |
| B | 0 | 10 | 0 |
| C | 0 | 10 | 0 |
| D | 0 | 10 | 0 |
| Mode M0 | |||
|---|---|---|---|
| Quadrant | BADHDUFLAG | Total packets | Discarded packets |
| A | 0 | 13924 | 0 |
| B | 0 | 14821 | 0 |
| C | 0 | 13979 | 0 |
| D | 0 | 16873 | 0 |
| Quadrant | Total seconds | Saturated seconds | Saturation percentage |
|---|---|---|---|
| A | 6633 | 55 | 0.829187% |
| B | 6634 | 84 | 1.266204% |
| C | 6634 | 110 | 1.658125% |
| D | 6634 | 164 | 2.472113% |
Noise dominated data is calculated using 1-second bins in cleaned event files. If a bin has >2000 counts, and if more than 50% of those come from <1% of pixels, then it is considered to be noise-dominated and hence unusable.
| Quadrant | # 1 sec bins | Bins with >0 counts | Bins with >2000 counts | High rate bins dominated by noise | Noise dominated (total time) | Noise dominated (detector-on time) | Marked lightcurve |
|---|---|---|---|---|---|---|---|
| A | 7673 | 6633 | 0 | 0 | 0.00% | 0.00% | 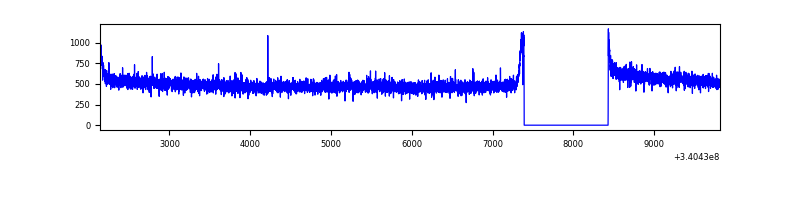 |
| B | 7674 | 6634 | 3 | 3 | 0.04% | 0.05% | 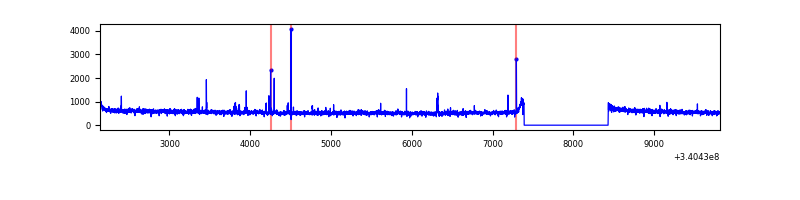 |
| C | 7674 | 6634 | 0 | 0 | 0.00% | 0.00% | 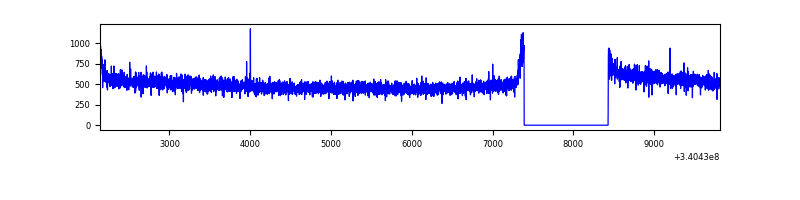 |
| D | 7674 | 6634 | 99 | 99 | 1.29% | 1.49% | 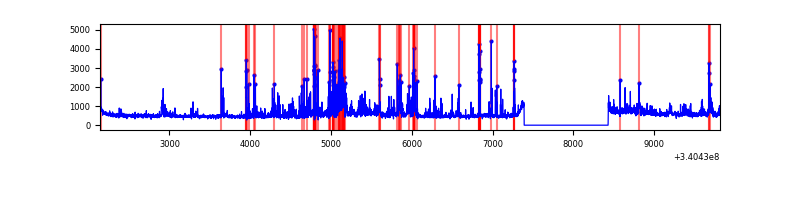 |
Top three noisy pixels from each quadrant. If the there are fewer than three noisy pixels in the level2.evt file, extra rows are filled as -1
| Pixel properties | Quadrant properties | ||||||
|---|---|---|---|---|---|---|---|
| Quadrant | DetID | PixID | Counts | Sigma | Mean | Median | Sigma |
| A | 13 | 254 | 10050 | 53.33 | 862 | 845 | 172.6 |
| A | 3 | 137 | 7922 | 41.0 | 862 | 845 | 172.6 |
| A | 0 | 226 | 7298 | 37.38 | 862 | 845 | 172.6 |
| B | 7 | 205 | 278168 | 1708.47 | 857 | 837 | 162.3 |
| B | 0 | 190 | 22397 | 132.82 | 857 | 837 | 162.3 |
| B | 12 | 111 | 19943 | 117.7 | 857 | 837 | 162.3 |
| C | 14 | 238 | 134366 | 700.19 | 819 | 826 | 190.7 |
| C | 13 | 61 | 5671 | 25.4 | 819 | 826 | 190.7 |
| C | 15 | 208 | 4265 | 18.03 | 819 | 826 | 190.7 |
| D | 1 | 52 | 929884 | 4772.55 | 821 | 803 | 194.7 |
| D | 12 | 233 | 73510 | 373.48 | 821 | 803 | 194.7 |
| D | 2 | 250 | 43421 | 218.92 | 821 | 803 | 194.7 |
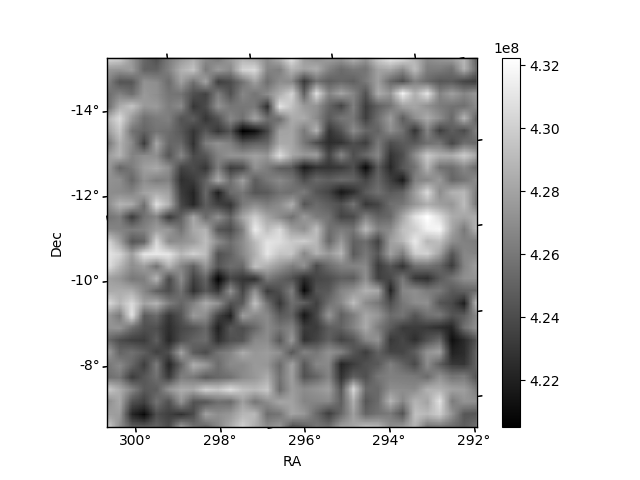
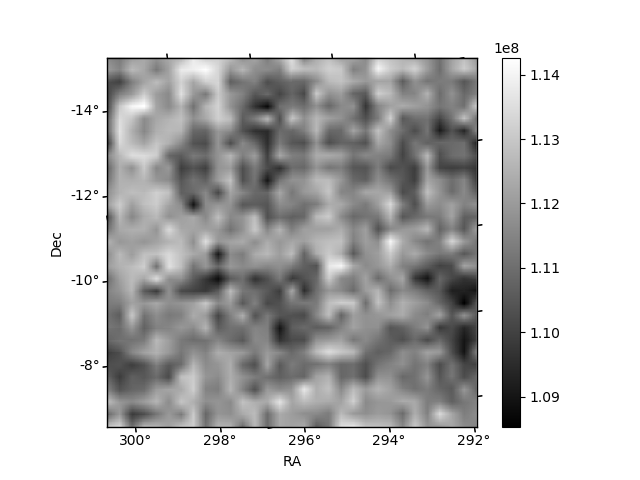
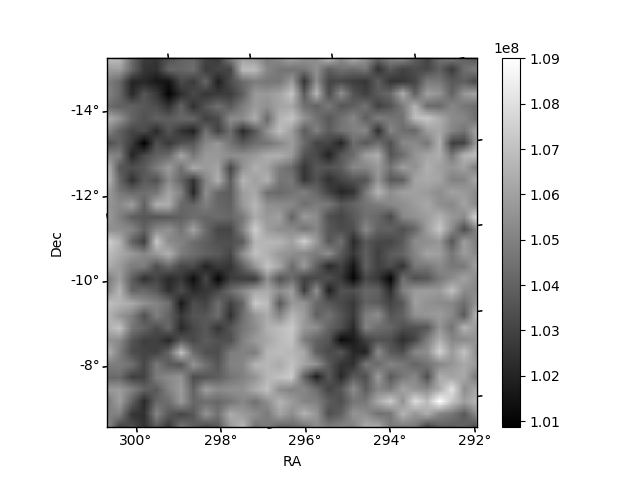
Histogram calculated using DETX and DETY for each event in the final _common_clean file
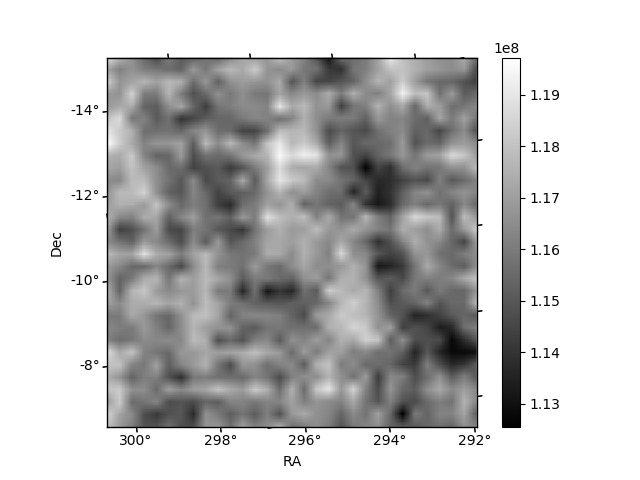
| Quadrant A | 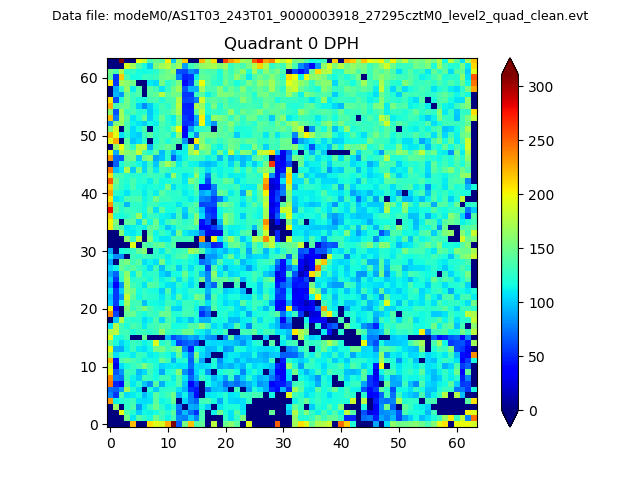 |
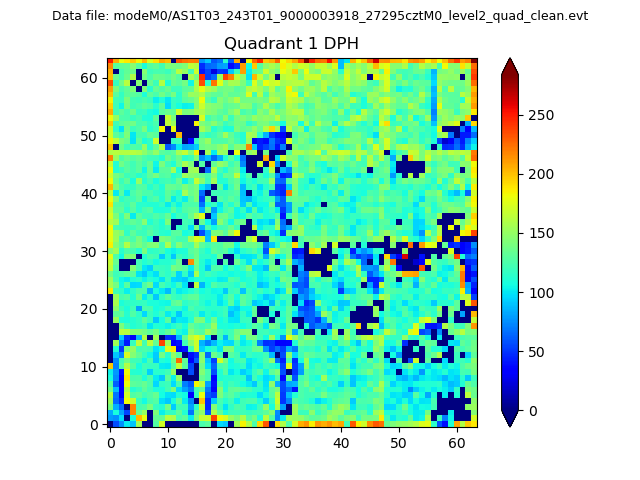 |
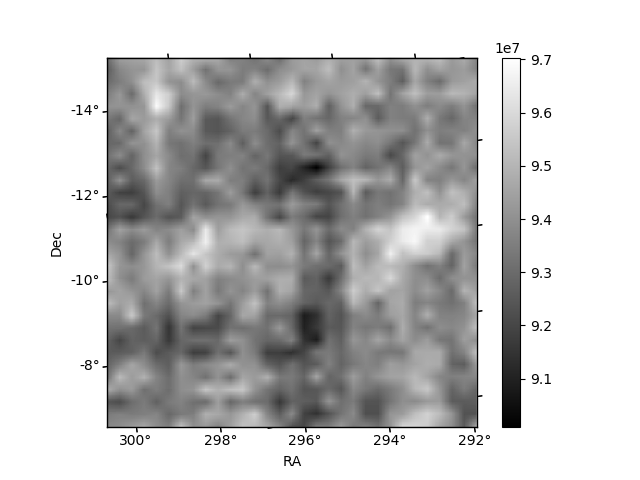
Quadrant B |
|---|---|---|---|
| Quadrant D |  |
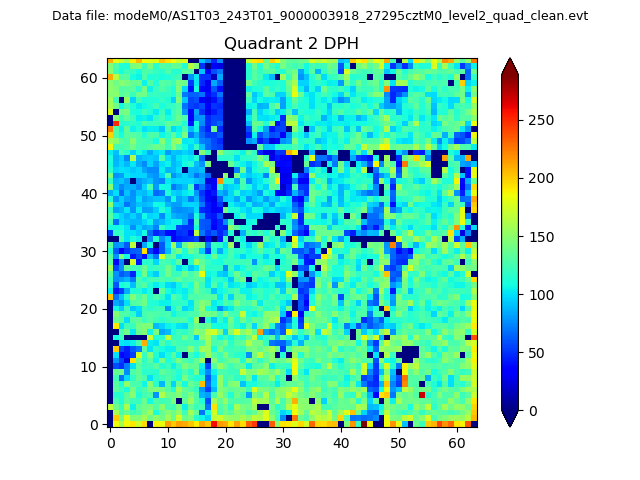 |
Quadrant C |
| Plot type | Count rate plots | Images |
|---|---|---|
| Comparison with Poisson distribution Blue bars denote a histogram of data divided into 1 sec bins. Red curve is a Poisson curve with rate = median count rate of data. |
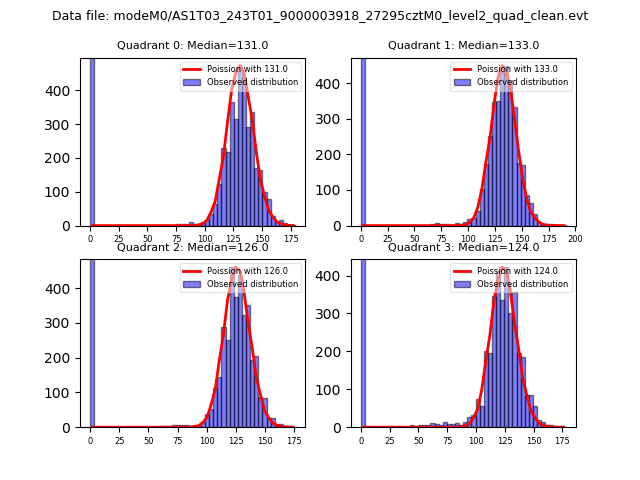 |
 |
| Quadrant-wise count rates Data is divided into 100 sec bins |
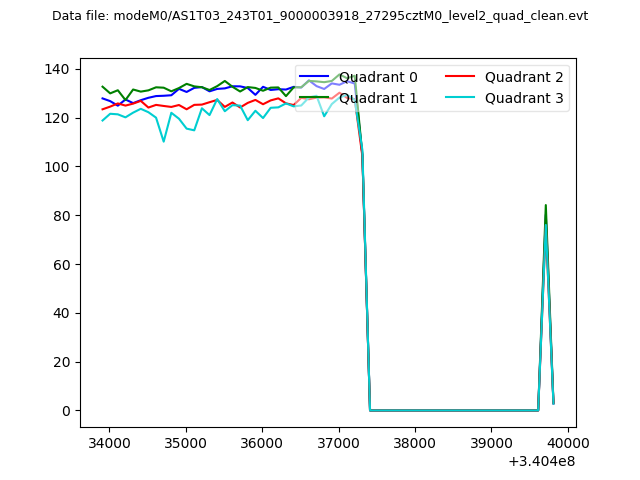 |
|
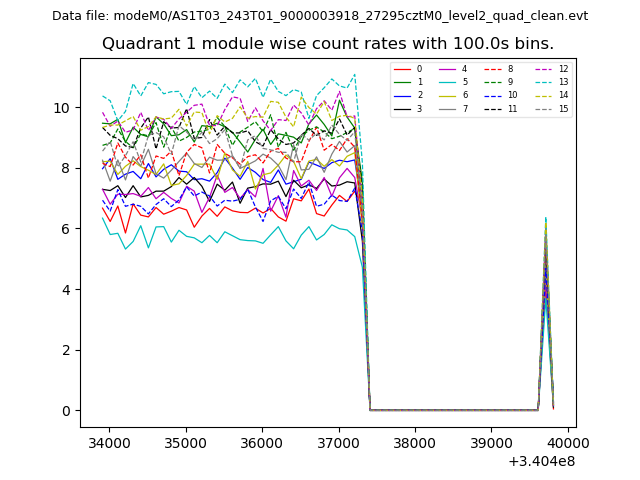
| Module-wise count rates for Quadrant A Data is divided into 100 sec bins |
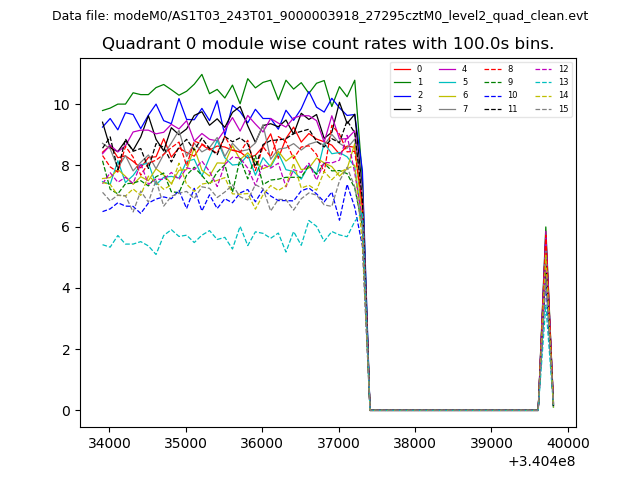 |
 |
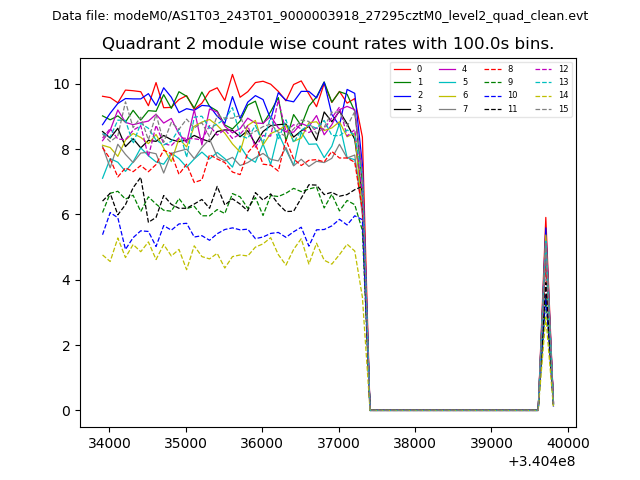
| Module-wise count rates for Quadrant B Data is divided into 100 sec bins |
 |
 |
| Module-wise count rates for Quadrant C Data is divided into 100 sec bins |
 |
 |
| Module-wise count rates for Quadrant D Data is divided into 100 sec bins |
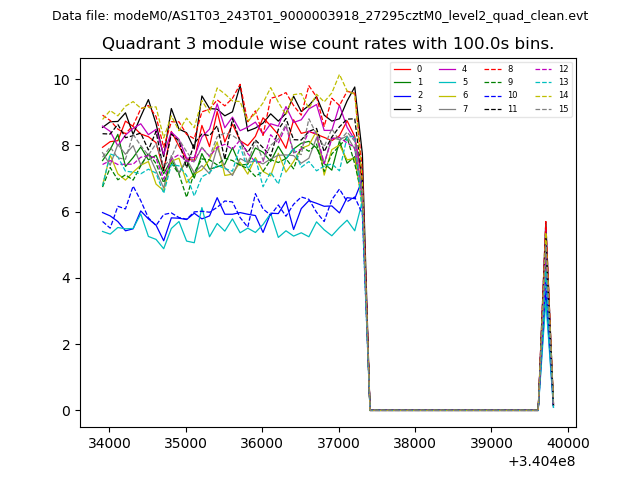 |
 |
| Parameter | Plot |
|---|---|
| CZT HV Monitor | 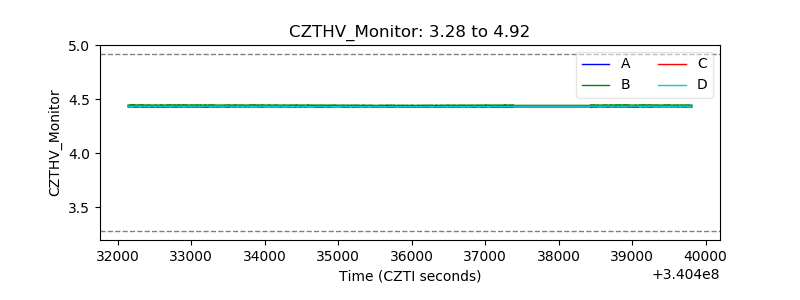 |
| D_VDD | 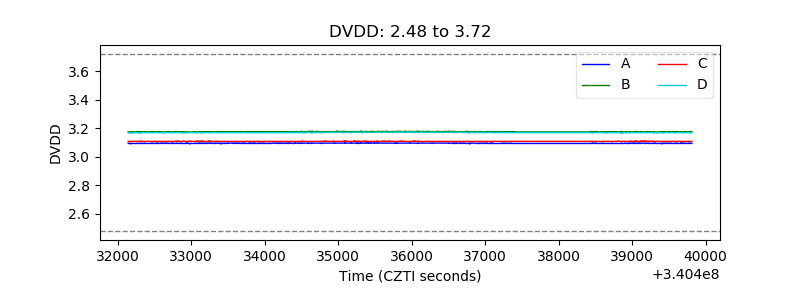 |
| Temperature 1 | 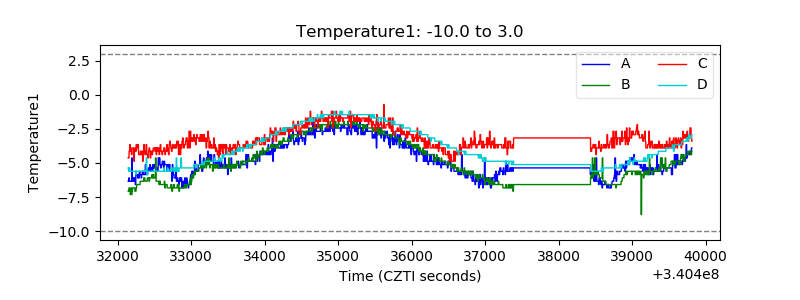 |
| Veto HV Monitor | 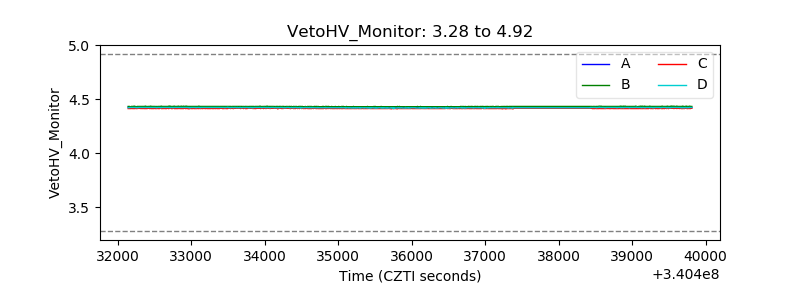 |
| Veto LLD | 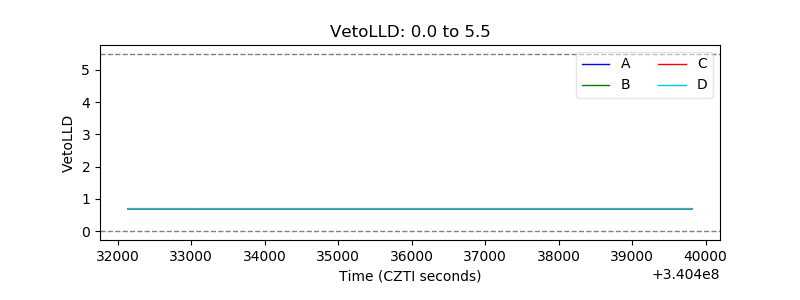 |
| Alpha Counter | 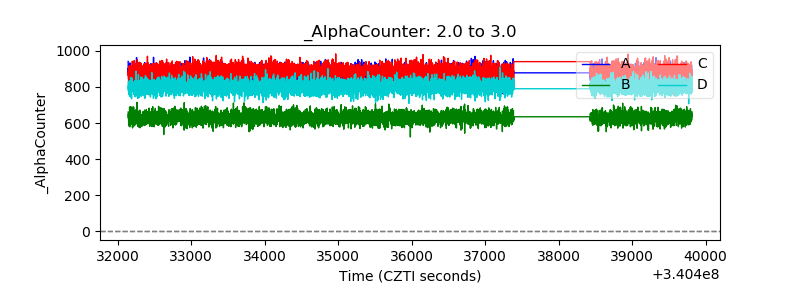 |
| _CPM_Rate | 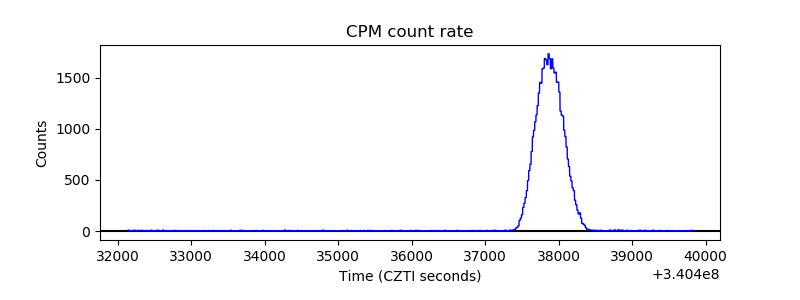 |
| CZT Counter | 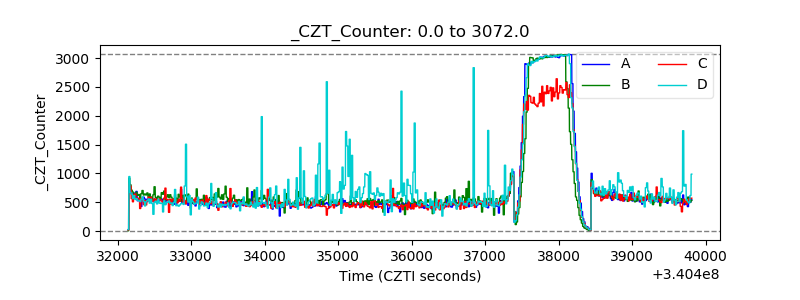 |
| +2.5 Volts monitor |  |
| +5 Volts monitor |  |
| _ROLL_ROT | 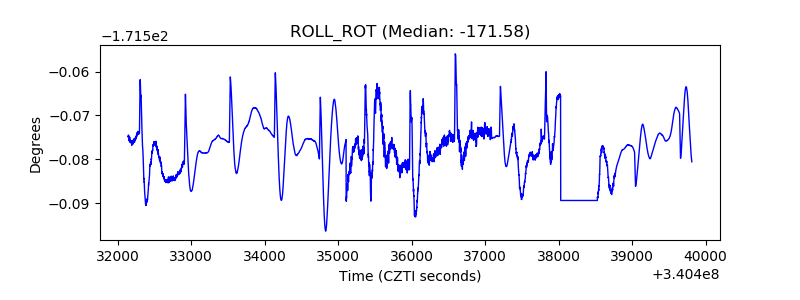 |
| _Roll_DEC | 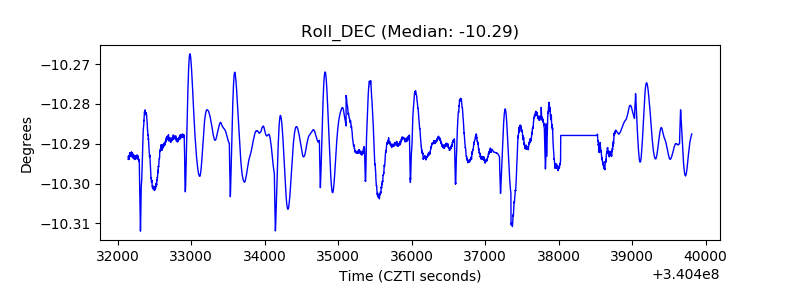 |
| _Roll_RA | 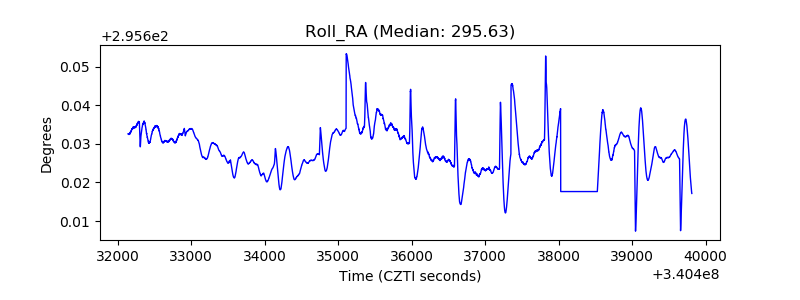 |
| Veto Counter | 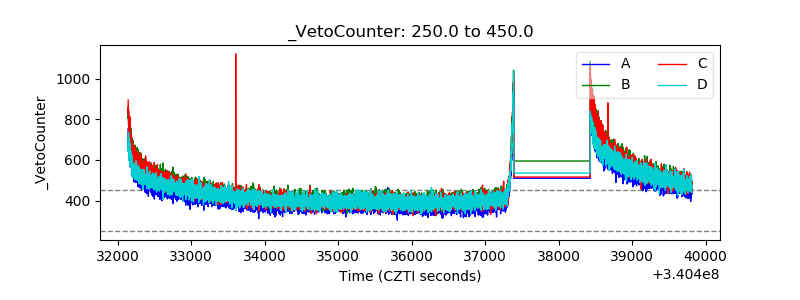 |