| Param | Original file | Final file |
|---|---|---|
| Filename | modeM0/AS1T03_243T01_9000003918_27297cztM0_level2.evt | modeM0/AS1T03_243T01_9000003918_27297cztM0_level2_quad_clean.evt |
| Size (bytes) | 526,383,360 | 86,460,480 |
| Size | 502.0 MB | 82.5 MB |
| Events in quadrant A | 3,341,177 | 566,217 |
| Events in quadrant B | 3,386,029 | 576,834 |
| Events in quadrant C | 3,333,306 | 541,770 |
| Events in quadrant D | 5,451,795 | 491,562 |
| Mode M9 | |||
|---|---|---|---|
| Quadrant | BADHDUFLAG | Total packets | Discarded packets |
| A | 0 | 12 | 0 |
| B | 0 | 12 | 0 |
| C | 0 | 12 | 0 |
| D | 0 | 12 | 0 |
| Mode M0 | |||
|---|---|---|---|
| Quadrant | BADHDUFLAG | Total packets | Discarded packets |
| A | 0 | 13920 | 0 |
| B | 0 | 14073 | 0 |
| C | 0 | 13955 | 0 |
| D | 0 | 20558 | 0 |
| Quadrant | Total seconds | Saturated seconds | Saturation percentage |
|---|---|---|---|
| A | 6330 | 58 | 0.916272% |
| B | 6330 | 65 | 1.026856% |
| C | 6331 | 103 | 1.626915% |
| D | 6331 | 610 | 9.635129% |
Noise dominated data is calculated using 1-second bins in cleaned event files. If a bin has >2000 counts, and if more than 50% of those come from <1% of pixels, then it is considered to be noise-dominated and hence unusable.
| Quadrant | # 1 sec bins | Bins with >0 counts | Bins with >2000 counts | High rate bins dominated by noise | Noise dominated (total time) | Noise dominated (detector-on time) | Marked lightcurve |
|---|---|---|---|---|---|---|---|
| A | 7505 | 6330 | 0 | 0 | 0.00% | 0.00% | 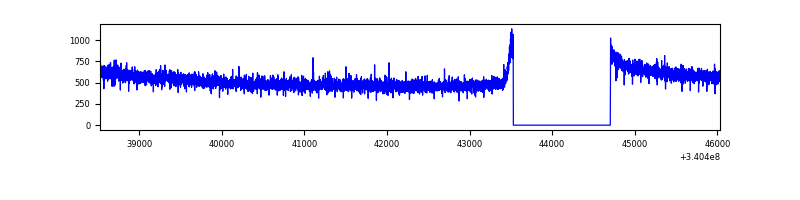 |
| B | 7505 | 6331 | 3 | 3 | 0.04% | 0.05% | 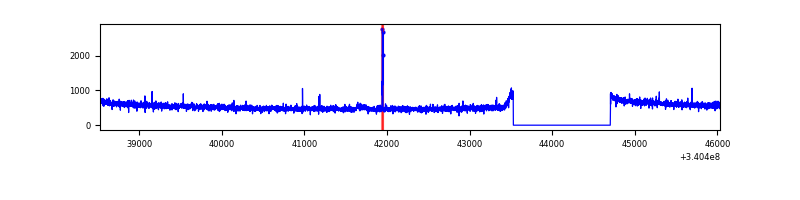 |
| C | 7506 | 6332 | 1 | 1 | 0.01% | 0.02% | 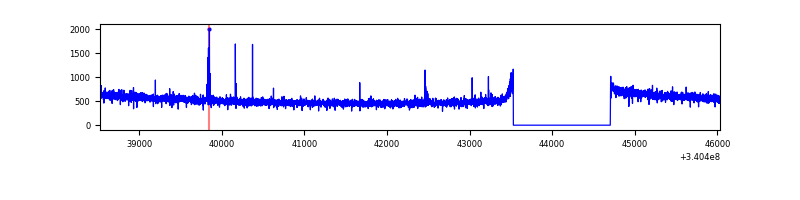 |
| D | 7506 | 6332 | 553 | 553 | 7.37% | 8.73% | 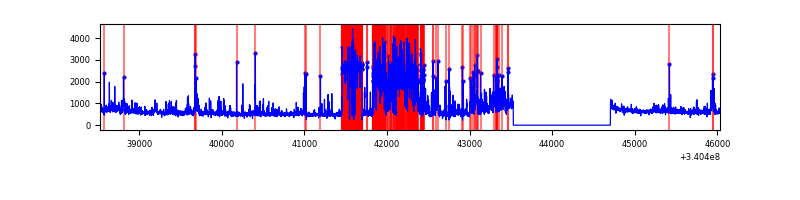 |
Top three noisy pixels from each quadrant. If the there are fewer than three noisy pixels in the level2.evt file, extra rows are filled as -1
| Pixel properties | Quadrant properties | ||||||
|---|---|---|---|---|---|---|---|
| Quadrant | DetID | PixID | Counts | Sigma | Mean | Median | Sigma |
| A | 13 | 254 | 9487 | 50.04 | 867 | 852 | 172.6 |
| A | 3 | 137 | 7568 | 38.92 | 867 | 852 | 172.6 |
| A | 0 | 226 | 7440 | 38.18 | 867 | 852 | 172.6 |
| B | 12 | 111 | 19384 | 115.87 | 857 | 837 | 160.1 |
| B | 11 | 111 | 17361 | 103.23 | 857 | 837 | 160.1 |
| B | 14 | 111 | 16196 | 95.95 | 857 | 837 | 160.1 |
| C | 14 | 238 | 132614 | 698.21 | 816 | 826 | 188.8 |
| C | 15 | 208 | 22044 | 112.41 | 816 | 826 | 188.8 |
| C | 13 | 61 | 5515 | 24.84 | 816 | 826 | 188.8 |
| D | 1 | 52 | 2324797 | 12434.97 | 794 | 780 | 186.9 |
| D | 12 | 233 | 46898 | 246.76 | 794 | 780 | 186.9 |
| D | 2 | 250 | 26275 | 136.41 | 794 | 780 | 186.9 |
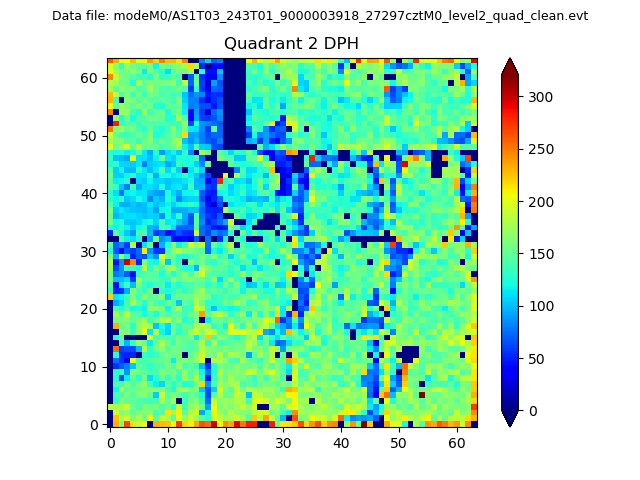
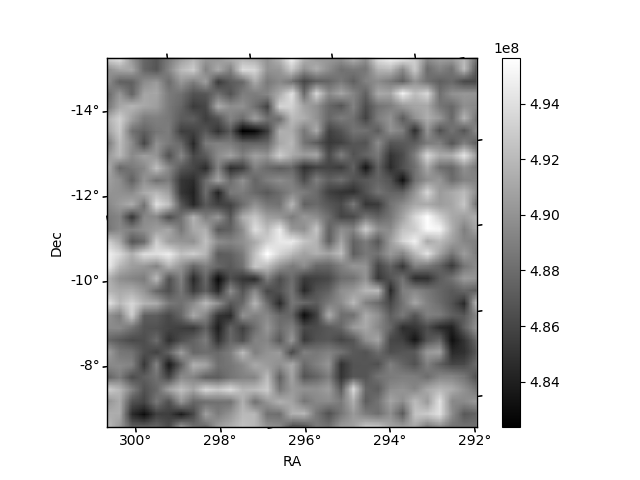
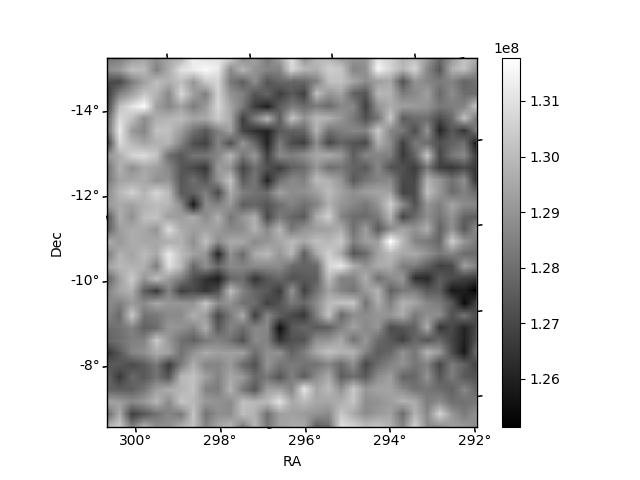
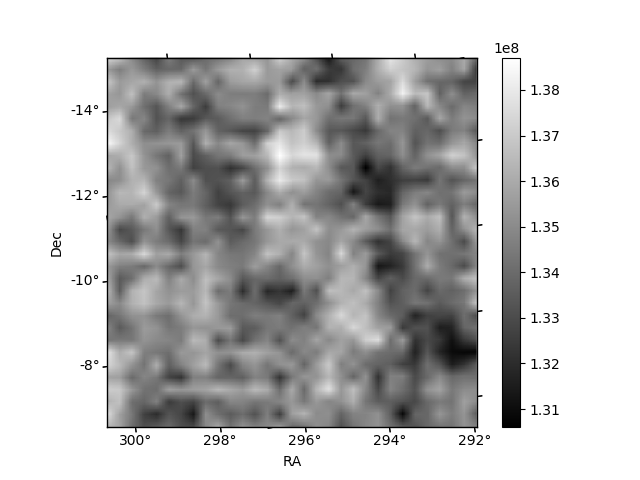
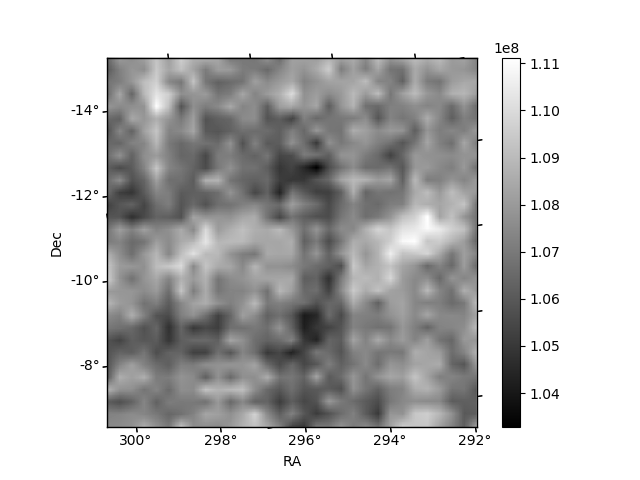
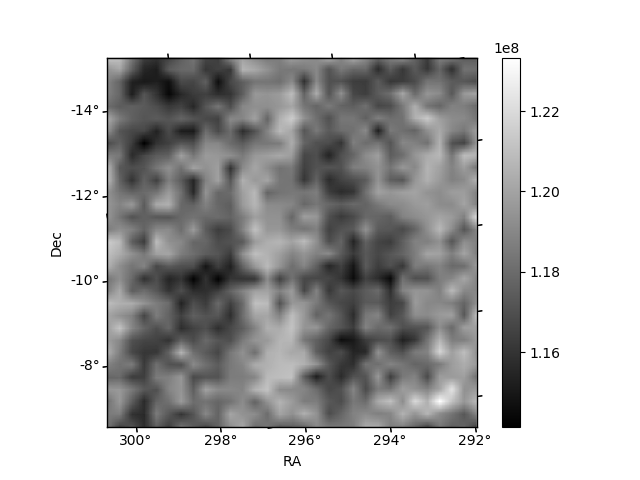
Histogram calculated using DETX and DETY for each event in the final _common_clean file
| Quadrant A | 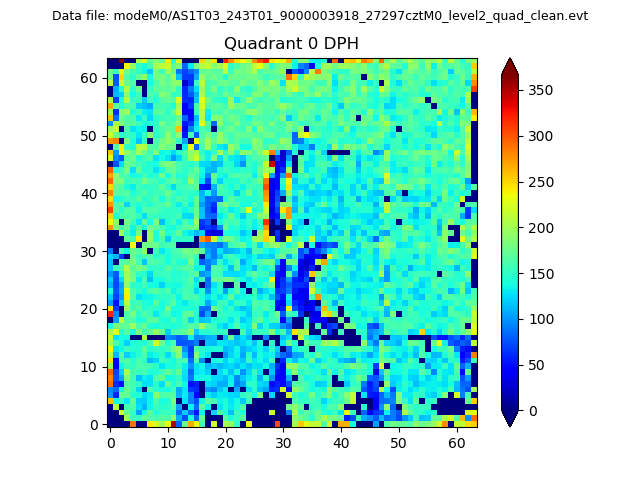 |
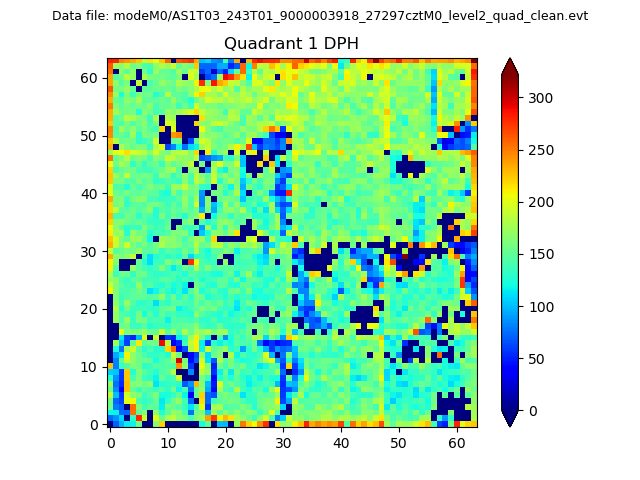 |
Quadrant B |
|---|---|---|---|
| Quadrant D | 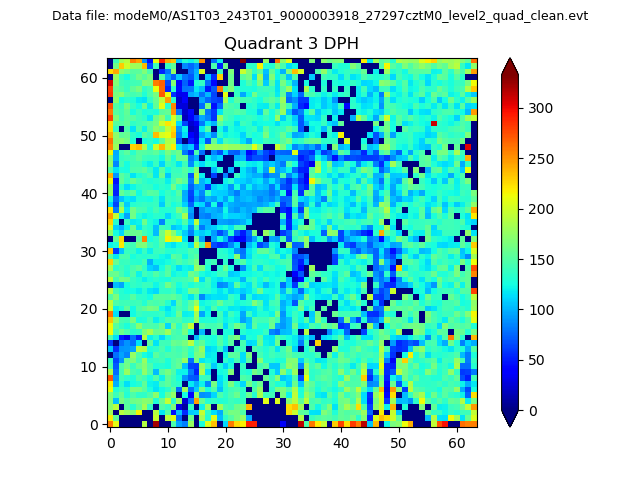 |
 |
Quadrant C |
| Plot type | Count rate plots | Images |
|---|---|---|
| Comparison with Poisson distribution Blue bars denote a histogram of data divided into 1 sec bins. Red curve is a Poisson curve with rate = median count rate of data. |
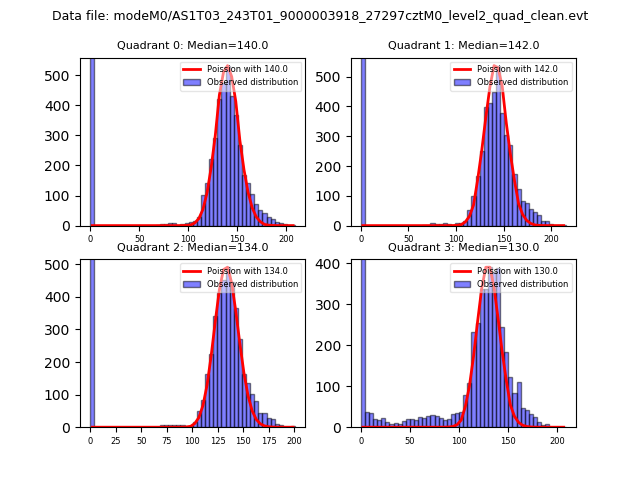 |
 |
| Quadrant-wise count rates Data is divided into 100 sec bins |
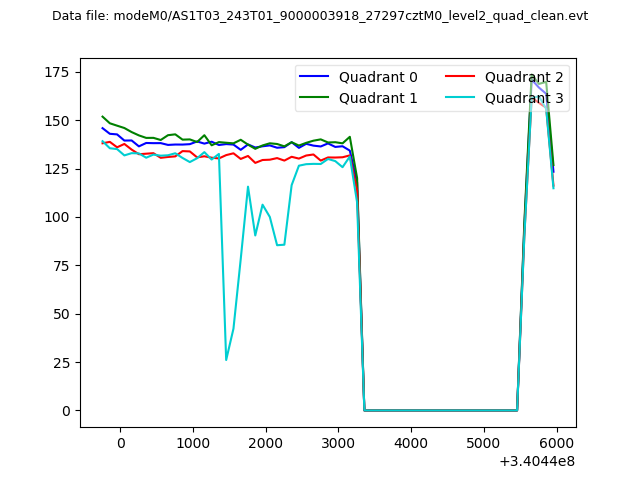 |
|
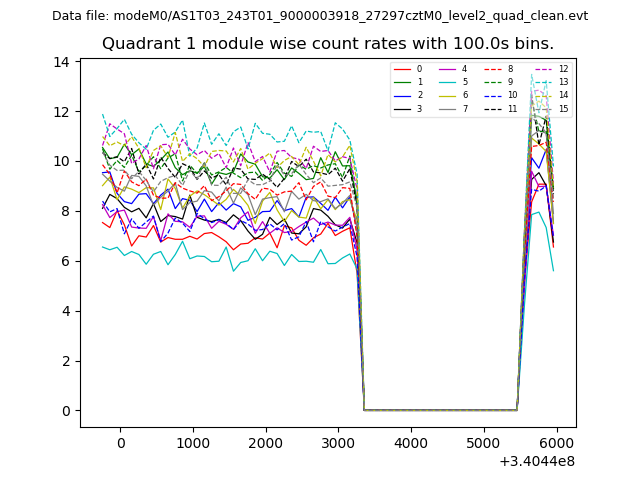
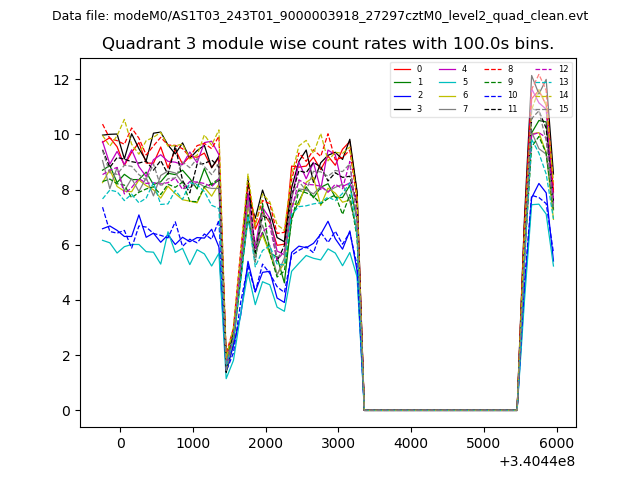
| Module-wise count rates for Quadrant A Data is divided into 100 sec bins |
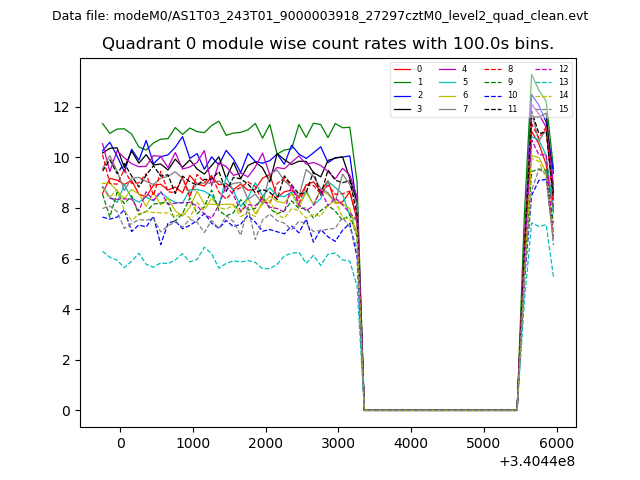 |
 |
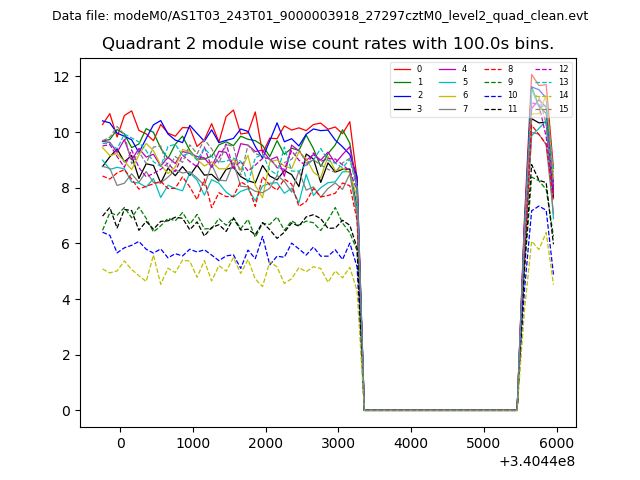
| Module-wise count rates for Quadrant B Data is divided into 100 sec bins |
 |
 |
| Module-wise count rates for Quadrant C Data is divided into 100 sec bins |
 |
 |
| Module-wise count rates for Quadrant D Data is divided into 100 sec bins |
 |
 |
| Parameter | Plot |
|---|---|
| CZT HV Monitor | 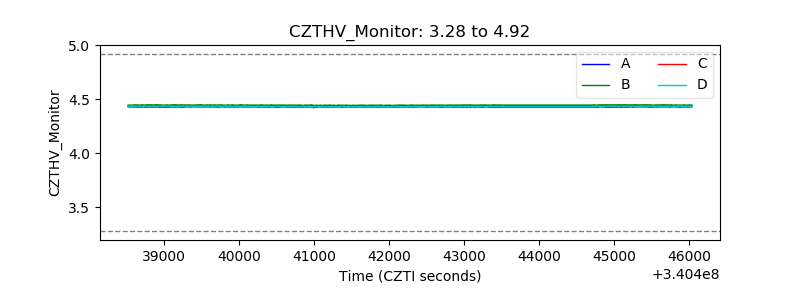 |
| D_VDD | 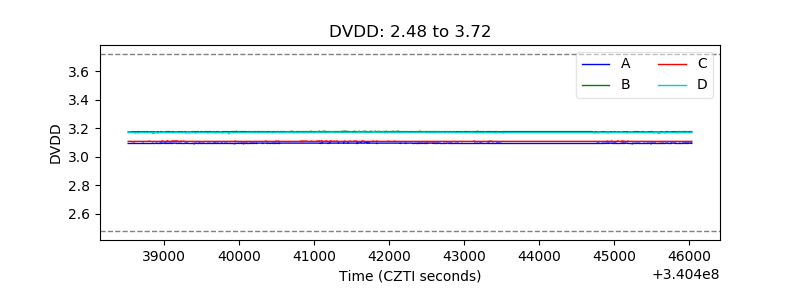 |
| Temperature 1 | 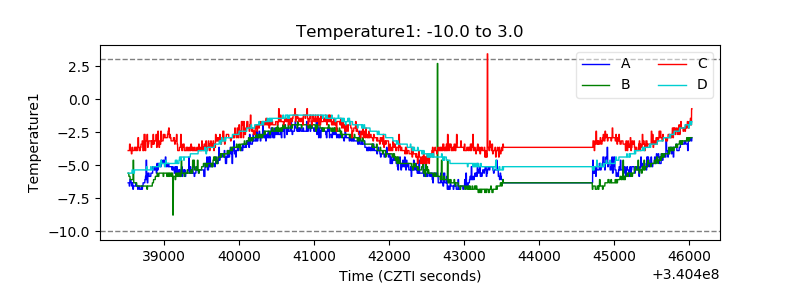 |
| Veto HV Monitor | 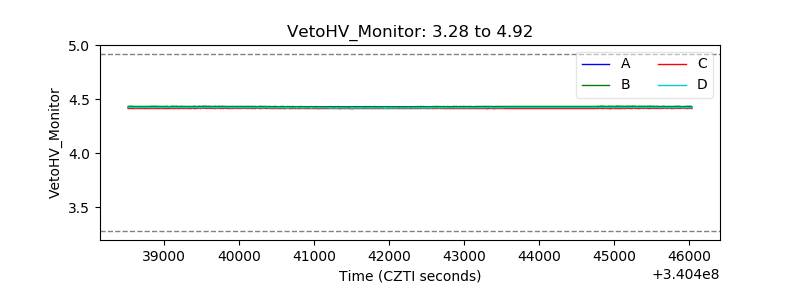 |
| Veto LLD | 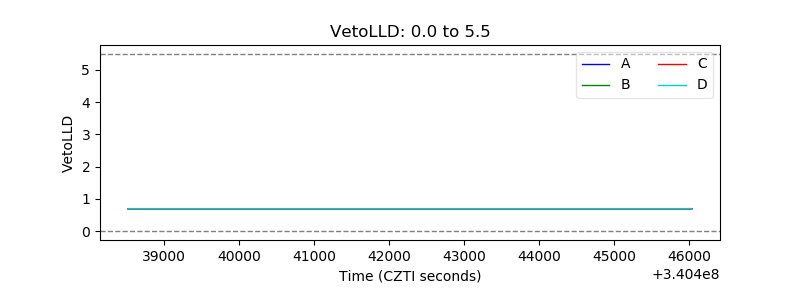 |
| Alpha Counter | 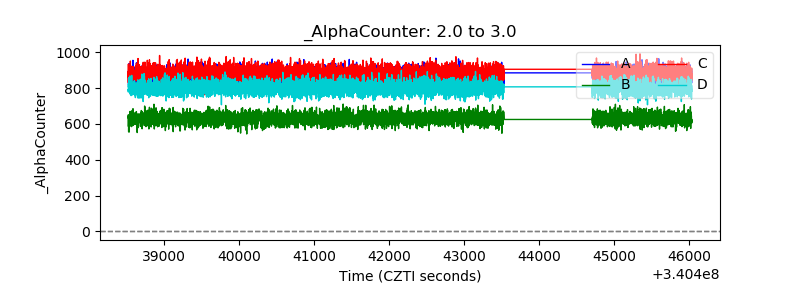 |
| _CPM_Rate | 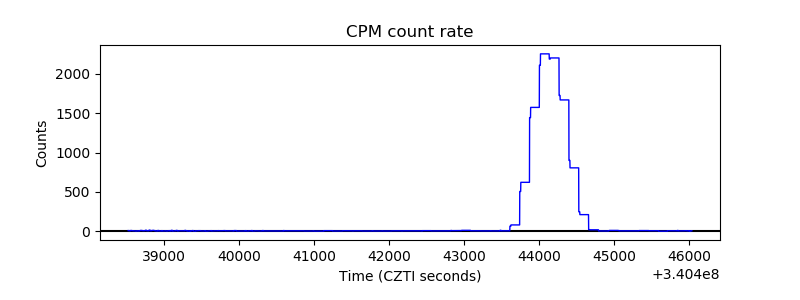 |
| CZT Counter | 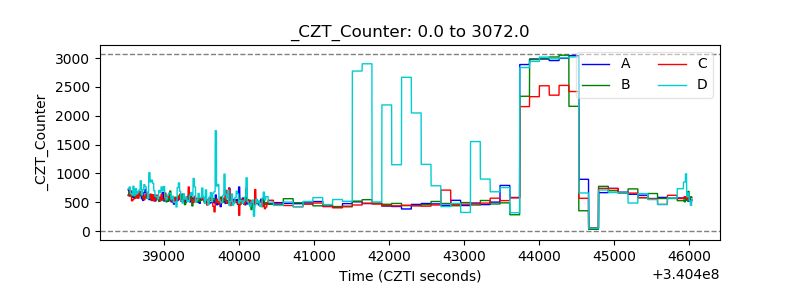 |
| +2.5 Volts monitor |  |
| +5 Volts monitor |  |
| _ROLL_ROT | 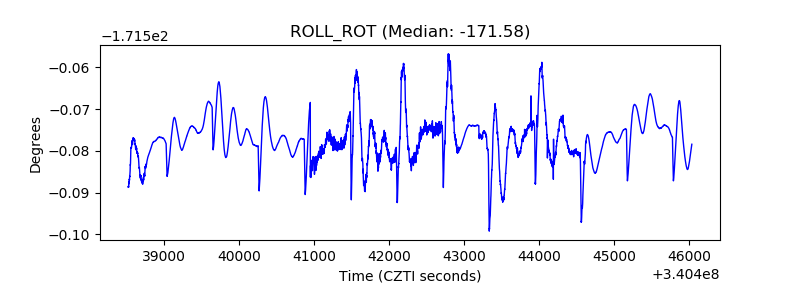 |
| _Roll_DEC |  |
| _Roll_RA | 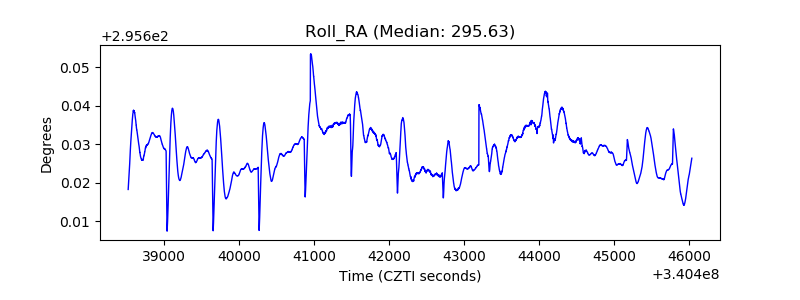 |
| Veto Counter | 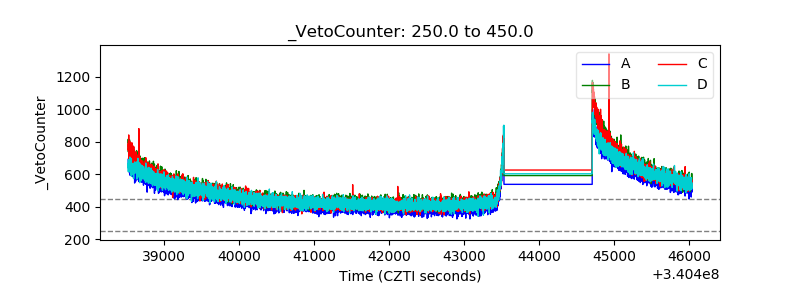 |