| Param | Original file | Final file |
|---|---|---|
| Filename | modeM0/AS1T03_243T01_9000003918_27300cztM0_level2.evt | modeM0/AS1T03_243T01_9000003918_27300cztM0_level2_quad_clean.evt |
| Size (bytes) | 495,483,840 | 107,565,120 |
| Size | 472.5 MB | 102.6 MB |
| Events in quadrant A | 3,190,549 | 744,454 |
| Events in quadrant B | 3,232,069 | 747,738 |
| Events in quadrant C | 3,063,144 | 692,128 |
| Events in quadrant D | 5,126,257 | 667,875 |
| Mode M9 | |||
|---|---|---|---|
| Quadrant | BADHDUFLAG | Total packets | Discarded packets |
| A | 0 | 13 | 0 |
| B | 0 | 13 | 0 |
| C | 0 | 13 | 0 |
| D | 0 | 13 | 0 |
| Mode M0 | |||
|---|---|---|---|
| Quadrant | BADHDUFLAG | Total packets | Discarded packets |
| A | 0 | 13116 | 0 |
| B | 0 | 13133 | 0 |
| C | 0 | 12605 | 0 |
| D | 0 | 19222 | 0 |
| Quadrant | Total seconds | Saturated seconds | Saturation percentage |
|---|---|---|---|
| A | 5803 | 132 | 2.274686% |
| B | 5803 | 170 | 2.929519% |
| C | 5803 | 143 | 2.464243% |
| D | 5803 | 412 | 7.099776% |
Noise dominated data is calculated using 1-second bins in cleaned event files. If a bin has >2000 counts, and if more than 50% of those come from <1% of pixels, then it is considered to be noise-dominated and hence unusable.
| Quadrant | # 1 sec bins | Bins with >0 counts | Bins with >2000 counts | High rate bins dominated by noise | Noise dominated (total time) | Noise dominated (detector-on time) | Marked lightcurve |
|---|---|---|---|---|---|---|---|
| A | 7113 | 5803 | 0 | 0 | 0.00% | 0.00% | 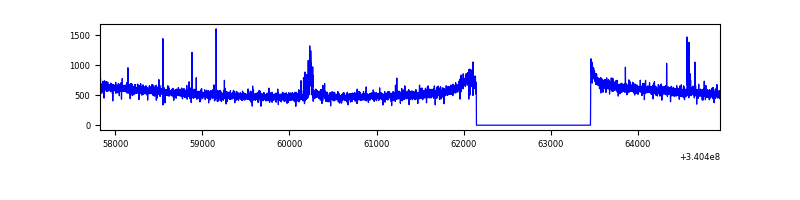 |
| B | 7113 | 5804 | 14 | 14 | 0.20% | 0.24% | 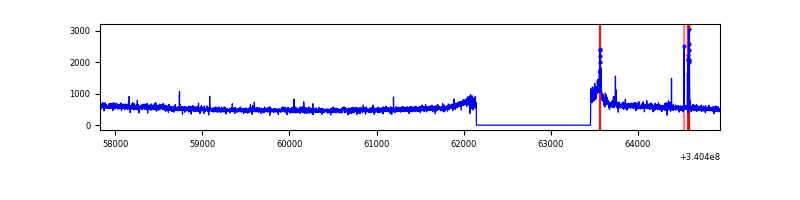 |
| C | 7113 | 5803 | 0 | 0 | 0.00% | 0.00% | 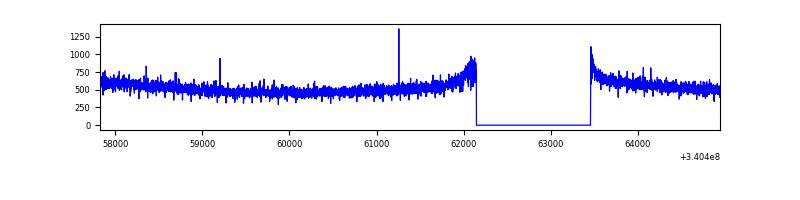 |
| D | 7113 | 5803 | 264 | 264 | 3.71% | 4.55% | 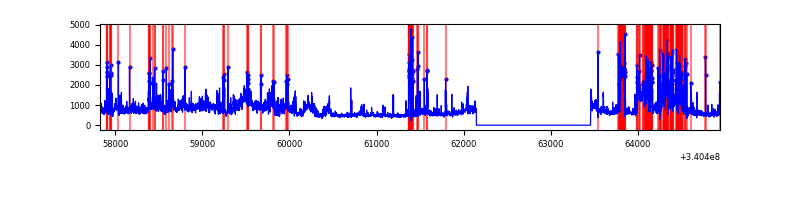 |
Top three noisy pixels from each quadrant. If the there are fewer than three noisy pixels in the level2.evt file, extra rows are filled as -1
| Pixel properties | Quadrant properties | ||||||
|---|---|---|---|---|---|---|---|
| Quadrant | DetID | PixID | Counts | Sigma | Mean | Median | Sigma |
| A | 15 | 174 | 30002 | 179.9 | 815 | 803 | 162.3 |
| A | 13 | 248 | 13711 | 79.53 | 815 | 803 | 162.3 |
| A | 13 | 254 | 9690 | 54.75 | 815 | 803 | 162.3 |
| B | 10 | 245 | 101728 | 677.19 | 796 | 779 | 149.1 |
| B | 12 | 111 | 17324 | 110.99 | 796 | 779 | 149.1 |
| B | 11 | 111 | 15442 | 98.36 | 796 | 779 | 149.1 |
| C | 14 | 238 | 124858 | 712.1 | 753 | 760 | 174.3 |
| C | 13 | 61 | 5223 | 25.61 | 753 | 760 | 174.3 |
| C | 15 | 208 | 2471 | 9.82 | 753 | 760 | 174.3 |
| D | 1 | 52 | 1688983 | 9038.21 | 756 | 741 | 186.8 |
| D | 12 | 233 | 308856 | 1649.53 | 756 | 741 | 186.8 |
| D | 12 | 227 | 117502 | 625.09 | 756 | 741 | 186.8 |
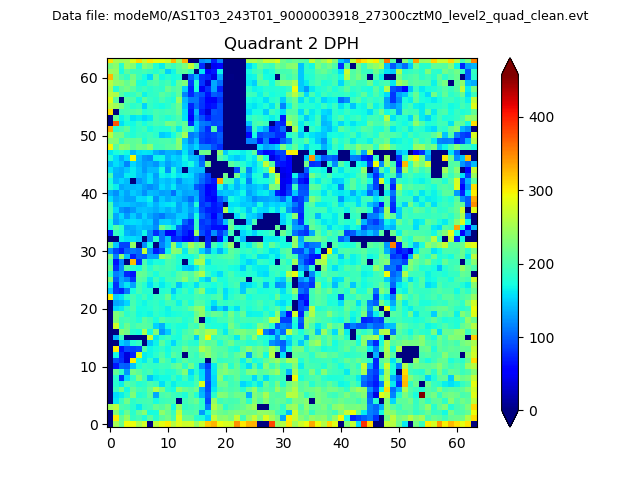
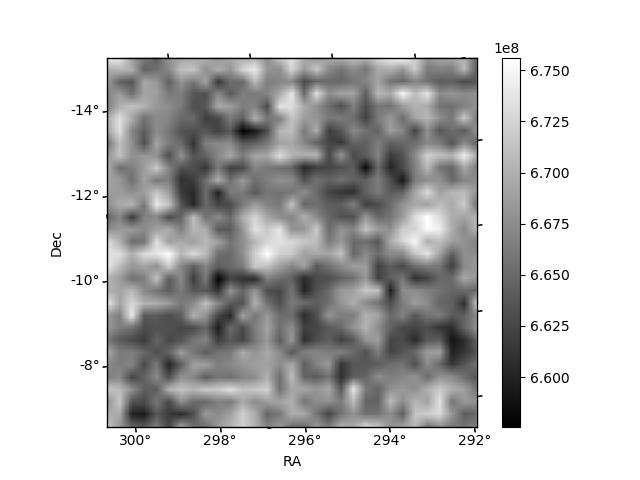
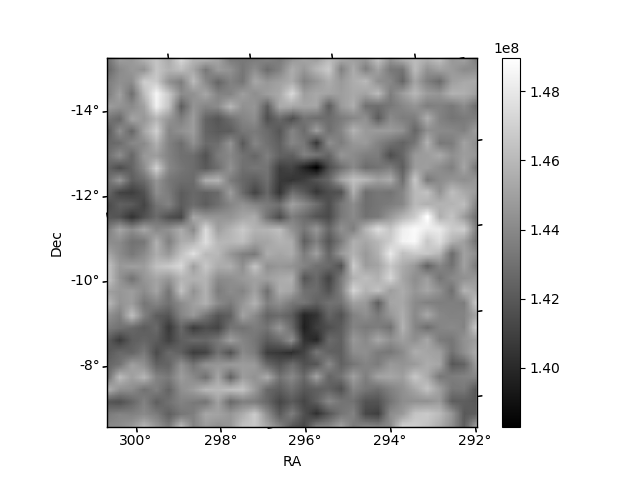
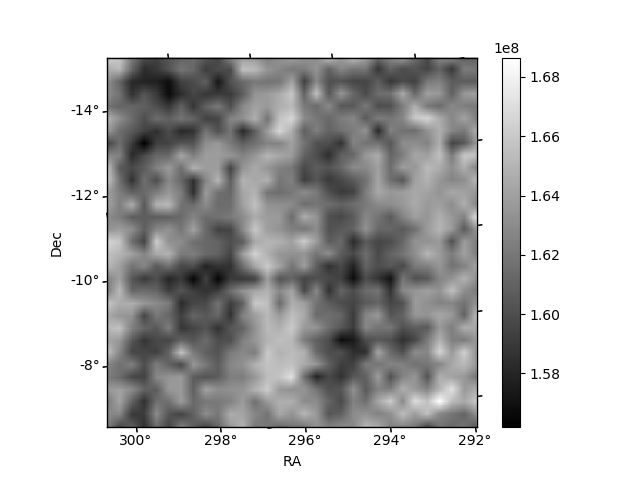
Histogram calculated using DETX and DETY for each event in the final _common_clean file
| Quadrant A | 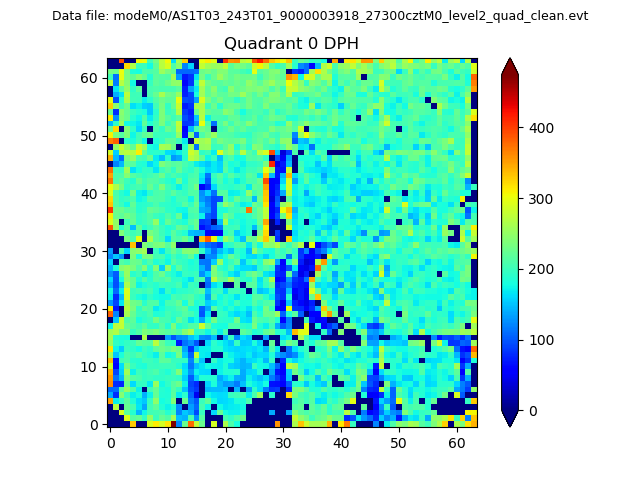 |
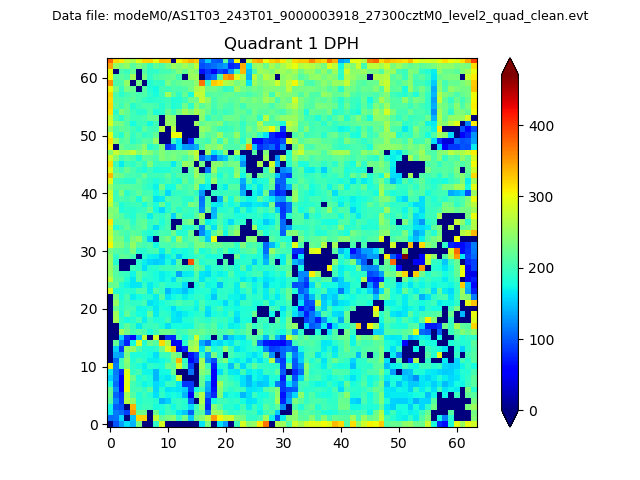 |
Quadrant B |
|---|---|---|---|
| Quadrant D | 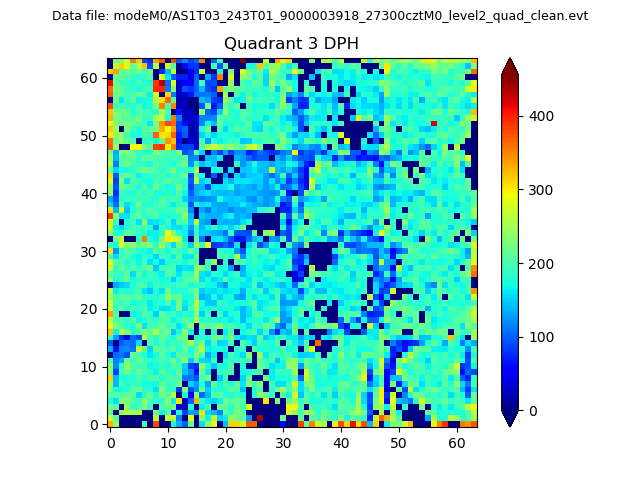 |
 |
Quadrant C |
| Plot type | Count rate plots | Images |
|---|---|---|
| Comparison with Poisson distribution Blue bars denote a histogram of data divided into 1 sec bins. Red curve is a Poisson curve with rate = median count rate of data. |
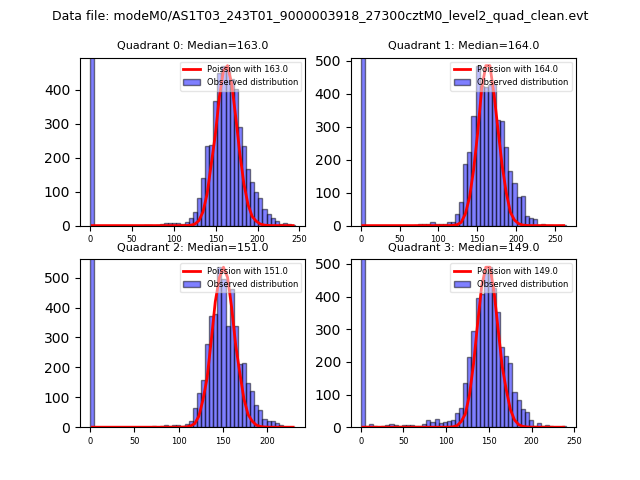 |
 |
| Quadrant-wise count rates Data is divided into 100 sec bins |
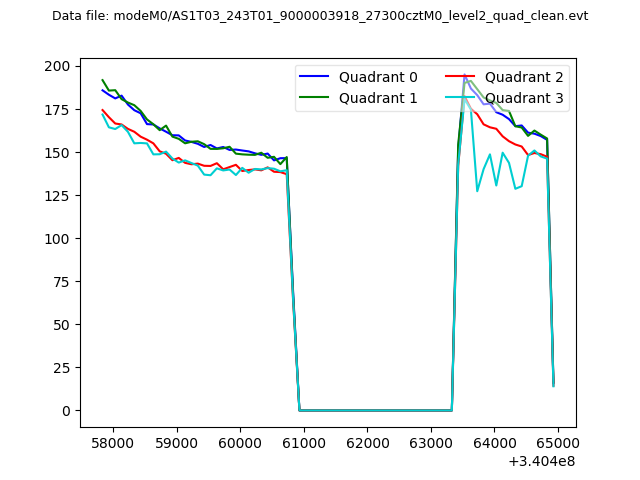 |
|
| Module-wise count rates for Quadrant A Data is divided into 100 sec bins |
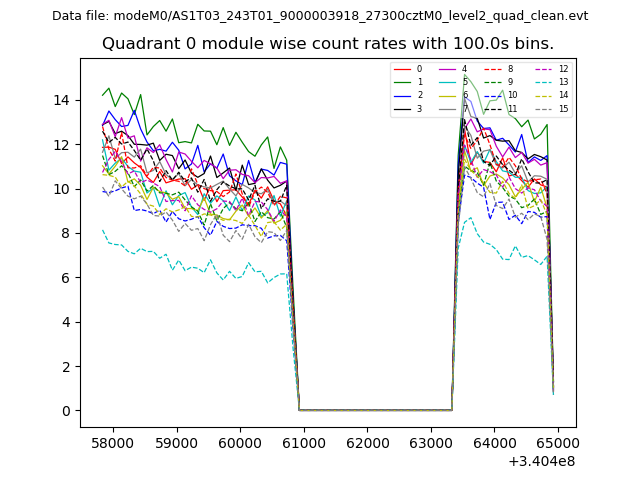 |
 |
| Module-wise count rates for Quadrant B Data is divided into 100 sec bins |
 |
 |
| Module-wise count rates for Quadrant C Data is divided into 100 sec bins |
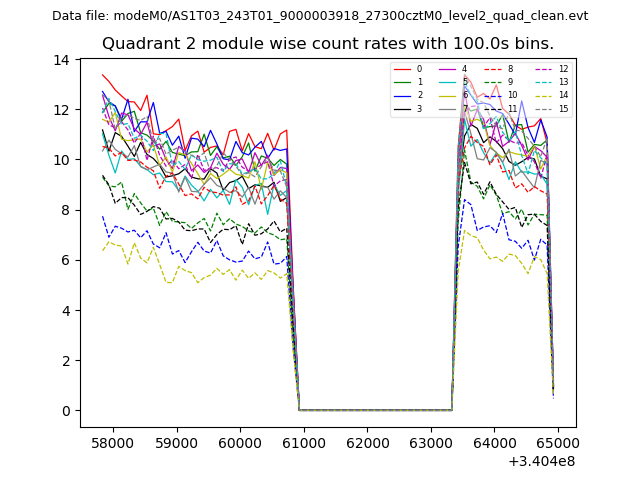 |
 |
| Module-wise count rates for Quadrant D Data is divided into 100 sec bins |
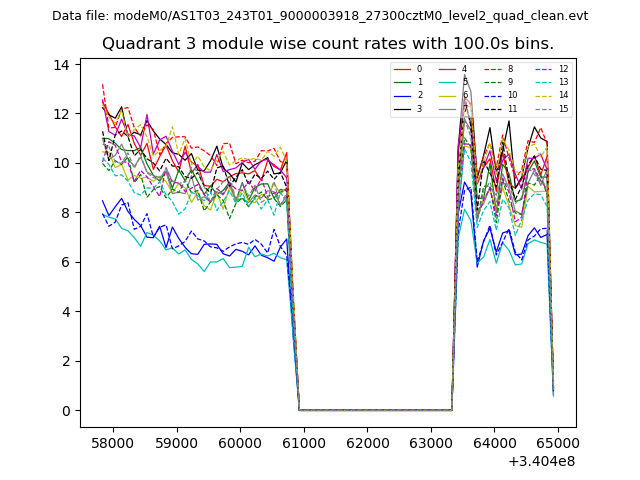 |
 |
| Parameter | Plot |
|---|---|
| CZT HV Monitor | 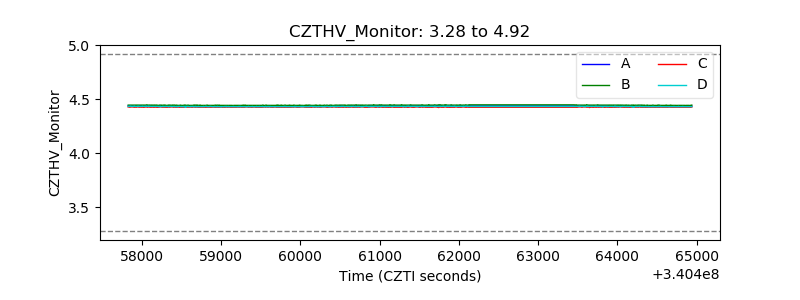 |
| D_VDD | 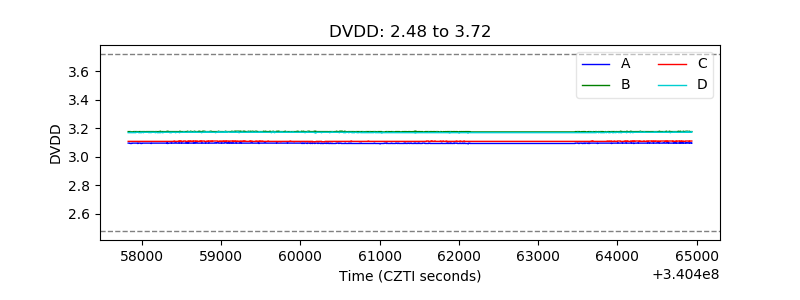 |
| Temperature 1 | 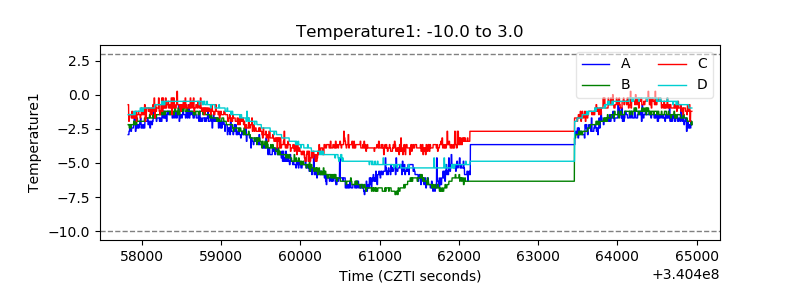 |
| Veto HV Monitor | 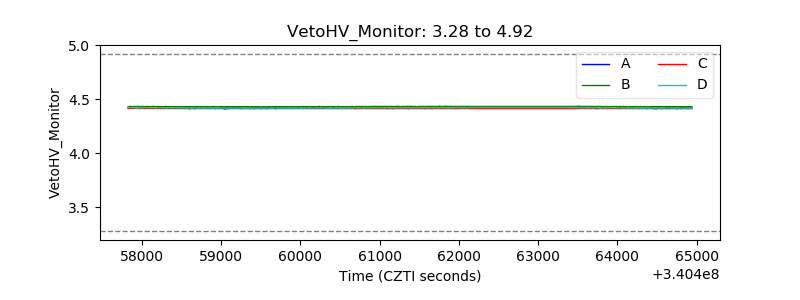 |
| Veto LLD | 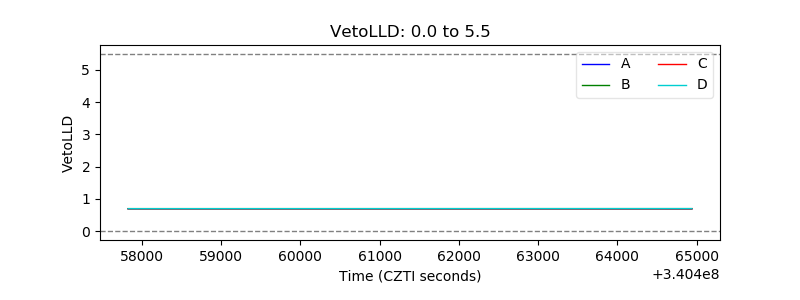 |
| Alpha Counter | 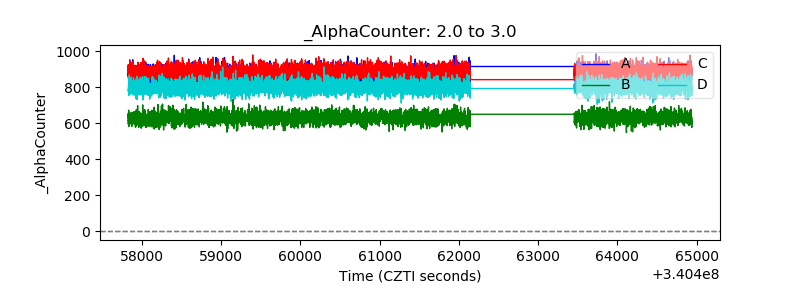 |
| _CPM_Rate | 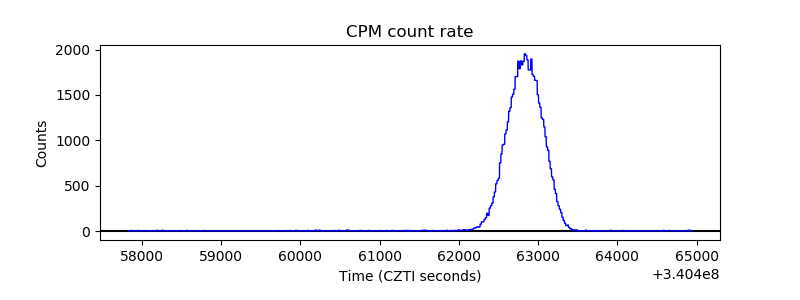 |
| CZT Counter | 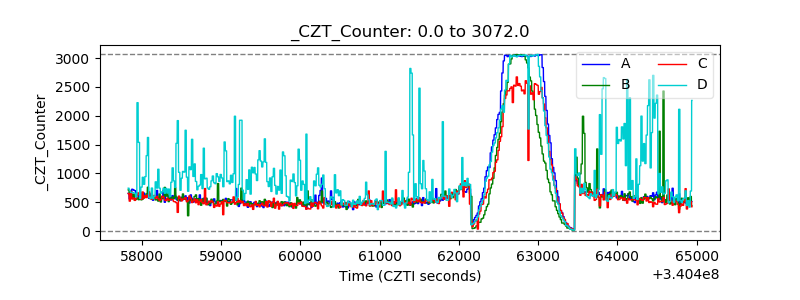 |
| +2.5 Volts monitor | 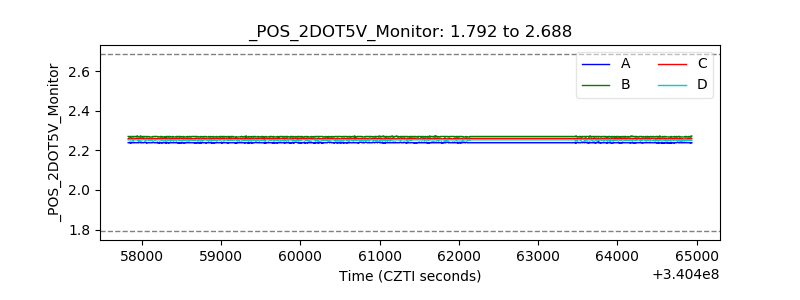 |
| +5 Volts monitor |  |
| _ROLL_ROT | 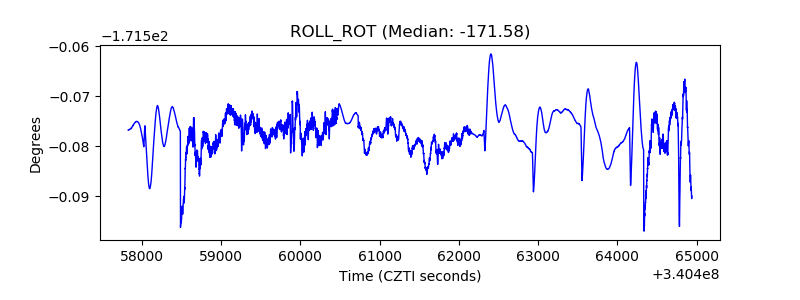 |
| _Roll_DEC | 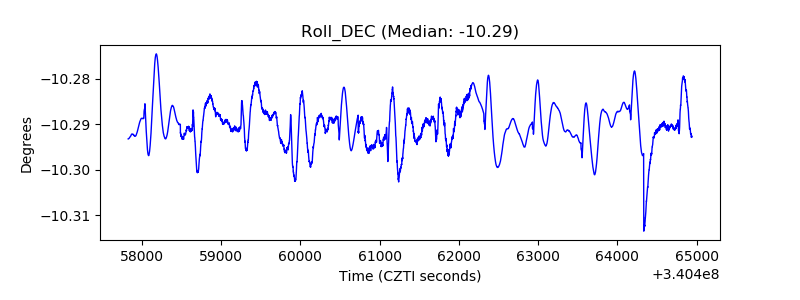 |
| _Roll_RA | 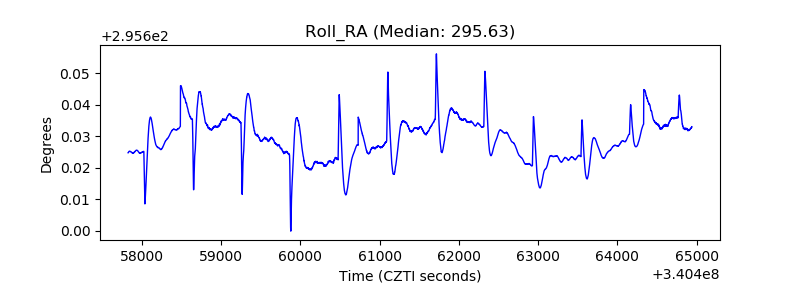 |
| Veto Counter | 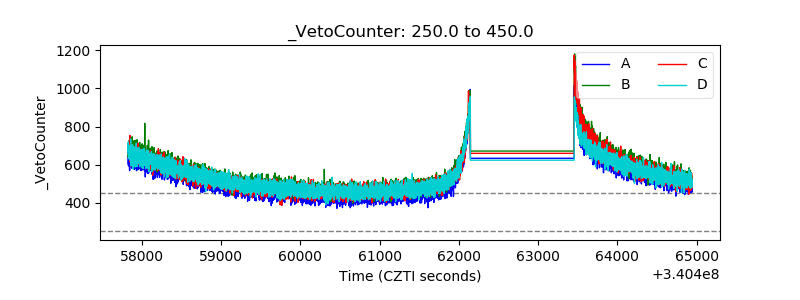 |