| Param | Original file | Final file |
|---|---|---|
| Filename | modeM0/AS1T03_243T01_9000003918_27301cztM0_level2.evt | modeM0/AS1T03_243T01_9000003918_27301cztM0_level2_quad_clean.evt |
| Size (bytes) | 517,818,240 | 100,172,160 |
| Size | 493.8 MB | 95.5 MB |
| Events in quadrant A | 3,264,785 | 677,527 |
| Events in quadrant B | 3,364,195 | 685,218 |
| Events in quadrant C | 3,306,011 | 635,175 |
| Events in quadrant D | 5,328,965 | 605,202 |
| Mode M9 | |||
|---|---|---|---|
| Quadrant | BADHDUFLAG | Total packets | Discarded packets |
| A | 0 | 12 | 0 |
| B | 0 | 12 | 0 |
| C | 0 | 12 | 0 |
| D | 0 | 12 | 0 |
| Mode M0 | |||
|---|---|---|---|
| Quadrant | BADHDUFLAG | Total packets | Discarded packets |
| A | 0 | 13469 | 0 |
| B | 0 | 14038 | 0 |
| C | 0 | 13604 | 0 |
| D | 0 | 20043 | 0 |
| Quadrant | Total seconds | Saturated seconds | Saturation percentage |
|---|---|---|---|
| A | 6163 | 122 | 1.979555% |
| B | 6163 | 128 | 2.076911% |
| C | 6163 | 168 | 2.725945% |
| D | 6164 | 444 | 7.203115% |
Noise dominated data is calculated using 1-second bins in cleaned event files. If a bin has >2000 counts, and if more than 50% of those come from <1% of pixels, then it is considered to be noise-dominated and hence unusable.
| Quadrant | # 1 sec bins | Bins with >0 counts | Bins with >2000 counts | High rate bins dominated by noise | Noise dominated (total time) | Noise dominated (detector-on time) | Marked lightcurve |
|---|---|---|---|---|---|---|---|
| A | 7378 | 6164 | 2 | 2 | 0.03% | 0.03% | 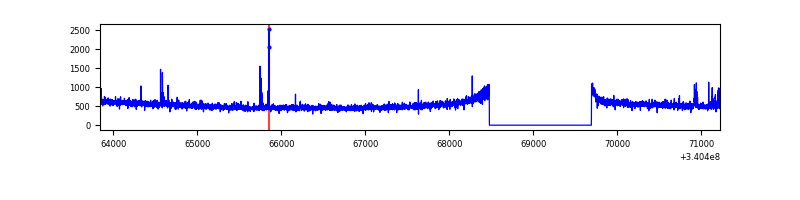 |
| B | 7378 | 6164 | 10 | 10 | 0.14% | 0.16% | 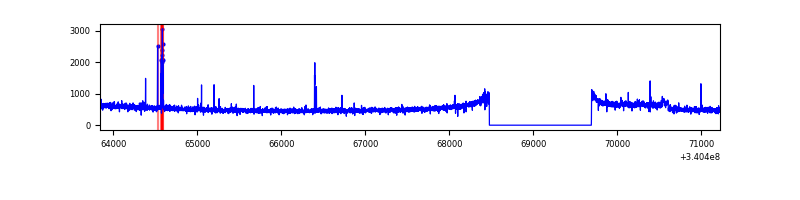 |
| C | 7378 | 6164 | 11 | 11 | 0.15% | 0.18% | 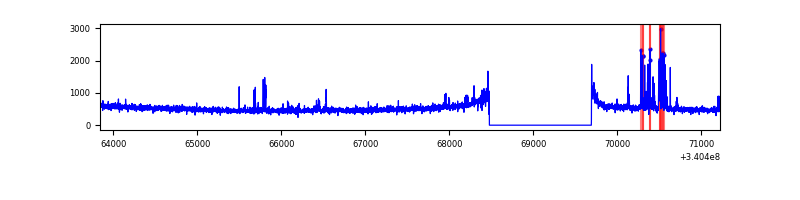 |
| D | 7379 | 6165 | 352 | 352 | 4.77% | 5.71% | 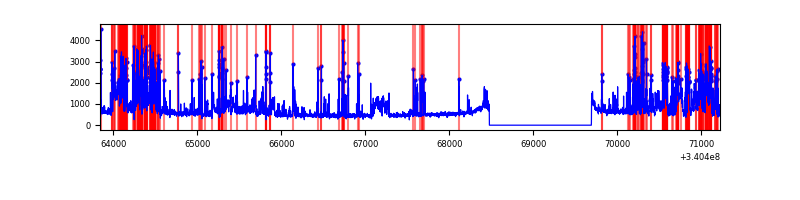 |
Top three noisy pixels from each quadrant. If the there are fewer than three noisy pixels in the level2.evt file, extra rows are filled as -1
| Pixel properties | Quadrant properties | ||||||
|---|---|---|---|---|---|---|---|
| Quadrant | DetID | PixID | Counts | Sigma | Mean | Median | Sigma |
| A | 13 | 248 | 47475 | 278.63 | 832 | 817 | 167.5 |
| A | 13 | 254 | 10435 | 57.44 | 832 | 817 | 167.5 |
| A | 3 | 137 | 7249 | 38.41 | 832 | 817 | 167.5 |
| B | 7 | 205 | 100354 | 643.17 | 818 | 800 | 154.8 |
| B | 10 | 245 | 42169 | 267.26 | 818 | 800 | 154.8 |
| B | 12 | 111 | 18165 | 112.19 | 818 | 800 | 154.8 |
| C | 15 | 208 | 163624 | 899.3 | 774 | 780 | 181.1 |
| C | 14 | 238 | 127290 | 698.65 | 774 | 780 | 181.1 |
| C | 13 | 61 | 5385 | 25.43 | 774 | 780 | 181.1 |
| D | 1 | 52 | 1892358 | 9725.72 | 773 | 759 | 194.5 |
| D | 12 | 233 | 244714 | 1254.3 | 773 | 759 | 194.5 |
| D | 2 | 250 | 156641 | 801.47 | 773 | 759 | 194.5 |
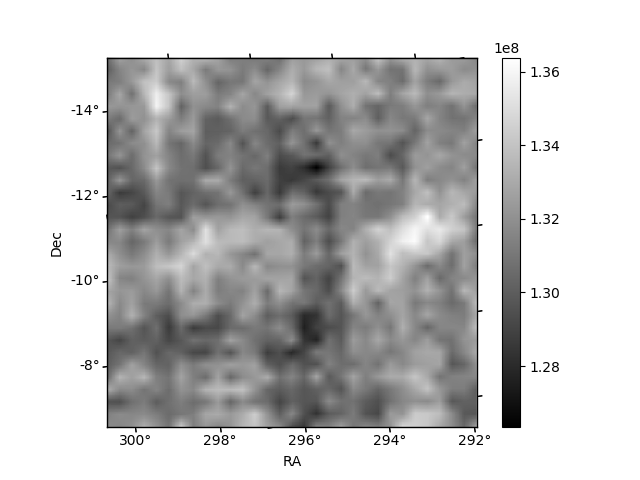
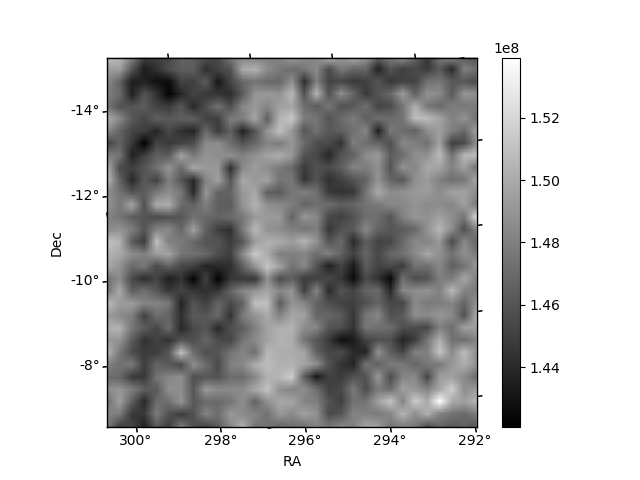
Histogram calculated using DETX and DETY for each event in the final _common_clean file
| Quadrant A |  |
 |
Quadrant B |
|---|---|---|---|
| Quadrant D |  |
 |
Quadrant C |
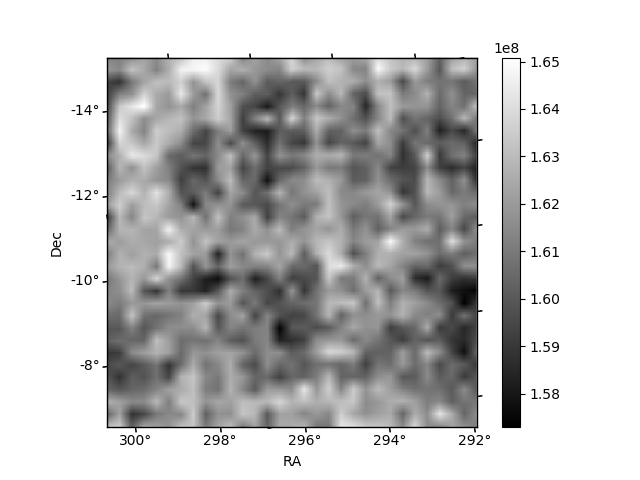
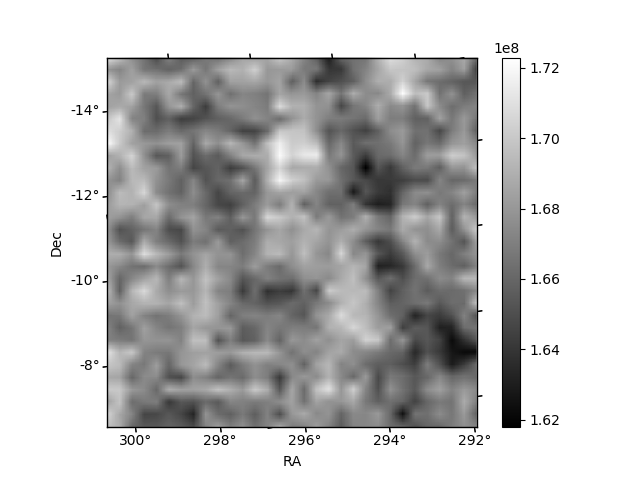
| Plot type | Count rate plots | Images |
|---|---|---|
| Comparison with Poisson distribution Blue bars denote a histogram of data divided into 1 sec bins. Red curve is a Poisson curve with rate = median count rate of data. |
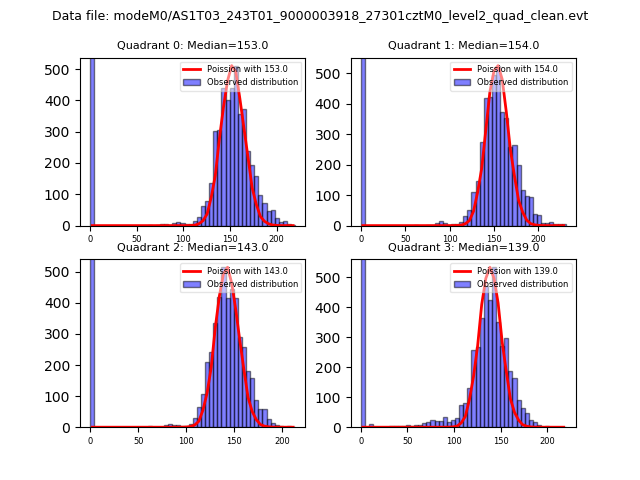 |
 |
| Quadrant-wise count rates Data is divided into 100 sec bins |
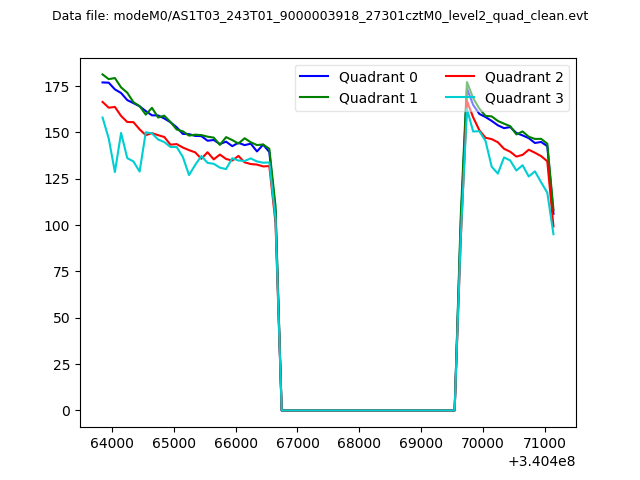 |
|
| Module-wise count rates for Quadrant A Data is divided into 100 sec bins |
 |
 |
| Module-wise count rates for Quadrant B Data is divided into 100 sec bins |
 |
 |
| Module-wise count rates for Quadrant C Data is divided into 100 sec bins |
 |
 |
| Module-wise count rates for Quadrant D Data is divided into 100 sec bins |
 |
 |
| Parameter | Plot |
|---|---|
| CZT HV Monitor |  |
| D_VDD | 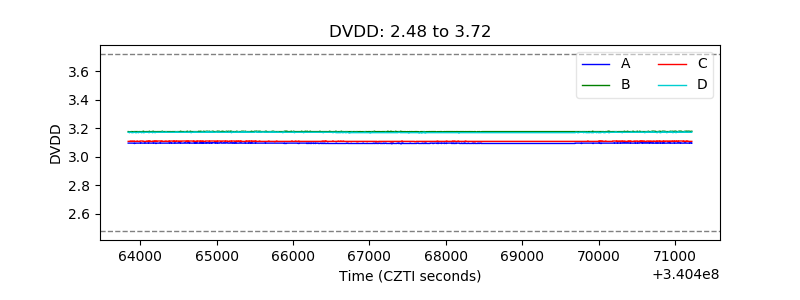 |
| Temperature 1 |  |
| Veto HV Monitor |  |
| Veto LLD |  |
| Alpha Counter | 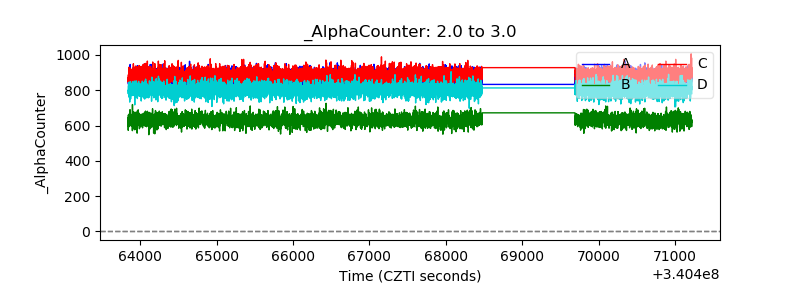 |
| _CPM_Rate | 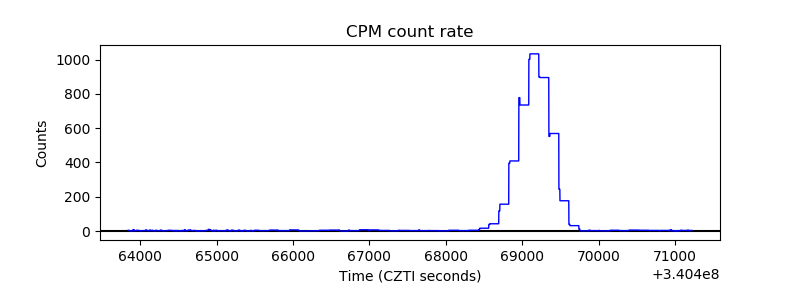 |
| CZT Counter |  |
| +2.5 Volts monitor |  |
| +5 Volts monitor |  |
| _ROLL_ROT |  |
| _Roll_DEC |  |
| _Roll_RA |  |
| Veto Counter |  |