| Param | Original file | Final file |
|---|---|---|
| Filename | modeM0/AS1T03_243T01_9000003918_27302cztM0_level2.evt | modeM0/AS1T03_243T01_9000003918_27302cztM0_level2_quad_clean.evt |
| Size (bytes) | 516,375,360 | 93,231,360 |
| Size | 492.5 MB | 88.9 MB |
| Events in quadrant A | 3,450,274 | 611,591 |
| Events in quadrant B | 3,432,480 | 617,690 |
| Events in quadrant C | 3,382,590 | 579,627 |
| Events in quadrant D | 4,928,906 | 557,616 |
| Mode M9 | |||
|---|---|---|---|
| Quadrant | BADHDUFLAG | Total packets | Discarded packets |
| A | 0 | 9 | 0 |
| B | 0 | 9 | 0 |
| C | 0 | 9 | 0 |
| D | 0 | 9 | 0 |
| Mode M0 | |||
|---|---|---|---|
| Quadrant | BADHDUFLAG | Total packets | Discarded packets |
| A | 0 | 14334 | 0 |
| B | 0 | 14532 | 0 |
| C | 0 | 14152 | 0 |
| D | 0 | 19128 | 0 |
| Quadrant | Total seconds | Saturated seconds | Saturation percentage |
|---|---|---|---|
| A | 6548 | 88 | 1.343922% |
| B | 6548 | 96 | 1.466097% |
| C | 6548 | 105 | 1.603543% |
| D | 6548 | 252 | 3.848503% |
Noise dominated data is calculated using 1-second bins in cleaned event files. If a bin has >2000 counts, and if more than 50% of those come from <1% of pixels, then it is considered to be noise-dominated and hence unusable.
| Quadrant | # 1 sec bins | Bins with >0 counts | Bins with >2000 counts | High rate bins dominated by noise | Noise dominated (total time) | Noise dominated (detector-on time) | Marked lightcurve |
|---|---|---|---|---|---|---|---|
| A | 7498 | 6549 | 20 | 20 | 0.27% | 0.31% | 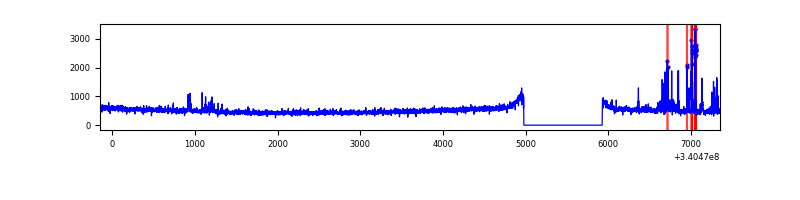 |
| B | 7498 | 6549 | 6 | 6 | 0.08% | 0.09% | 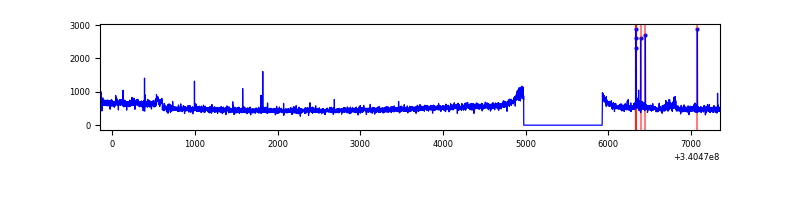 |
| C | 7498 | 6549 | 12 | 12 | 0.16% | 0.18% | 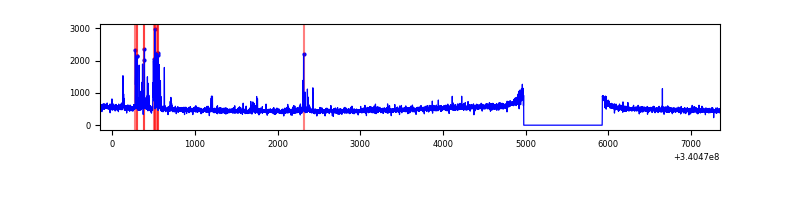 |
| D | 7498 | 6549 | 238 | 238 | 3.17% | 3.63% | 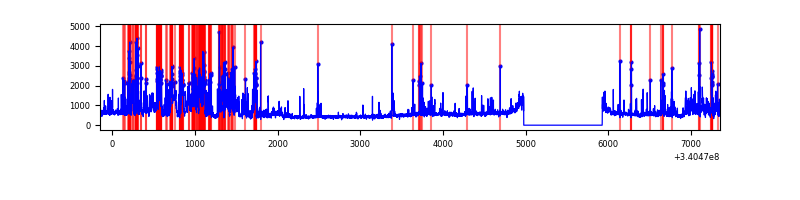 |
Top three noisy pixels from each quadrant. If the there are fewer than three noisy pixels in the level2.evt file, extra rows are filled as -1
| Pixel properties | Quadrant properties | ||||||
|---|---|---|---|---|---|---|---|
| Quadrant | DetID | PixID | Counts | Sigma | Mean | Median | Sigma |
| A | 13 | 248 | 158870 | 931.18 | 847 | 833 | 169.7 |
| A | 12 | 189 | 21270 | 120.42 | 847 | 833 | 169.7 |
| A | 13 | 254 | 10538 | 57.18 | 847 | 833 | 169.7 |
| B | 7 | 205 | 86822 | 535.93 | 837 | 817 | 160.5 |
| B | 0 | 190 | 27817 | 168.25 | 837 | 817 | 160.5 |
| B | 5 | 172 | 23946 | 144.13 | 837 | 817 | 160.5 |
| C | 15 | 208 | 136774 | 721.82 | 797 | 804 | 188.4 |
| C | 14 | 238 | 128256 | 676.6 | 797 | 804 | 188.4 |
| C | 3 | 9 | 11274 | 55.58 | 797 | 804 | 188.4 |
| D | 1 | 52 | 1575049 | 7864.37 | 798 | 779 | 200.2 |
| D | 12 | 233 | 129265 | 641.86 | 798 | 779 | 200.2 |
| D | 2 | 250 | 89237 | 441.9 | 798 | 779 | 200.2 |
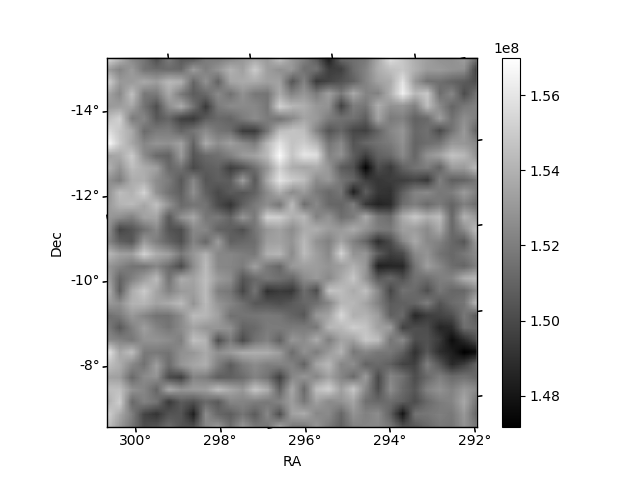
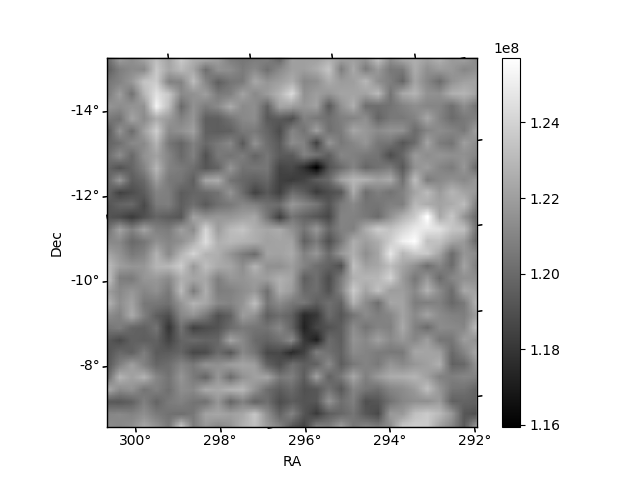
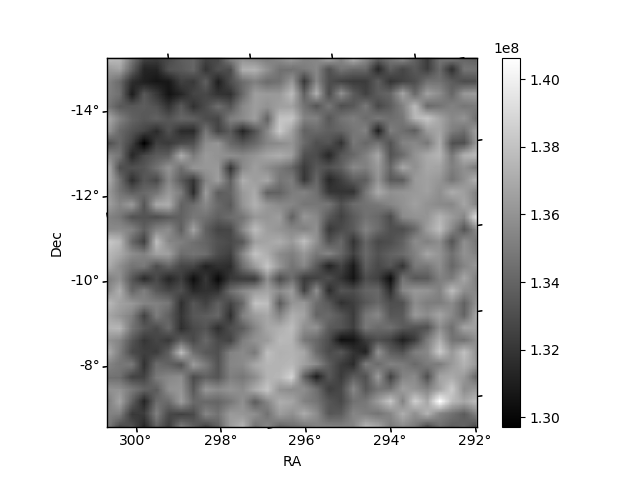
Histogram calculated using DETX and DETY for each event in the final _common_clean file
| Quadrant A | 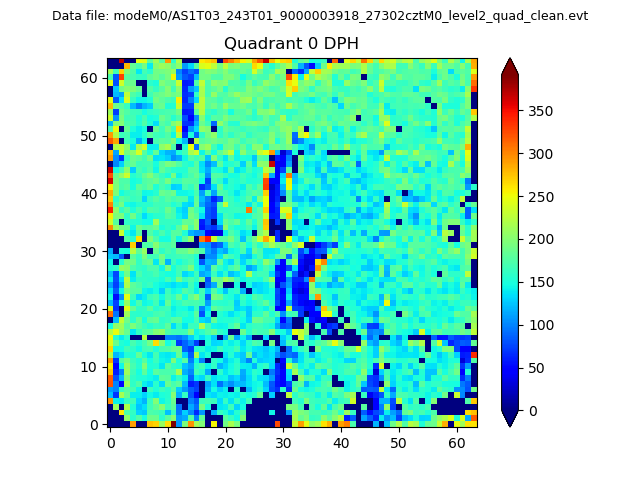 |
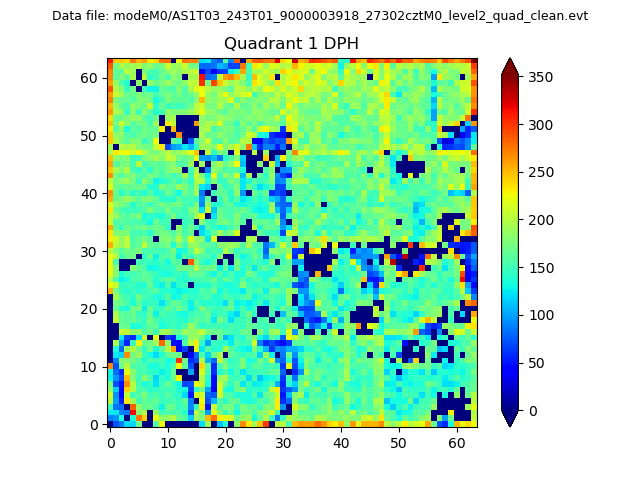 |
Quadrant B |
|---|---|---|---|
| Quadrant D | 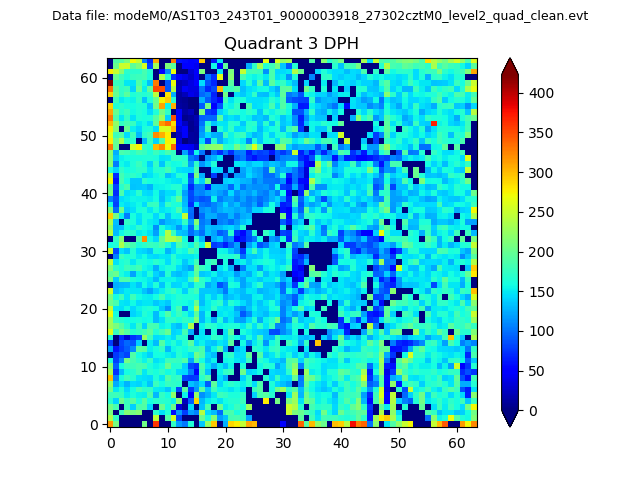 |
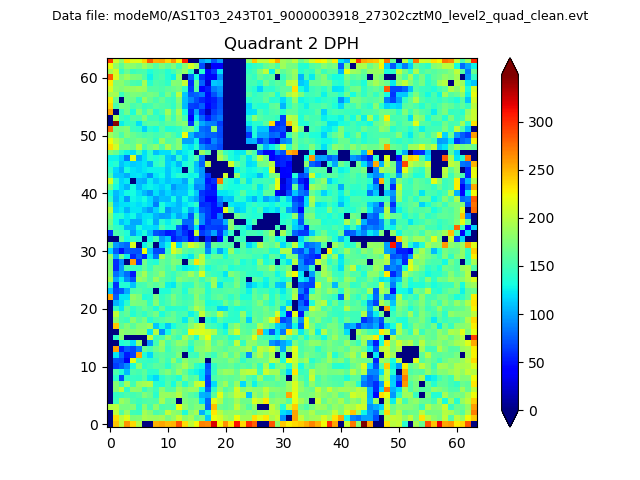 |
Quadrant C |
| Plot type | Count rate plots | Images |
|---|---|---|
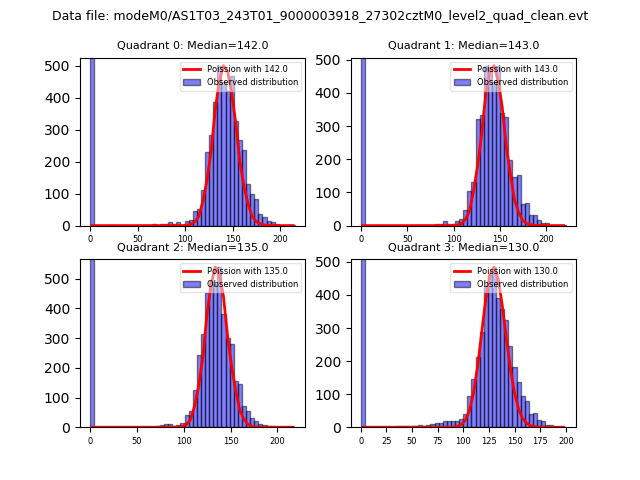
| Comparison with Poisson distribution Blue bars denote a histogram of data divided into 1 sec bins. Red curve is a Poisson curve with rate = median count rate of data. |
 |
 |
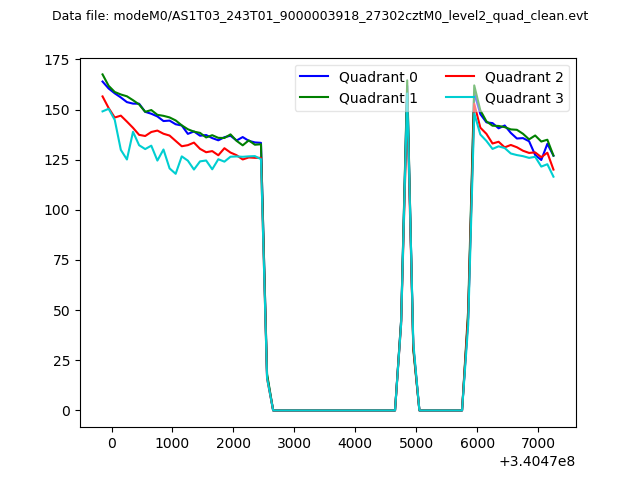
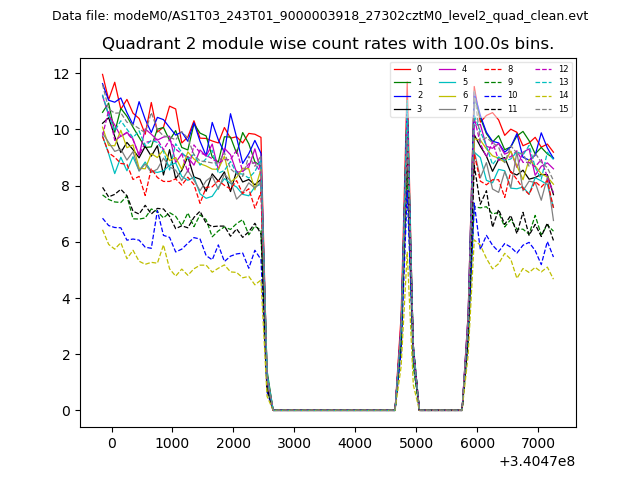
| Quadrant-wise count rates Data is divided into 100 sec bins |
 |
|
| Module-wise count rates for Quadrant A Data is divided into 100 sec bins |
 |
 |
| Module-wise count rates for Quadrant B Data is divided into 100 sec bins |
 |
 |
| Module-wise count rates for Quadrant C Data is divided into 100 sec bins |
 |
 |
| Module-wise count rates for Quadrant D Data is divided into 100 sec bins |
 |
 |
| Parameter | Plot |
|---|---|
| CZT HV Monitor | 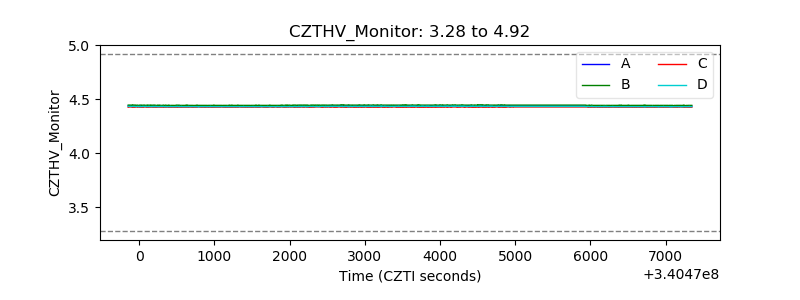 |
| D_VDD | 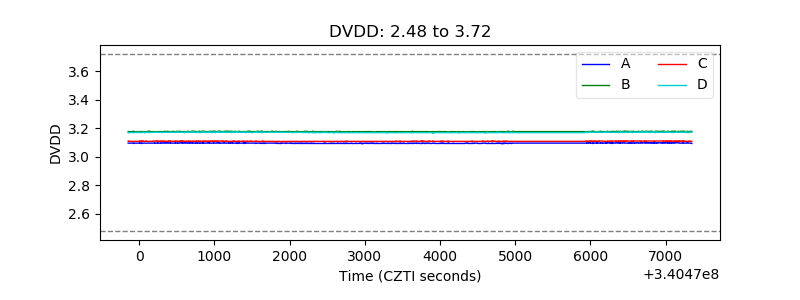 |
| Temperature 1 | 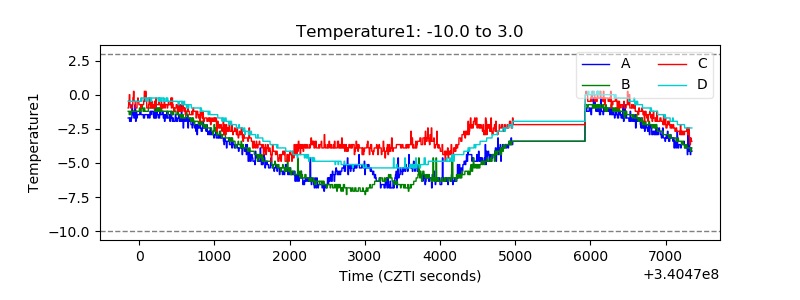 |
| Veto HV Monitor |  |
| Veto LLD | 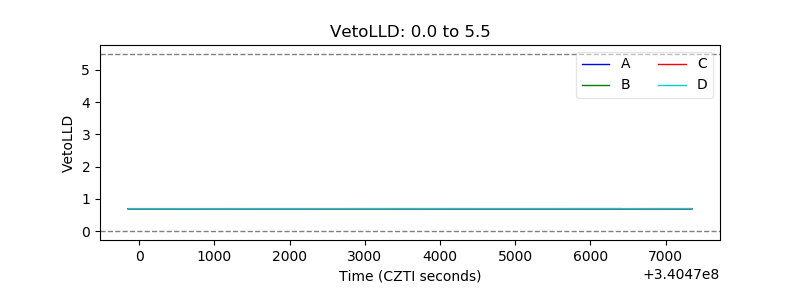 |
| Alpha Counter | 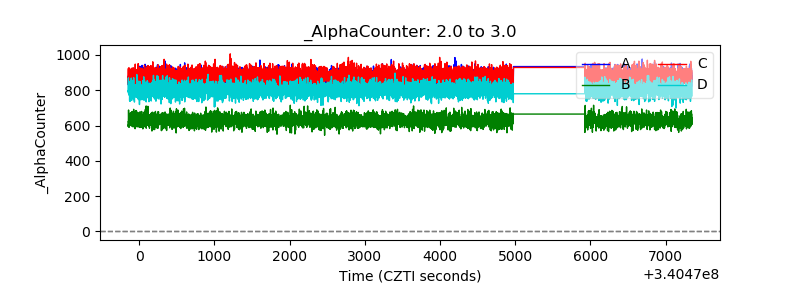 |
| _CPM_Rate | 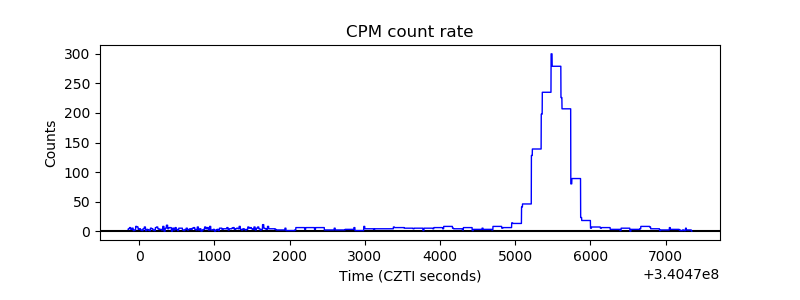 |
| CZT Counter | 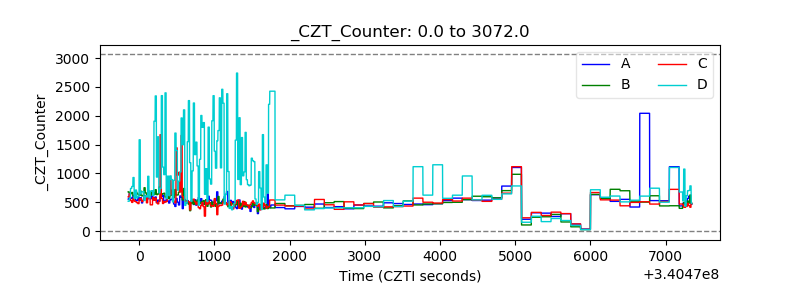 |
| +2.5 Volts monitor | 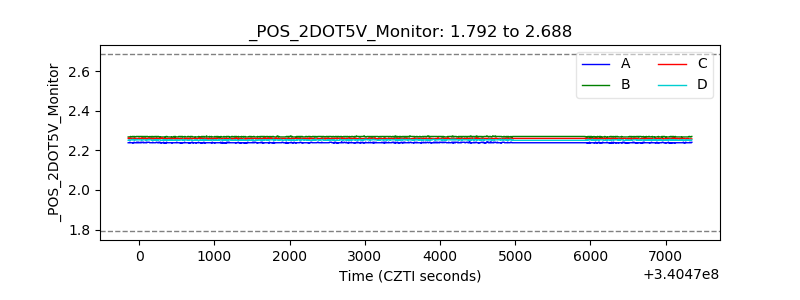 |
| +5 Volts monitor |  |
| _ROLL_ROT | 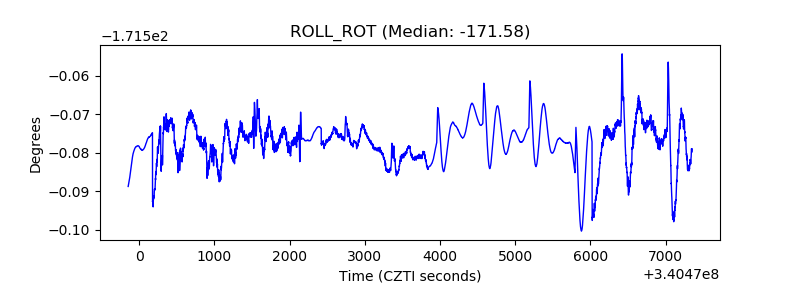 |
| _Roll_DEC | 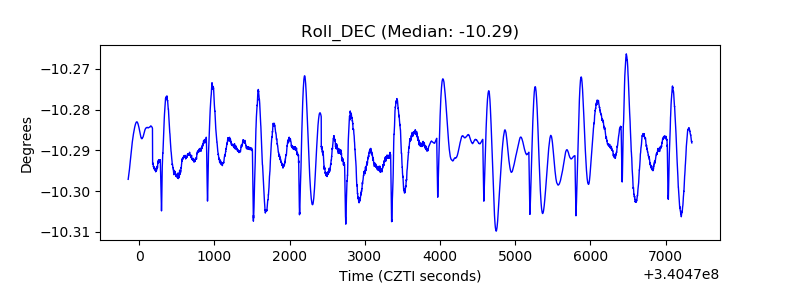 |
| _Roll_RA |  |
| Veto Counter | 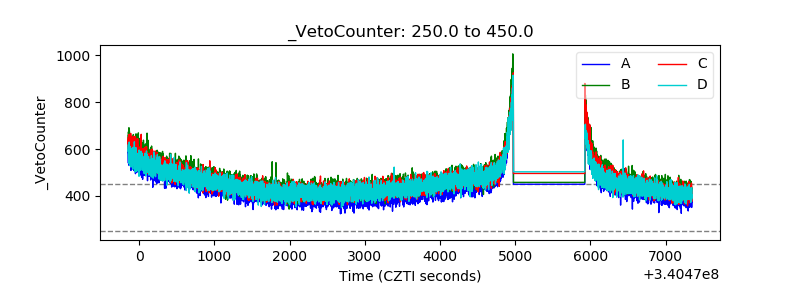 |