| Param | Original file | Final file |
|---|---|---|
| Filename | modeM0/AS1T03_243T01_9000003918_27303cztM0_level2.evt | modeM0/AS1T03_243T01_9000003918_27303cztM0_level2_quad_clean.evt |
| Size (bytes) | 581,745,600 | 99,826,560 |
| Size | 554.8 MB | 95.2 MB |
| Events in quadrant A | 3,668,894 | 653,249 |
| Events in quadrant B | 3,769,882 | 656,321 |
| Events in quadrant C | 3,431,675 | 625,288 |
| Events in quadrant D | 6,270,152 | 597,172 |
| Mode M9 | |||
|---|---|---|---|
| Quadrant | BADHDUFLAG | Total packets | Discarded packets |
| A | 0 | 8 | 0 |
| B | 0 | 9 | 0 |
| C | 0 | 9 | 0 |
| D | 0 | 9 | 0 |
| Mode M0 | |||
|---|---|---|---|
| Quadrant | BADHDUFLAG | Total packets | Discarded packets |
| A | 0 | 15401 | 0 |
| B | 0 | 15638 | 0 |
| C | 0 | 14677 | 0 |
| D | 0 | 23362 | 0 |
| Quadrant | Total seconds | Saturated seconds | Saturation percentage |
|---|---|---|---|
| A | 7053 | 73 | 1.035021% |
| B | 7053 | 173 | 2.452857% |
| C | 7053 | 103 | 1.460371% |
| D | 7053 | 482 | 6.833971% |
Noise dominated data is calculated using 1-second bins in cleaned event files. If a bin has >2000 counts, and if more than 50% of those come from <1% of pixels, then it is considered to be noise-dominated and hence unusable.
| Quadrant | # 1 sec bins | Bins with >0 counts | Bins with >2000 counts | High rate bins dominated by noise | Noise dominated (total time) | Noise dominated (detector-on time) | Marked lightcurve |
|---|---|---|---|---|---|---|---|
| A | 7598 | 7054 | 25 | 25 | 0.33% | 0.35% | 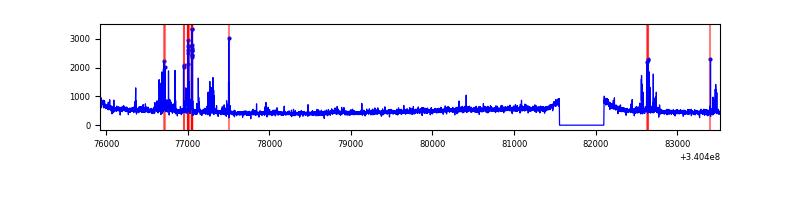 |
| B | 7598 | 7054 | 48 | 48 | 0.63% | 0.68% | 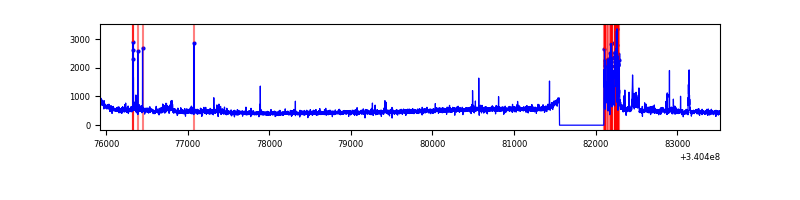 |
| C | 7598 | 7054 | 0 | 0 | 0.00% | 0.00% | 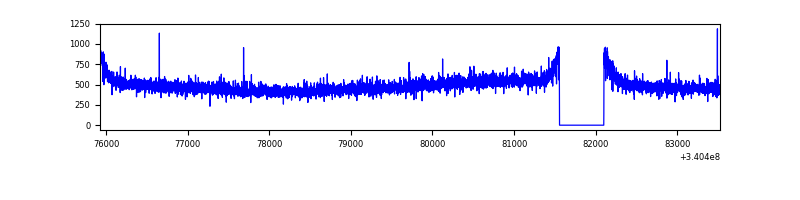 |
| D | 7598 | 7054 | 428 | 428 | 5.63% | 6.07% | 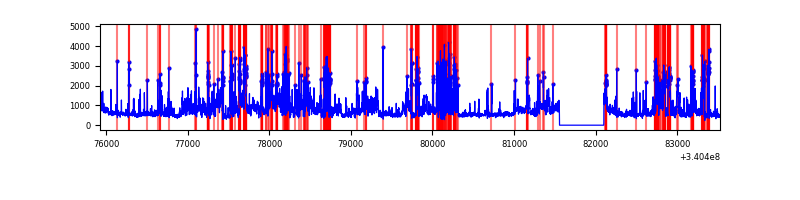 |
Top three noisy pixels from each quadrant. If the there are fewer than three noisy pixels in the level2.evt file, extra rows are filled as -1
| Pixel properties | Quadrant properties | ||||||
|---|---|---|---|---|---|---|---|
| Quadrant | DetID | PixID | Counts | Sigma | Mean | Median | Sigma |
| A | 13 | 248 | 193757 | 1078.09 | 888 | 871 | 178.9 |
| A | 12 | 189 | 33489 | 182.31 | 888 | 871 | 178.9 |
| A | 13 | 254 | 11632 | 60.15 | 888 | 871 | 178.9 |
| B | 5 | 172 | 245500 | 1459.36 | 876 | 853 | 167.6 |
| B | 0 | 190 | 70714 | 416.73 | 876 | 853 | 167.6 |
| B | 12 | 111 | 20253 | 115.72 | 876 | 853 | 167.6 |
| C | 14 | 238 | 134564 | 669.96 | 843 | 849 | 199.6 |
| C | 15 | 208 | 6673 | 29.18 | 843 | 849 | 199.6 |
| C | 13 | 61 | 5811 | 24.86 | 843 | 849 | 199.6 |
| D | 1 | 52 | 2717397 | 13177.3 | 831 | 811 | 206.2 |
| D | 2 | 250 | 199116 | 961.91 | 831 | 811 | 206.2 |
| D | 10 | 103 | 33539 | 158.75 | 831 | 811 | 206.2 |
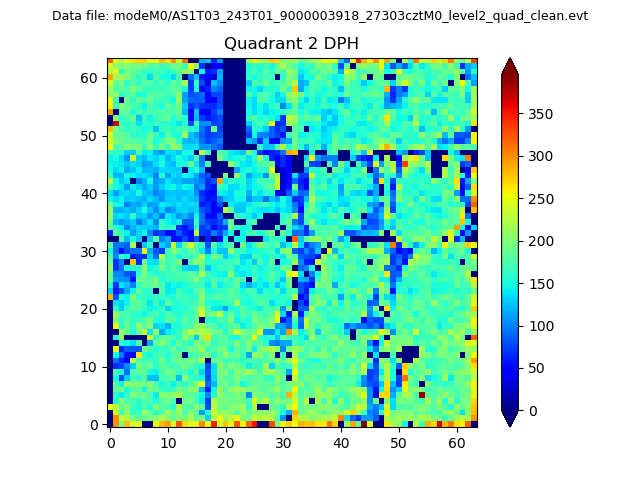
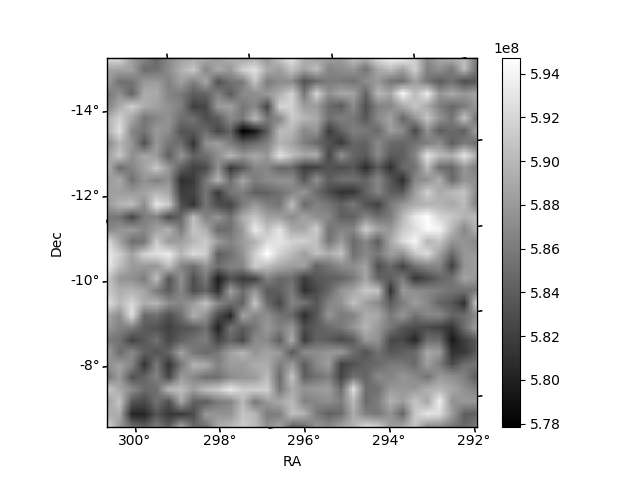
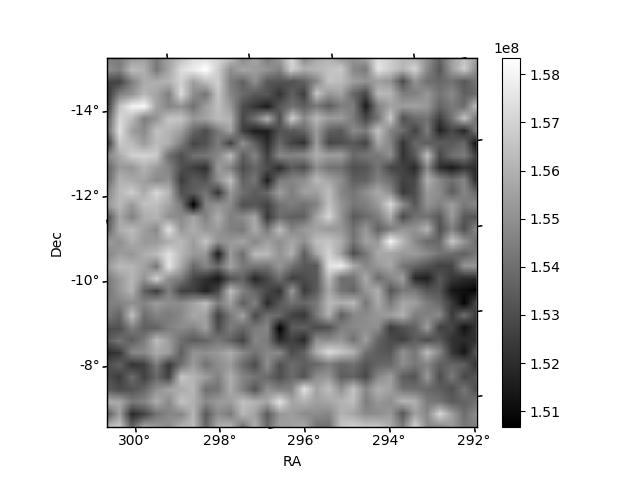
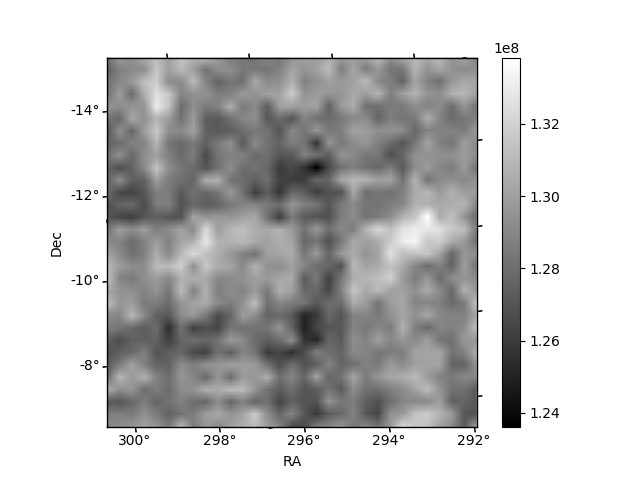
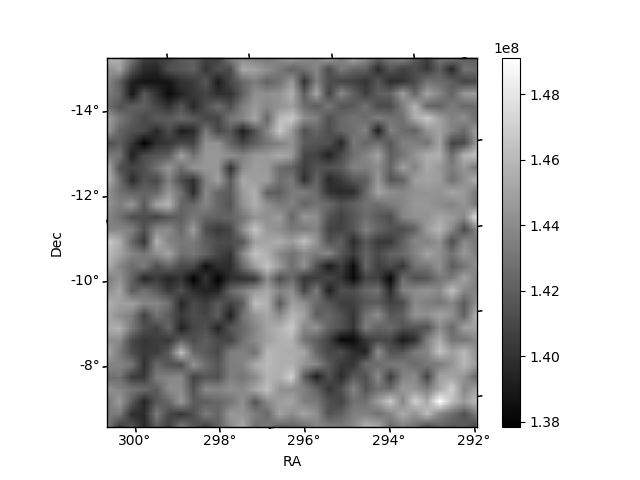
Histogram calculated using DETX and DETY for each event in the final _common_clean file
| Quadrant A | 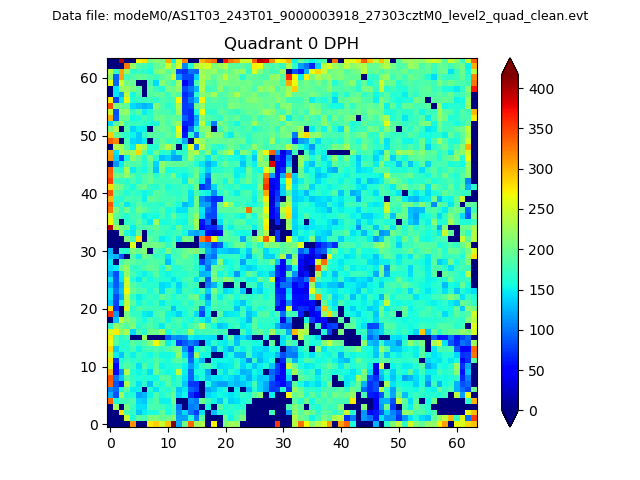 |
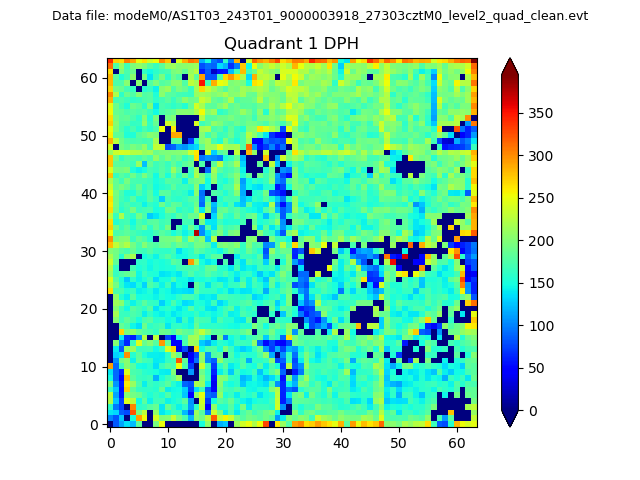 |
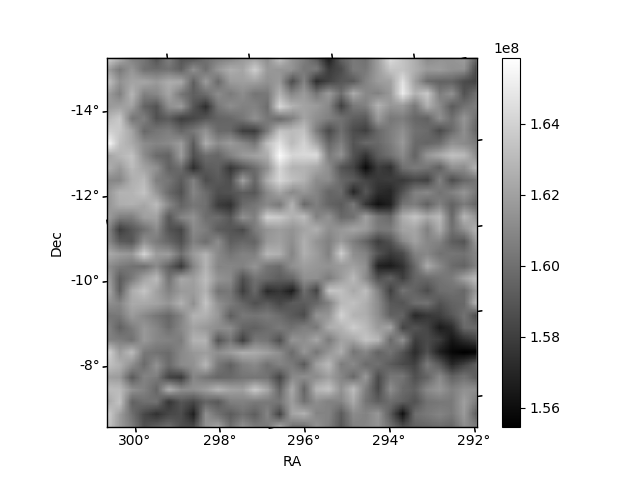
Quadrant B |
|---|---|---|---|
| Quadrant D | 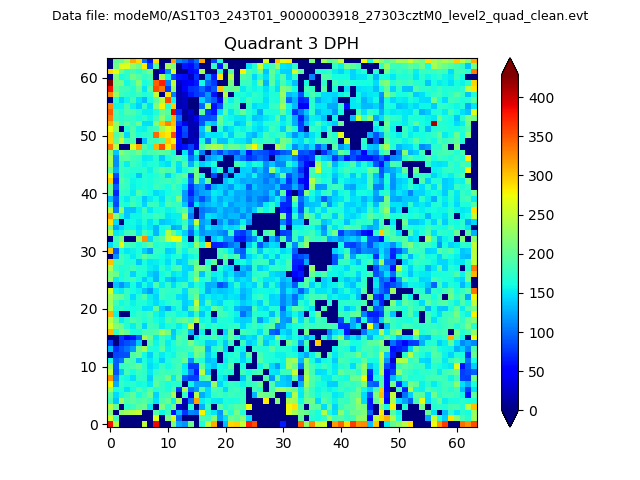 |
 |
Quadrant C |
| Plot type | Count rate plots | Images |
|---|---|---|
| Comparison with Poisson distribution Blue bars denote a histogram of data divided into 1 sec bins. Red curve is a Poisson curve with rate = median count rate of data. |
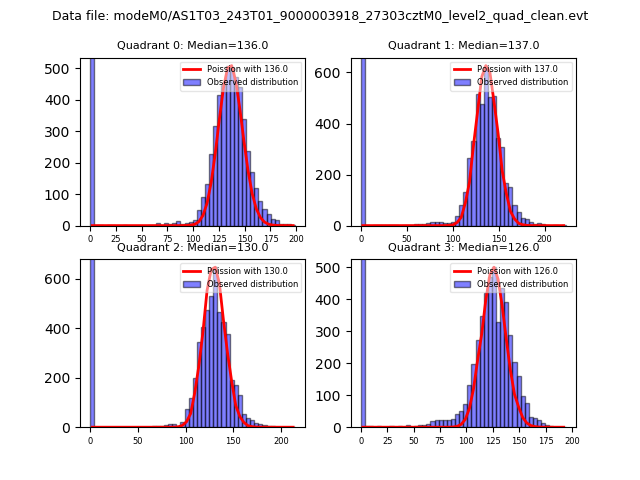 |
 |
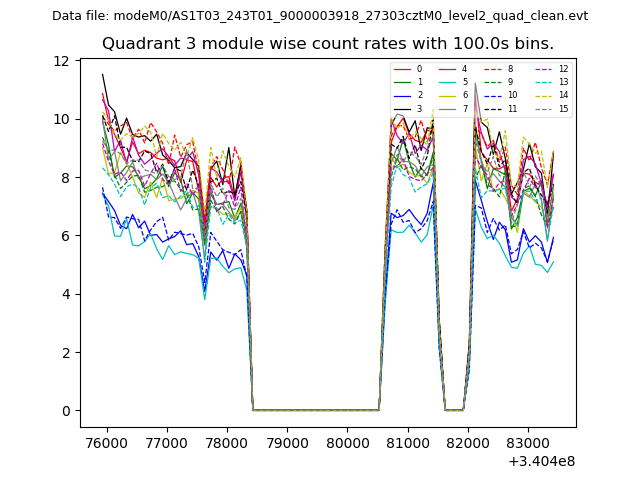
| Quadrant-wise count rates Data is divided into 100 sec bins |
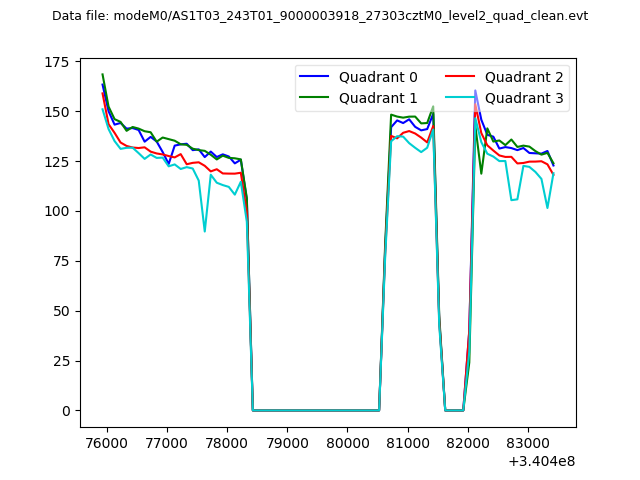 |
|
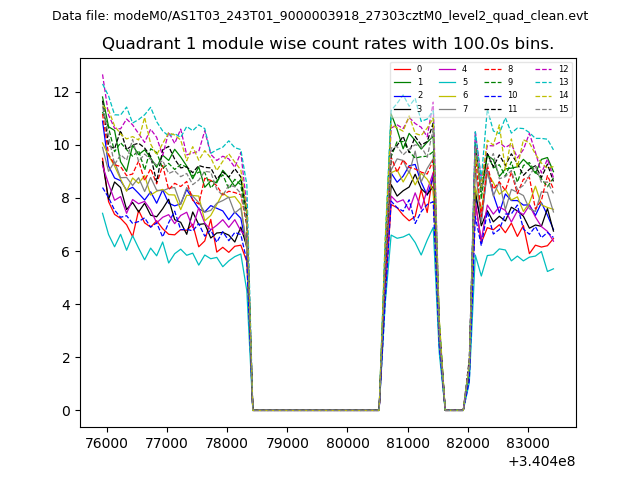
| Module-wise count rates for Quadrant A Data is divided into 100 sec bins |
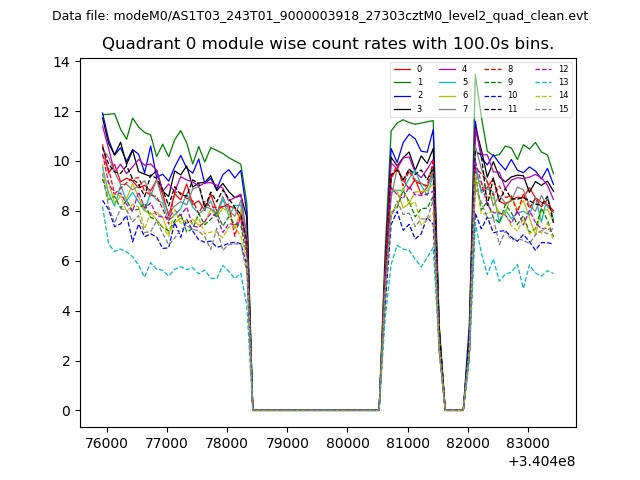 |
 |
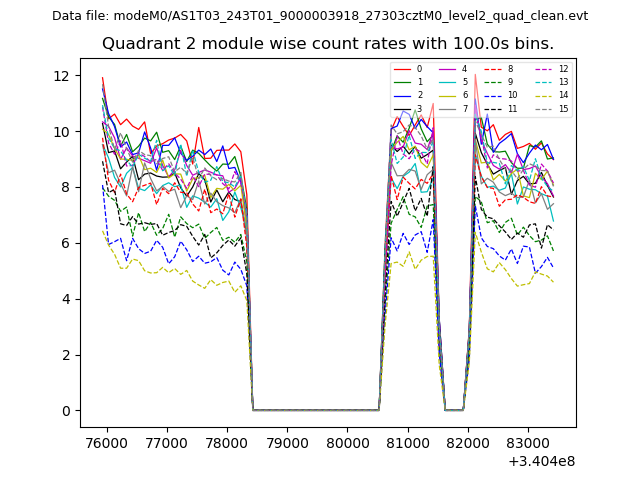
| Module-wise count rates for Quadrant B Data is divided into 100 sec bins |
 |
 |
| Module-wise count rates for Quadrant C Data is divided into 100 sec bins |
 |
 |
| Module-wise count rates for Quadrant D Data is divided into 100 sec bins |
 |
 |
| Parameter | Plot |
|---|---|
| CZT HV Monitor | 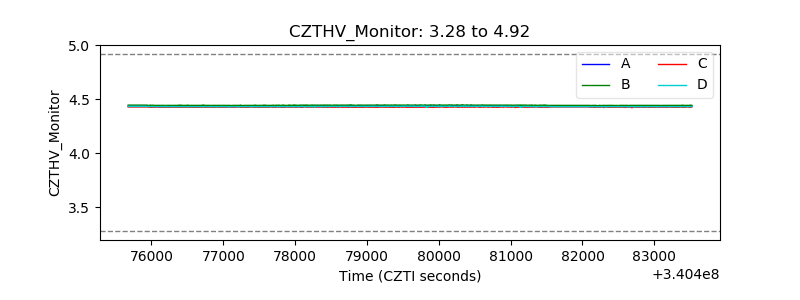 |
| D_VDD | 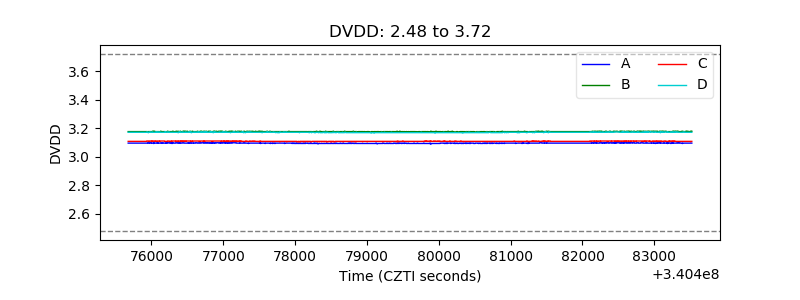 |
| Temperature 1 | 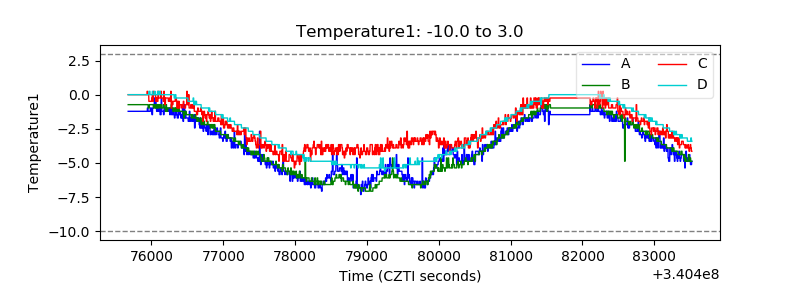 |
| Veto HV Monitor | 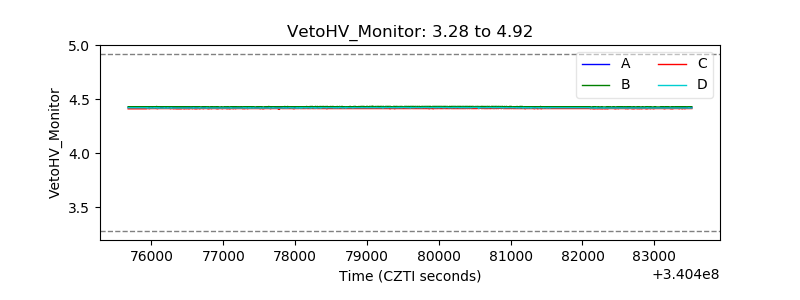 |
| Veto LLD | 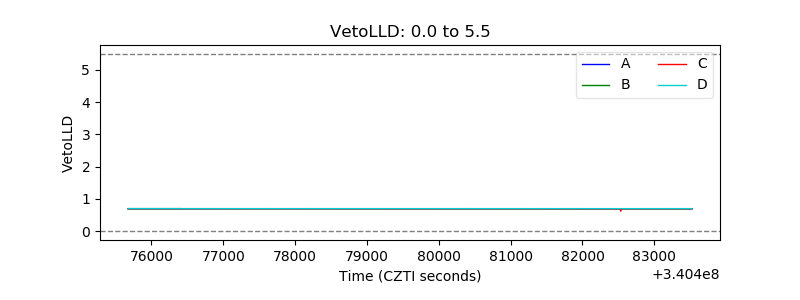 |
| Alpha Counter | 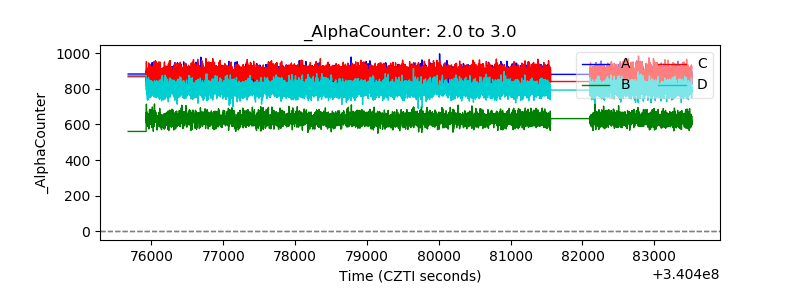 |
| _CPM_Rate | 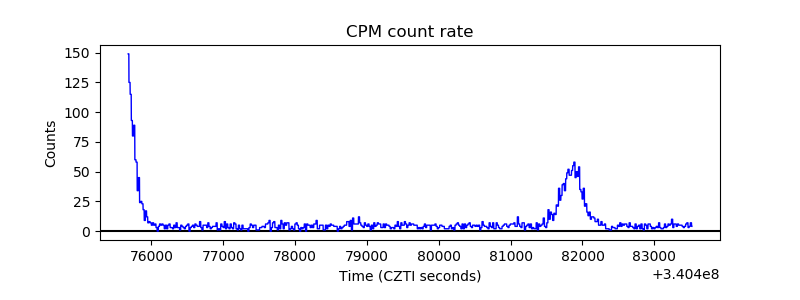 |
| CZT Counter | 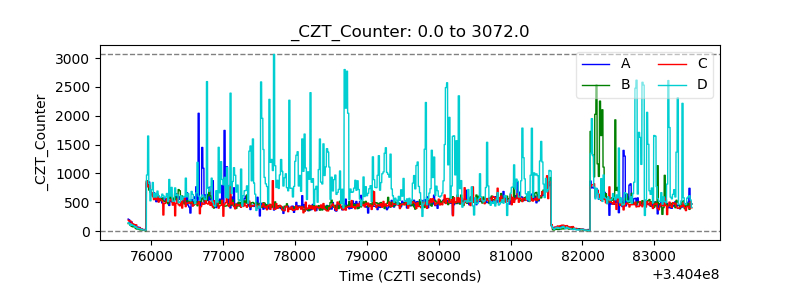 |
| +2.5 Volts monitor |  |
| +5 Volts monitor | 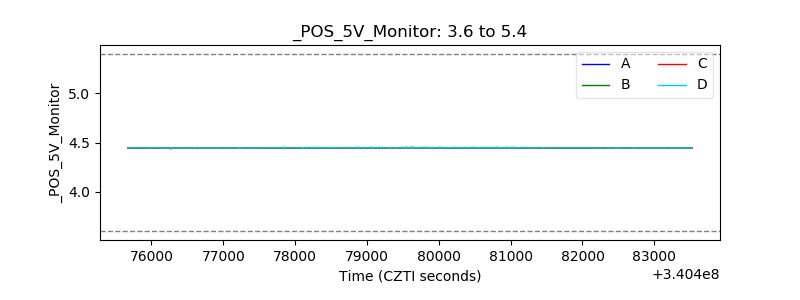 |
| _ROLL_ROT | 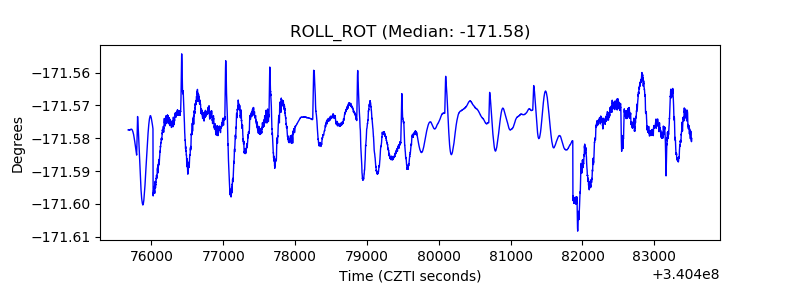 |
| _Roll_DEC | 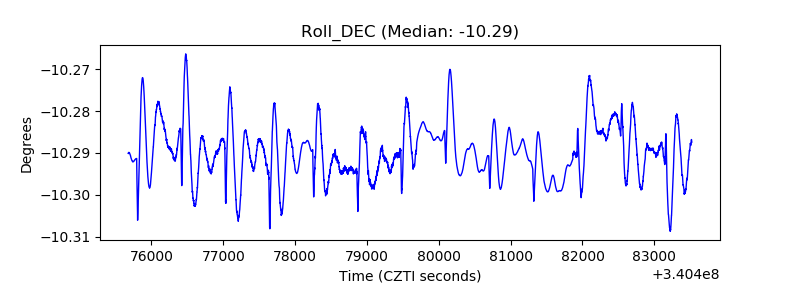 |
| _Roll_RA | 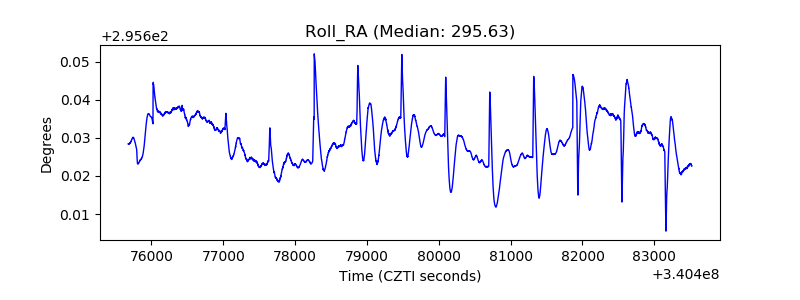 |
| Veto Counter |  |