| Param | Original file | Final file |
|---|---|---|
| Filename | modeM0/AS1T03_243T01_9000003918_27304cztM0_level2.evt | modeM0/AS1T03_243T01_9000003918_27304cztM0_level2_quad_clean.evt |
| Size (bytes) | 548,737,920 | 100,209,600 |
| Size | 523.3 MB | 95.6 MB |
| Events in quadrant A | 3,563,611 | 654,179 |
| Events in quadrant B | 3,907,530 | 656,951 |
| Events in quadrant C | 3,470,280 | 628,763 |
| Events in quadrant D | 5,195,865 | 600,466 |
| Mode M9 | |||
|---|---|---|---|
| Quadrant | BADHDUFLAG | Total packets | Discarded packets |
| A | 0 | 9 | 0 |
| B | 0 | 9 | 0 |
| C | 0 | 9 | 0 |
| D | 0 | 9 | 0 |
| Mode M0 | |||
|---|---|---|---|
| Quadrant | BADHDUFLAG | Total packets | Discarded packets |
| A | 0 | 15164 | 0 |
| B | 0 | 16151 | 0 |
| C | 0 | 14857 | 0 |
| D | 0 | 20219 | 0 |
| Quadrant | Total seconds | Saturated seconds | Saturation percentage |
|---|---|---|---|
| A | 7103 | 65 | 0.915106% |
| B | 7104 | 213 | 2.998311% |
| C | 7104 | 107 | 1.506194% |
| D | 7104 | 402 | 5.658784% |
Noise dominated data is calculated using 1-second bins in cleaned event files. If a bin has >2000 counts, and if more than 50% of those come from <1% of pixels, then it is considered to be noise-dominated and hence unusable.
| Quadrant | # 1 sec bins | Bins with >0 counts | Bins with >2000 counts | High rate bins dominated by noise | Noise dominated (total time) | Noise dominated (detector-on time) | Marked lightcurve |
|---|---|---|---|---|---|---|---|
| A | 7918 | 7105 | 7 | 7 | 0.09% | 0.10% | 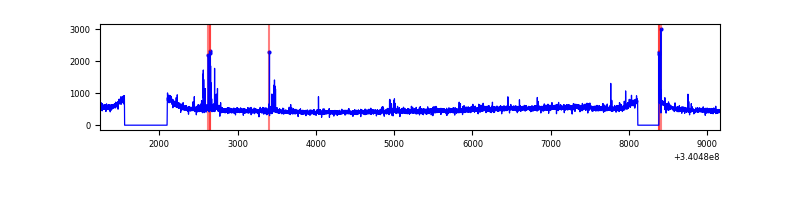 |
| B | 7919 | 7106 | 56 | 56 | 0.71% | 0.79% | 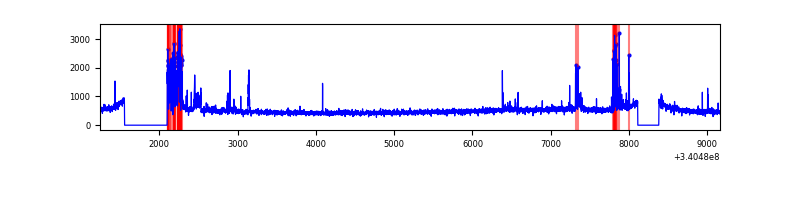 |
| C | 7919 | 7106 | 0 | 0 | 0.00% | 0.00% | 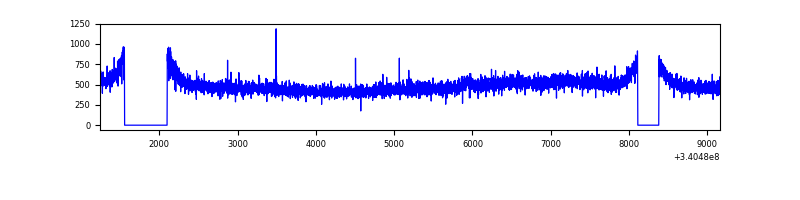 |
| D | 7919 | 7106 | 285 | 285 | 3.60% | 4.01% | 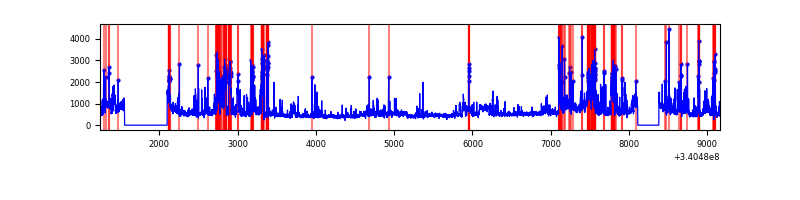 |
Top three noisy pixels from each quadrant. If the there are fewer than three noisy pixels in the level2.evt file, extra rows are filled as -1
| Pixel properties | Quadrant properties | ||||||
|---|---|---|---|---|---|---|---|
| Quadrant | DetID | PixID | Counts | Sigma | Mean | Median | Sigma |
| A | 13 | 248 | 65342 | 355.18 | 898 | 882 | 181.5 |
| A | 14 | 235 | 13943 | 71.97 | 898 | 882 | 181.5 |
| A | 13 | 254 | 11867 | 60.53 | 898 | 882 | 181.5 |
| B | 5 | 172 | 305820 | 1788.68 | 886 | 864 | 170.5 |
| B | 0 | 190 | 57907 | 334.58 | 886 | 864 | 170.5 |
| B | 10 | 247 | 30231 | 172.25 | 886 | 864 | 170.5 |
| C | 14 | 238 | 134246 | 657.36 | 853 | 856 | 202.9 |
| C | 8 | 208 | 6538 | 28.0 | 853 | 856 | 202.9 |
| C | 13 | 61 | 6043 | 25.56 | 853 | 856 | 202.9 |
| D | 1 | 52 | 1581203 | 7477.79 | 847 | 827 | 211.3 |
| D | 2 | 250 | 178529 | 840.82 | 847 | 827 | 211.3 |
| D | 12 | 233 | 84085 | 393.95 | 847 | 827 | 211.3 |
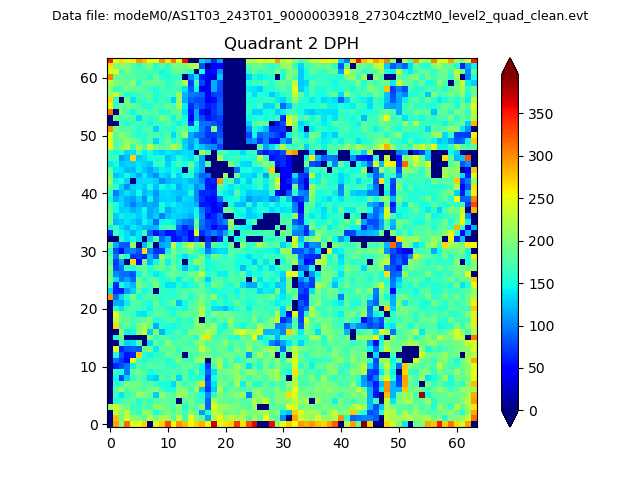
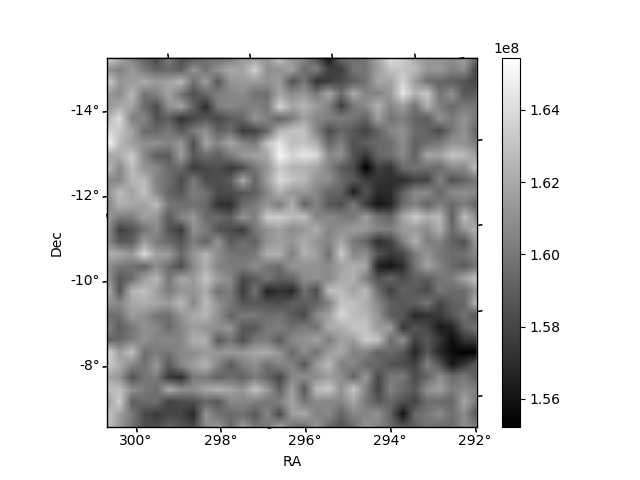
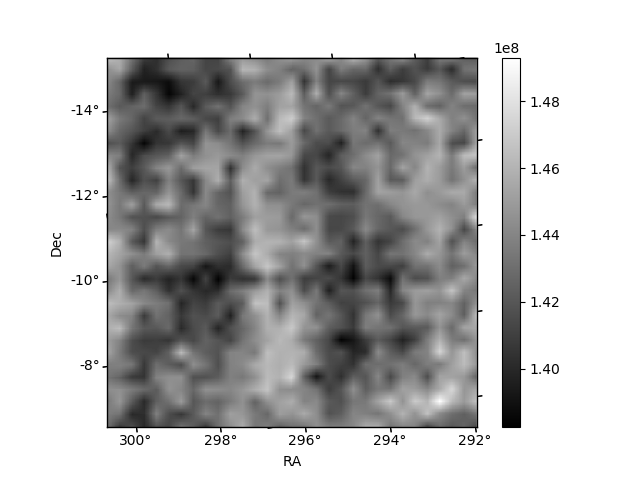
Histogram calculated using DETX and DETY for each event in the final _common_clean file
| Quadrant A | 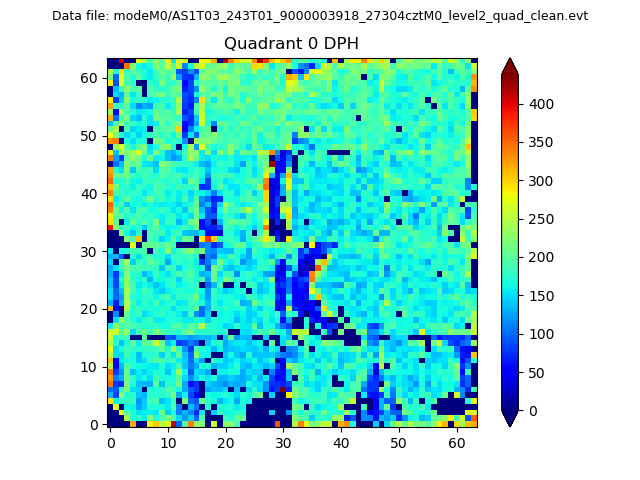 |
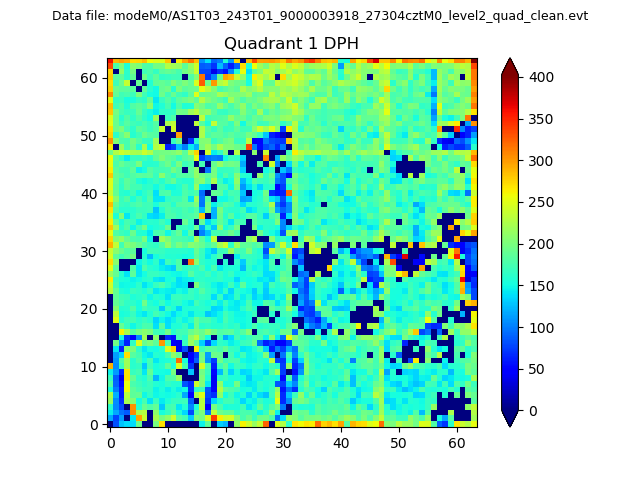 |
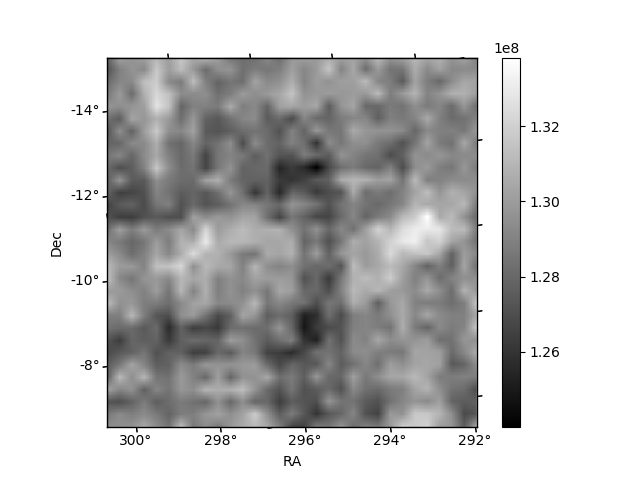
Quadrant B |
|---|---|---|---|
| Quadrant D | 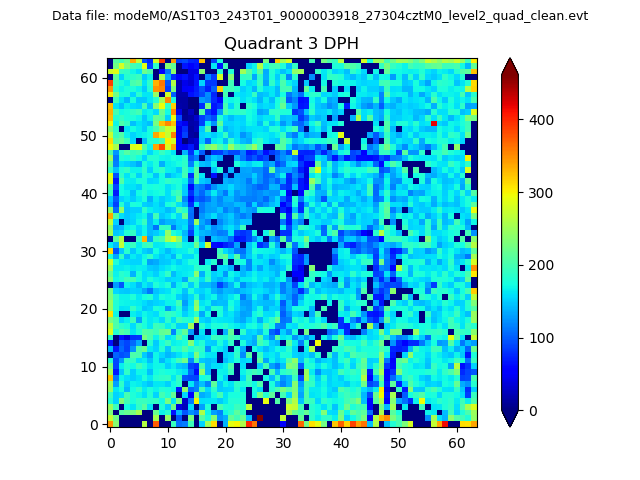 |
 |
Quadrant C |
| Plot type | Count rate plots | Images |
|---|---|---|
| Comparison with Poisson distribution Blue bars denote a histogram of data divided into 1 sec bins. Red curve is a Poisson curve with rate = median count rate of data. |
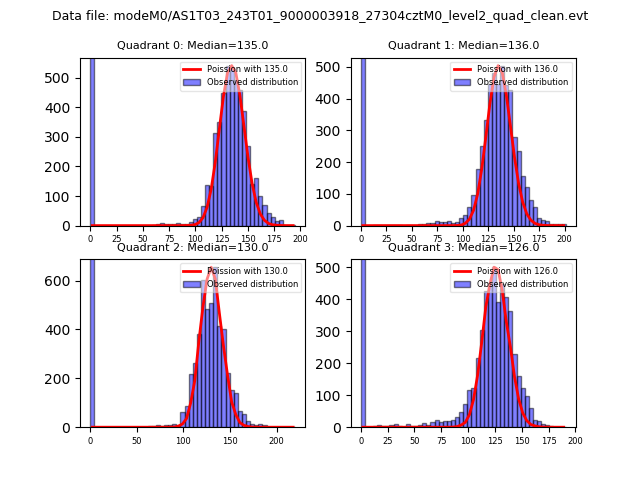 |
 |
| Quadrant-wise count rates Data is divided into 100 sec bins |
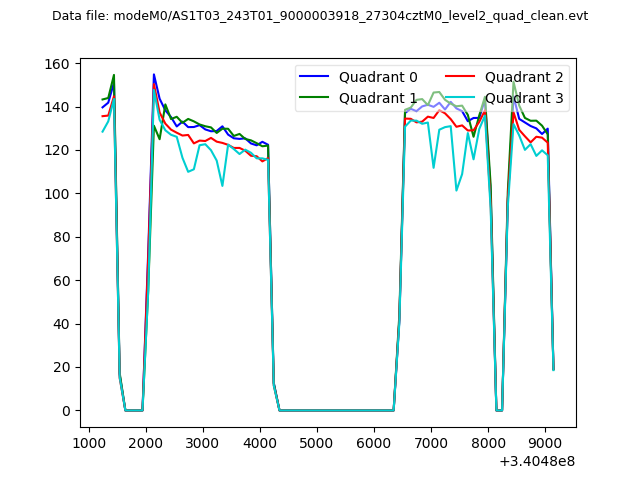 |
|
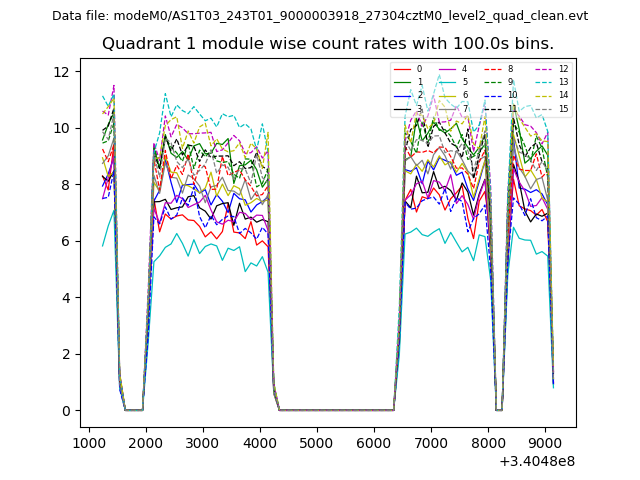
| Module-wise count rates for Quadrant A Data is divided into 100 sec bins |
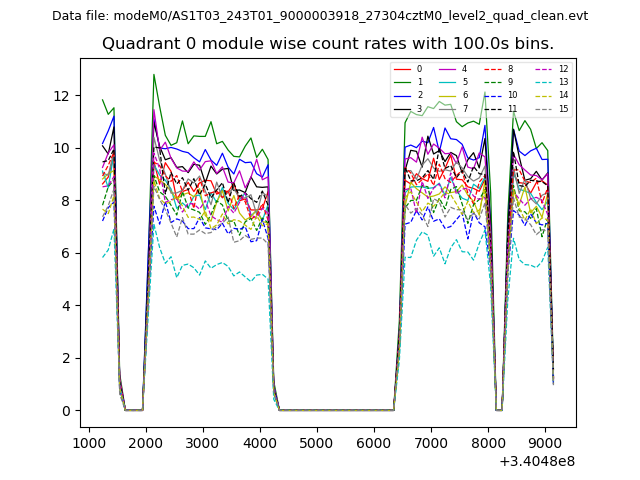 |
 |
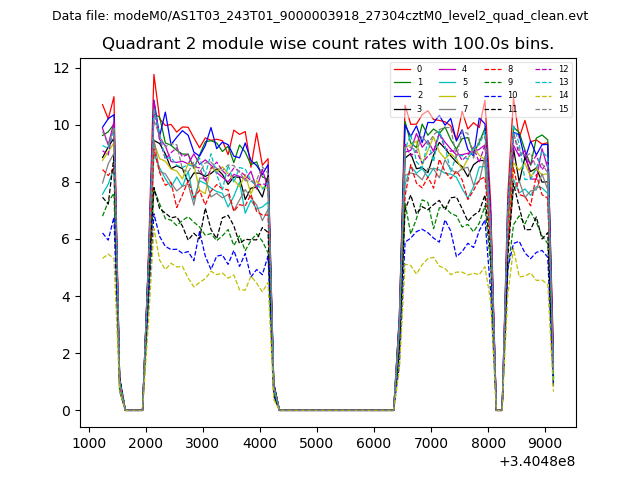
| Module-wise count rates for Quadrant B Data is divided into 100 sec bins |
 |
 |
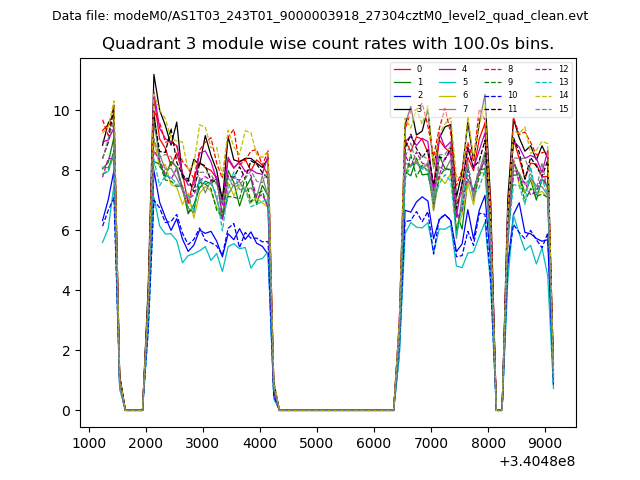
| Module-wise count rates for Quadrant C Data is divided into 100 sec bins |
 |
 |
| Module-wise count rates for Quadrant D Data is divided into 100 sec bins |
 |
 |
| Parameter | Plot |
|---|---|
| CZT HV Monitor | 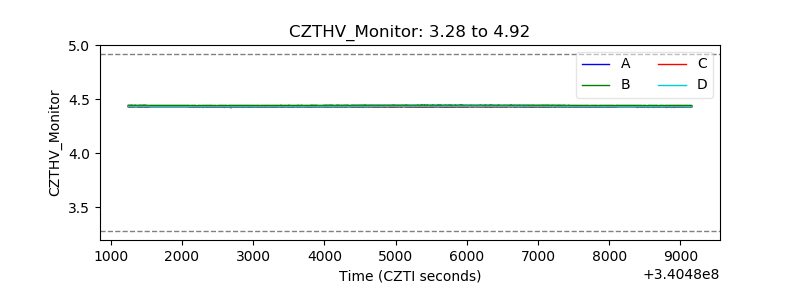 |
| D_VDD | 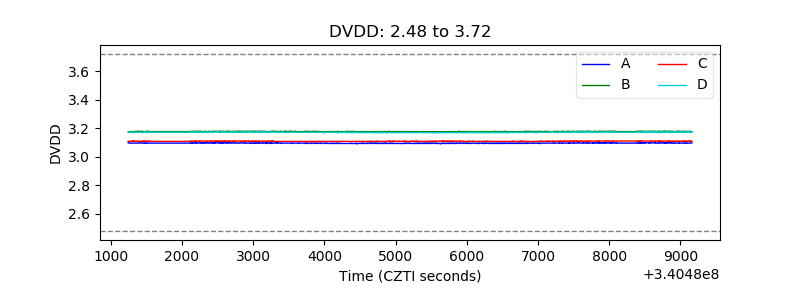 |
| Temperature 1 | 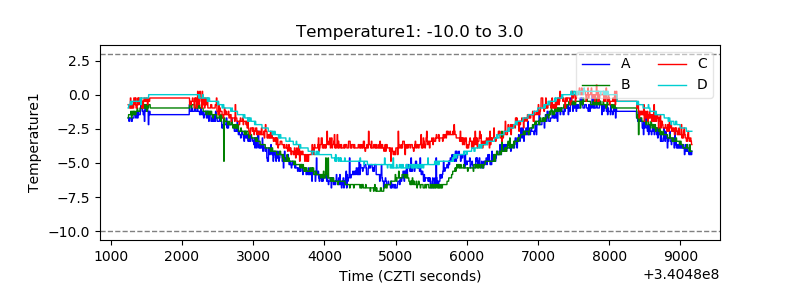 |
| Veto HV Monitor | 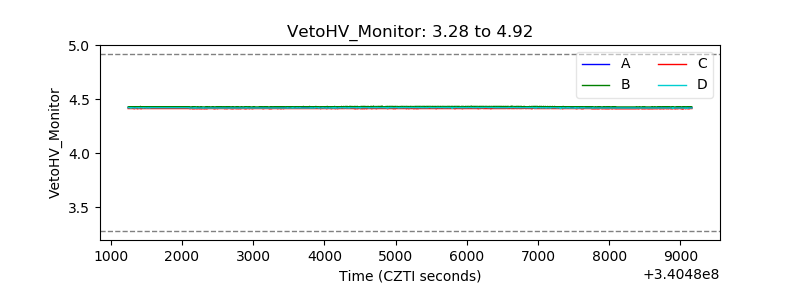 |
| Veto LLD | 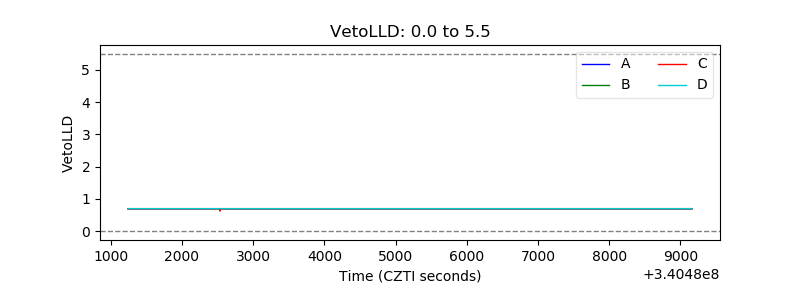 |
| Alpha Counter | 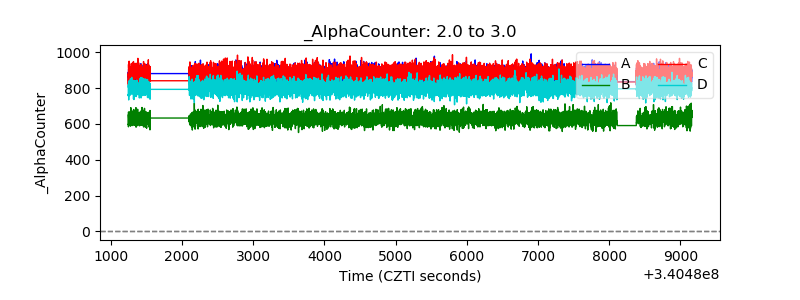 |
| _CPM_Rate | 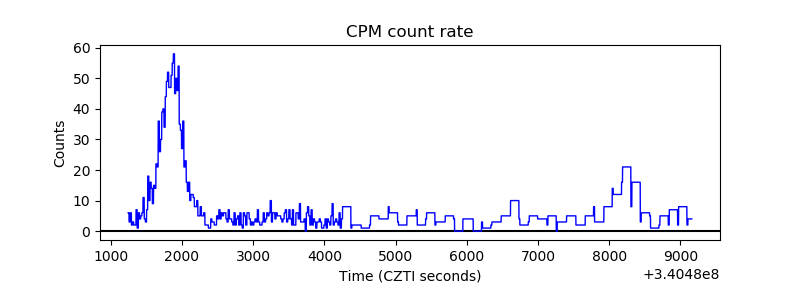 |
| CZT Counter |  |
| +2.5 Volts monitor |  |
| +5 Volts monitor | 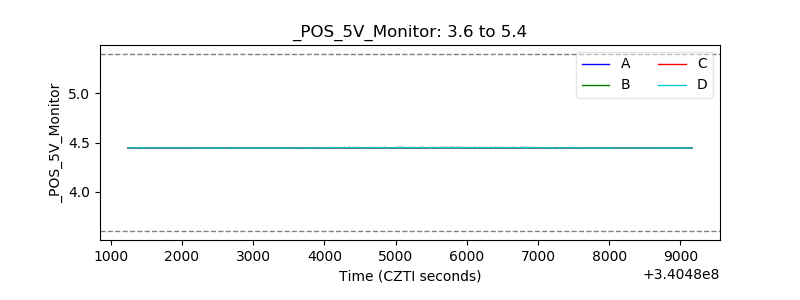 |
| _ROLL_ROT | 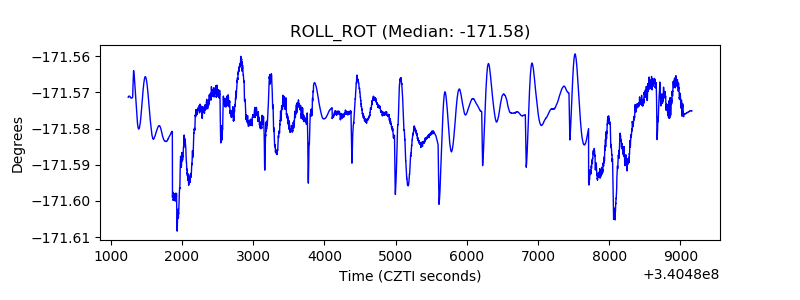 |
| _Roll_DEC | 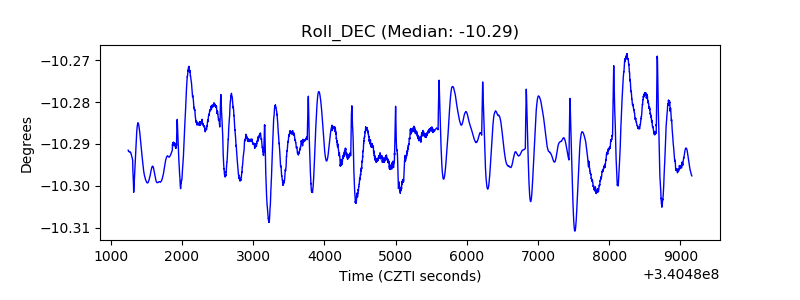 |
| _Roll_RA |  |
| Veto Counter | 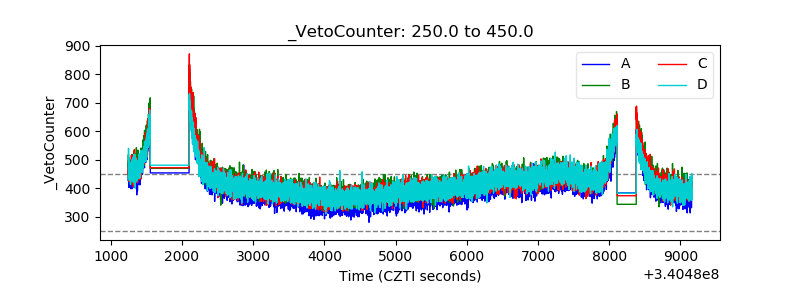 |