| Param | Original file | Final file |
|---|---|---|
| Filename | modeM0/AS1T03_243T01_9000003918_27305cztM0_level2.evt | modeM0/AS1T03_243T01_9000003918_27305cztM0_level2_quad_clean.evt |
| Size (bytes) | 108,705,600 | 25,346,880 |
| Size | 103.7 MB | 24.2 MB |
| Events in quadrant A | 687,252 | 171,848 |
| Events in quadrant B | 780,262 | 174,536 |
| Events in quadrant C | 662,410 | 166,246 |
| Events in quadrant D | 1,073,480 | 159,403 |
| Mode M9 | |||
|---|---|---|---|
| Quadrant | BADHDUFLAG | Total packets | Discarded packets |
| A | 0 | 3 | 0 |
| B | 0 | 3 | 0 |
| C | 0 | 3 | 0 |
| D | 0 | 3 | 0 |
| Mode M0 | |||
|---|---|---|---|
| Quadrant | BADHDUFLAG | Total packets | Discarded packets |
| A | 0 | 2861 | 0 |
| B | 0 | 3152 | 0 |
| C | 0 | 2784 | 0 |
| D | 0 | 4077 | 0 |
| Quadrant | Total seconds | Saturated seconds | Saturation percentage |
|---|---|---|---|
| A | 1269 | 22 | 1.733649% |
| B | 1270 | 56 | 4.409449% |
| C | 1270 | 27 | 2.125984% |
| D | 1270 | 87 | 6.850394% |
Noise dominated data is calculated using 1-second bins in cleaned event files. If a bin has >2000 counts, and if more than 50% of those come from <1% of pixels, then it is considered to be noise-dominated and hence unusable.
| Quadrant | # 1 sec bins | Bins with >0 counts | Bins with >2000 counts | High rate bins dominated by noise | Noise dominated (total time) | Noise dominated (detector-on time) | Marked lightcurve |
|---|---|---|---|---|---|---|---|
| A | 1539 | 1270 | 3 | 3 | 0.19% | 0.24% | 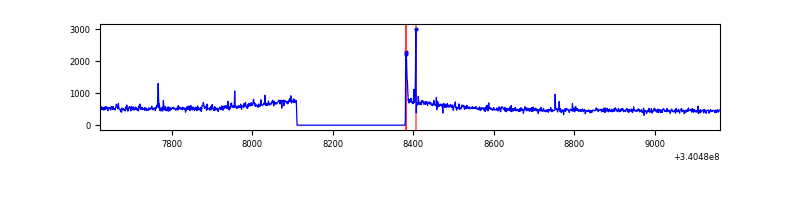 |
| B | 1540 | 1271 | 12 | 12 | 0.78% | 0.94% | 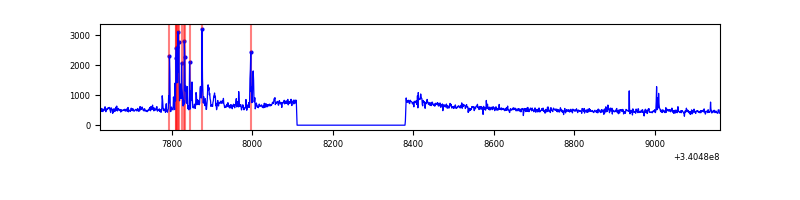 |
| C | 1540 | 1271 | 0 | 0 | 0.00% | 0.00% | 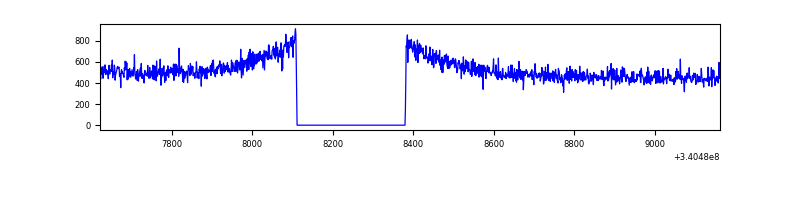 |
| D | 1540 | 1271 | 54 | 54 | 3.51% | 4.25% | 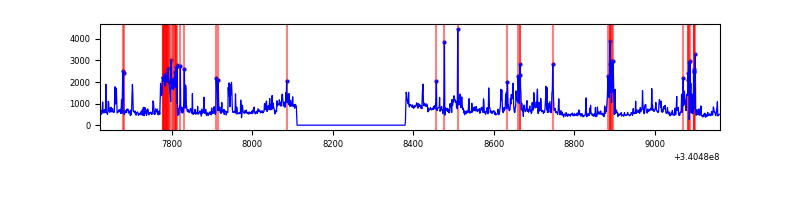 |
Top three noisy pixels from each quadrant. If the there are fewer than three noisy pixels in the level2.evt file, extra rows are filled as -1
| Pixel properties | Quadrant properties | ||||||
|---|---|---|---|---|---|---|---|
| Quadrant | DetID | PixID | Counts | Sigma | Mean | Median | Sigma |
| A | 13 | 248 | 11537 | 305.17 | 172 | 168 | 37.3 |
| A | 8 | 192 | 8144 | 214.09 | 172 | 168 | 37.3 |
| A | 13 | 254 | 2313 | 57.58 | 172 | 168 | 37.3 |
| B | 5 | 172 | 83404 | 2335.28 | 171 | 166 | 35.6 |
| B | 0 | 190 | 14637 | 405.99 | 171 | 166 | 35.6 |
| B | 0 | 229 | 5519 | 150.18 | 171 | 166 | 35.6 |
| C | 14 | 238 | 25152 | 621.57 | 163 | 163 | 40.2 |
| C | 13 | 61 | 1157 | 24.72 | 163 | 163 | 40.2 |
| C | 8 | 208 | 726 | 14.0 | 163 | 163 | 40.2 |
| D | 1 | 52 | 226650 | 5279.26 | 163 | 158 | 42.9 |
| D | 2 | 250 | 82515 | 1919.64 | 163 | 158 | 42.9 |
| D | 12 | 233 | 61489 | 1429.55 | 163 | 158 | 42.9 |
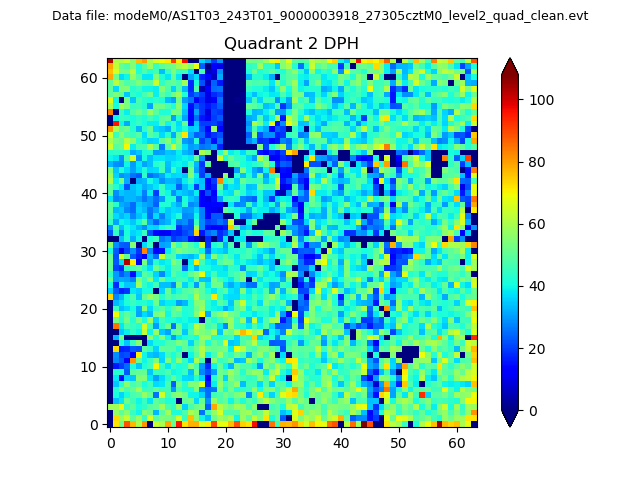
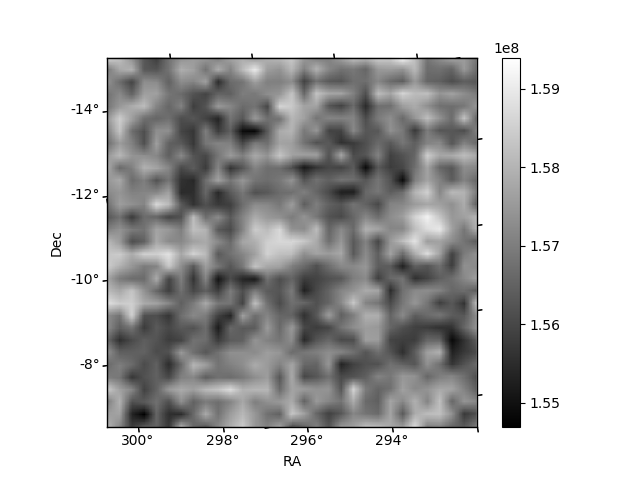
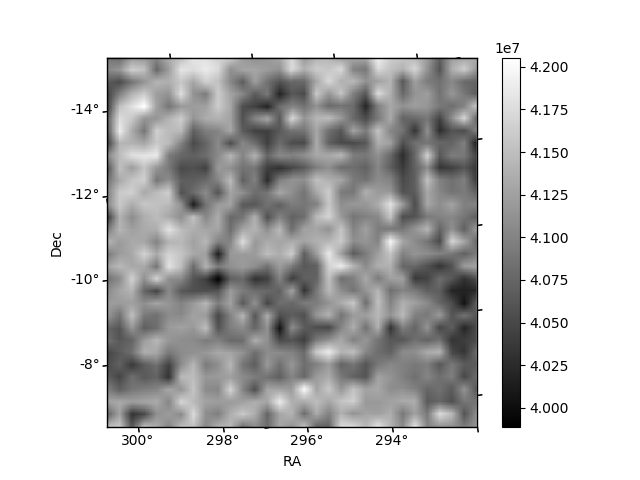
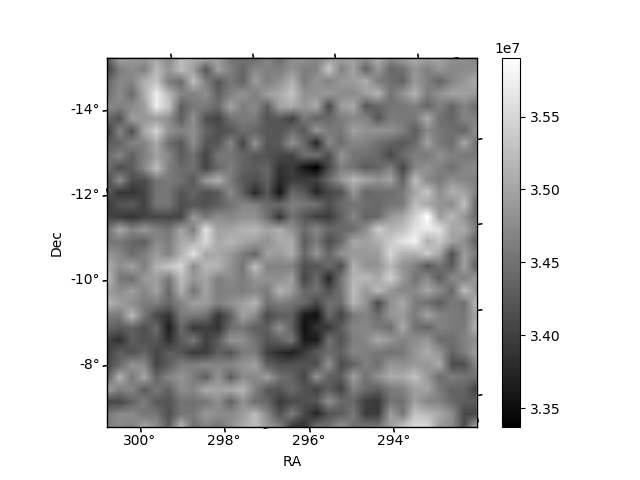
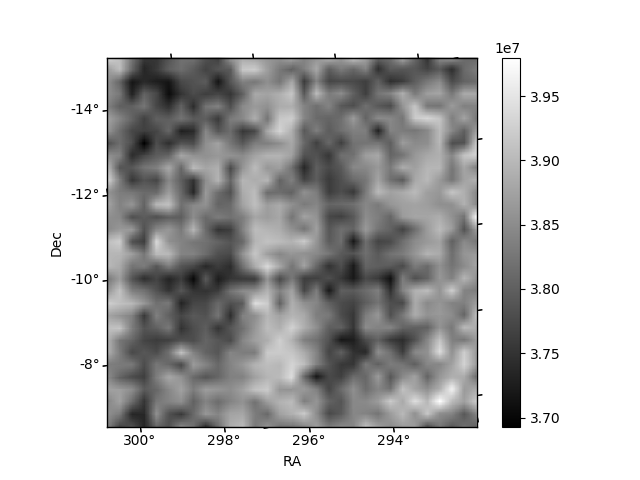
Histogram calculated using DETX and DETY for each event in the final _common_clean file
| Quadrant A | 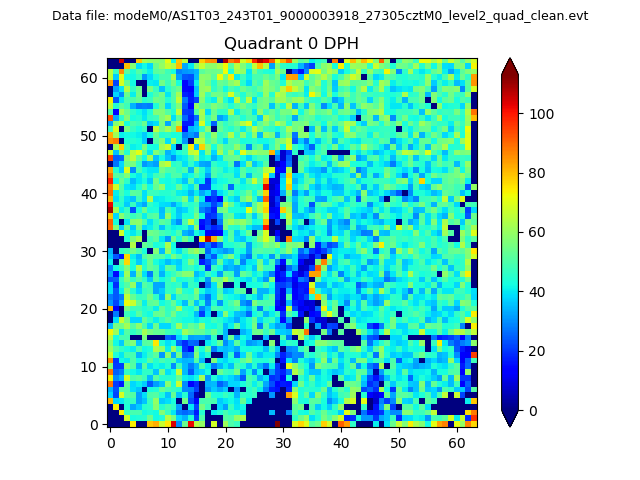 |
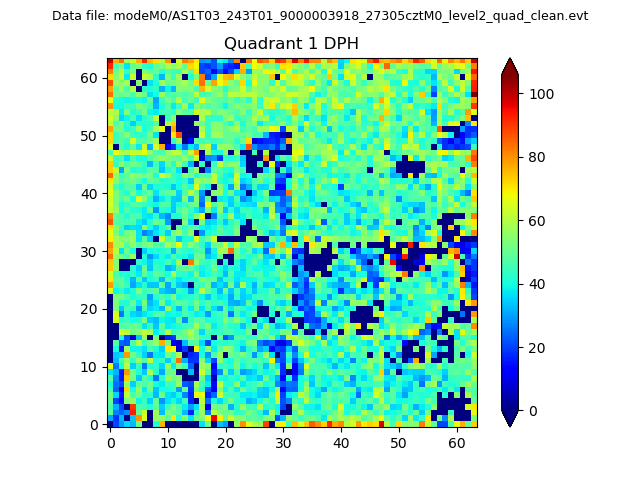 |
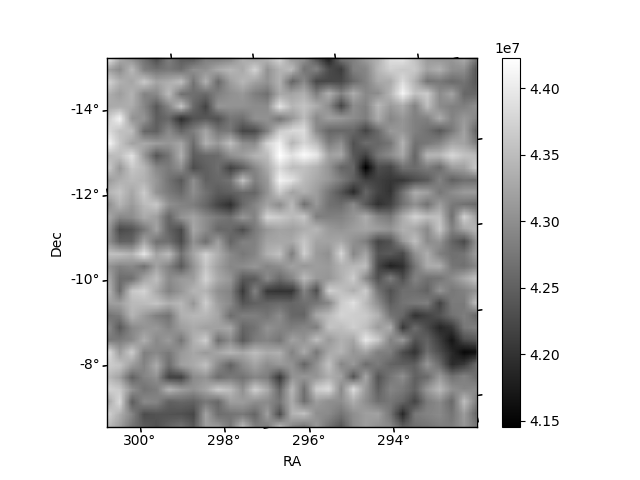
Quadrant B |
|---|---|---|---|
| Quadrant D | 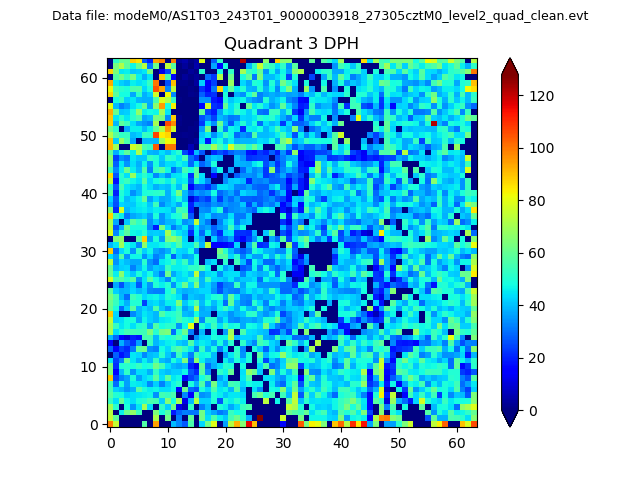 |
 |
Quadrant C |
| Plot type | Count rate plots | Images |
|---|---|---|
| Comparison with Poisson distribution Blue bars denote a histogram of data divided into 1 sec bins. Red curve is a Poisson curve with rate = median count rate of data. |
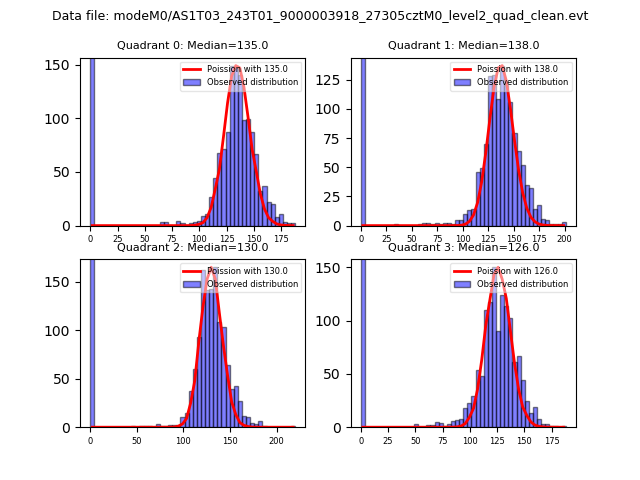 |
 |
| Quadrant-wise count rates Data is divided into 100 sec bins |
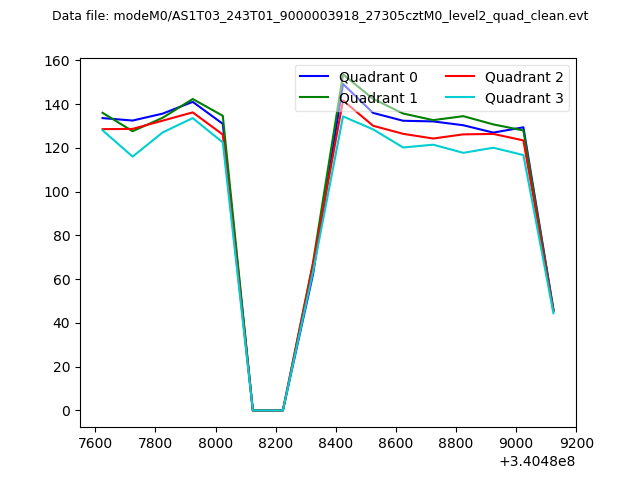 |
|
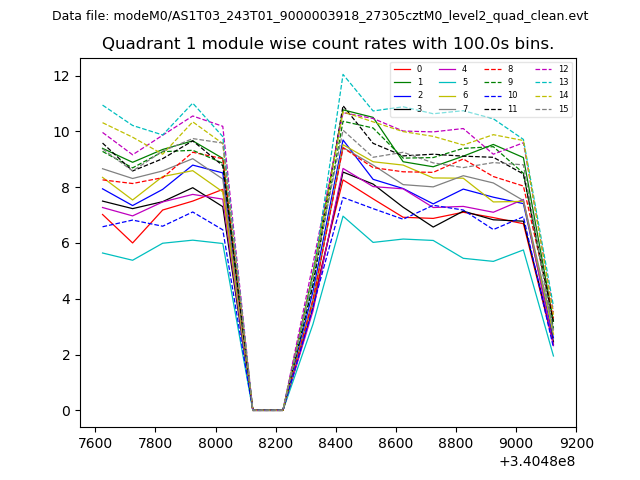
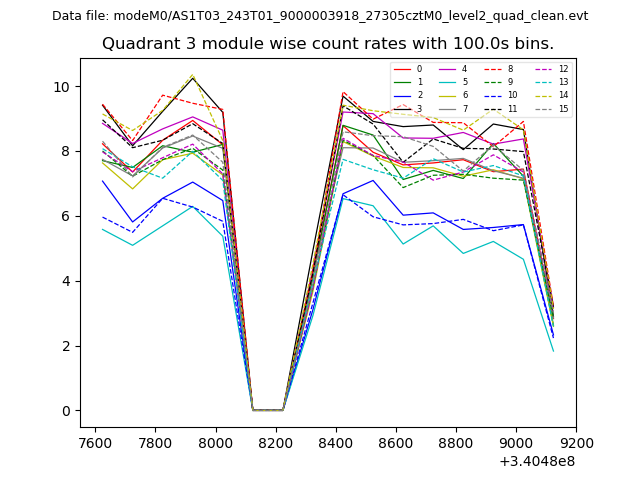
| Module-wise count rates for Quadrant A Data is divided into 100 sec bins |
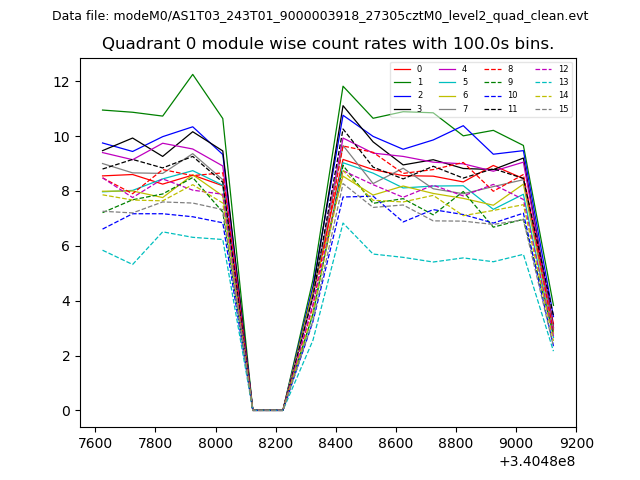 |
 |
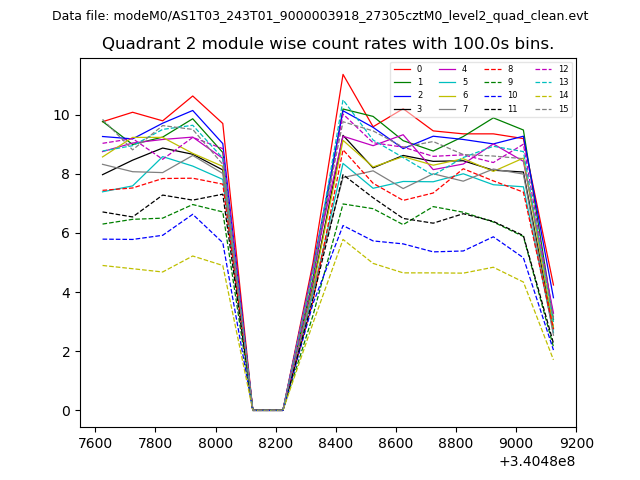
| Module-wise count rates for Quadrant B Data is divided into 100 sec bins |
 |
 |
| Module-wise count rates for Quadrant C Data is divided into 100 sec bins |
 |
 |
| Module-wise count rates for Quadrant D Data is divided into 100 sec bins |
 |
 |
| Parameter | Plot |
|---|---|
| CZT HV Monitor | 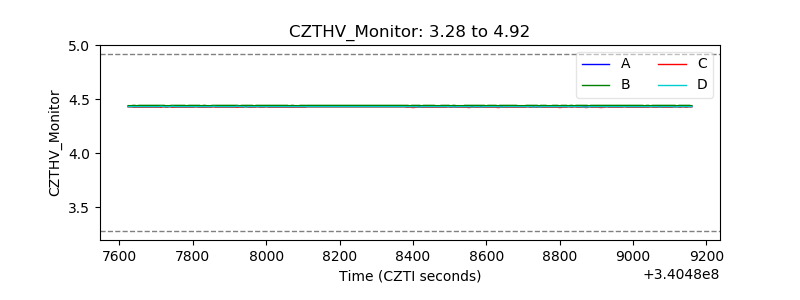 |
| D_VDD | 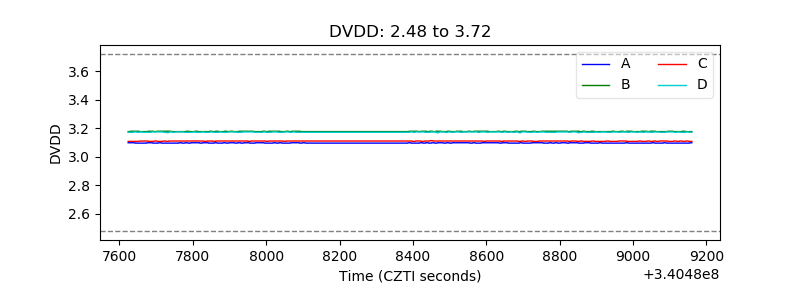 |
| Temperature 1 | 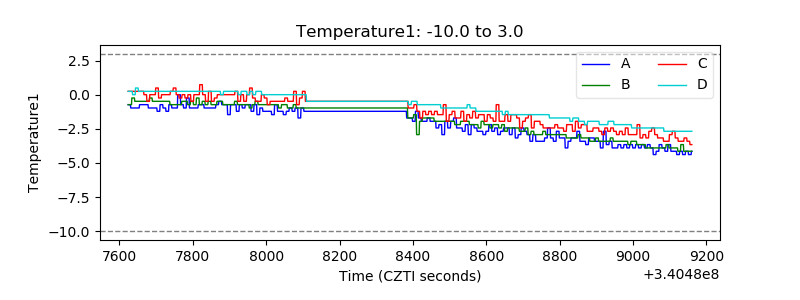 |
| Veto HV Monitor | 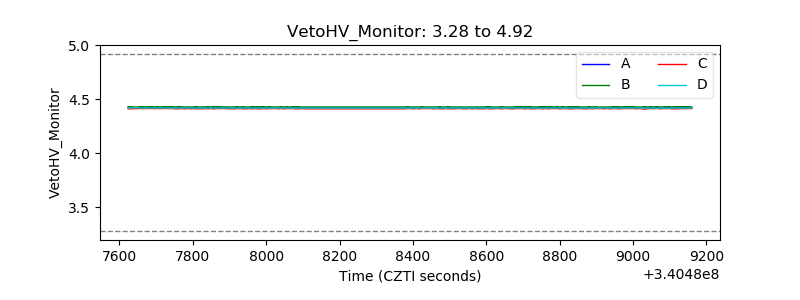 |
| Veto LLD | 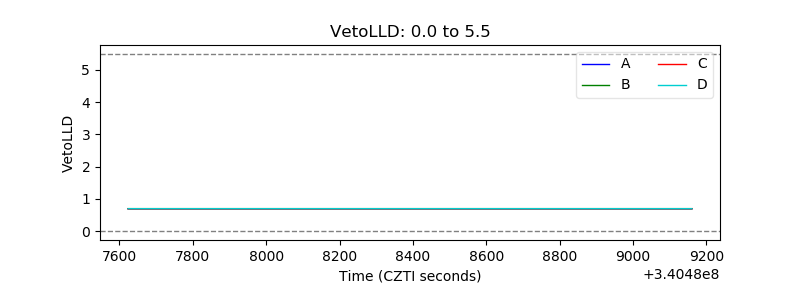 |
| Alpha Counter | 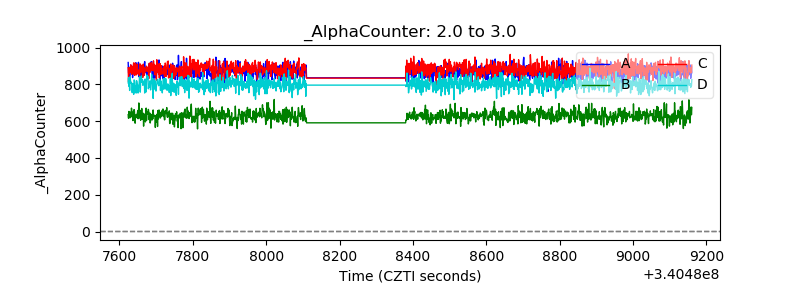 |
| _CPM_Rate | 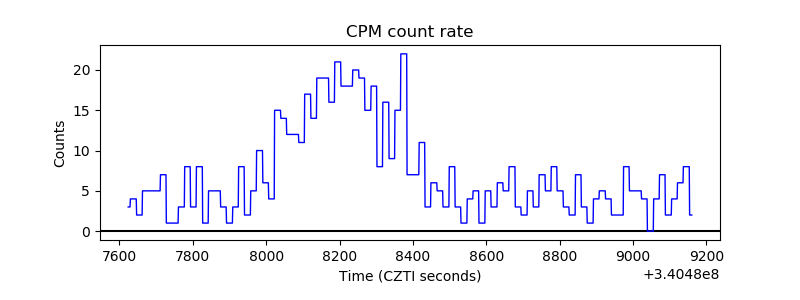 |
| CZT Counter | 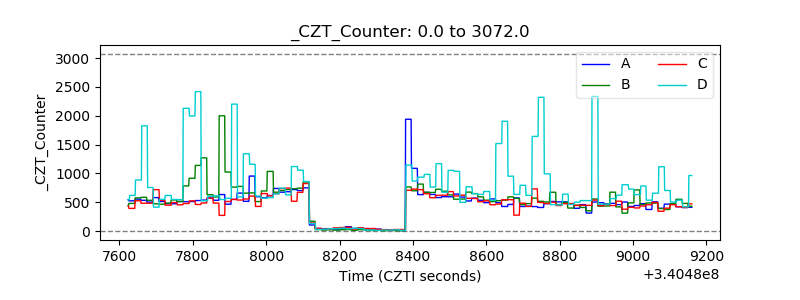 |
| +2.5 Volts monitor |  |
| +5 Volts monitor | 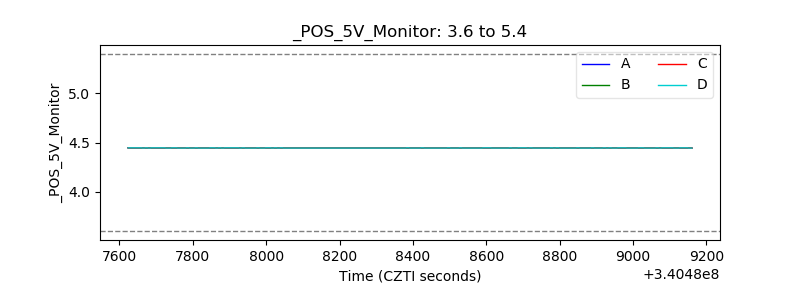 |
| _ROLL_ROT | 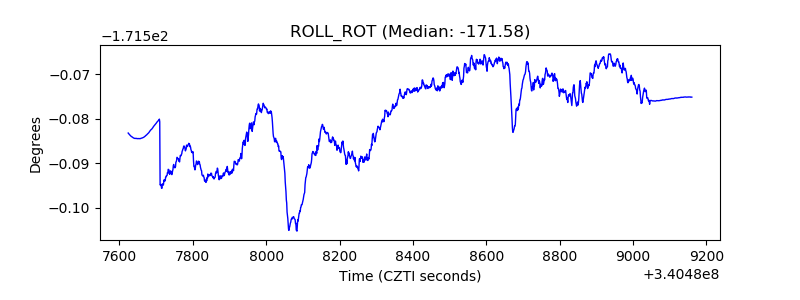 |
| _Roll_DEC | 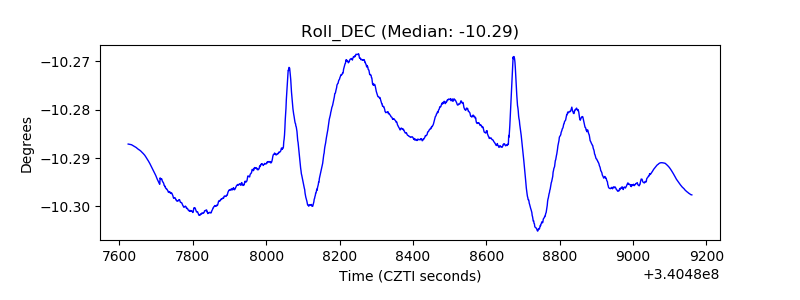 |
| _Roll_RA | 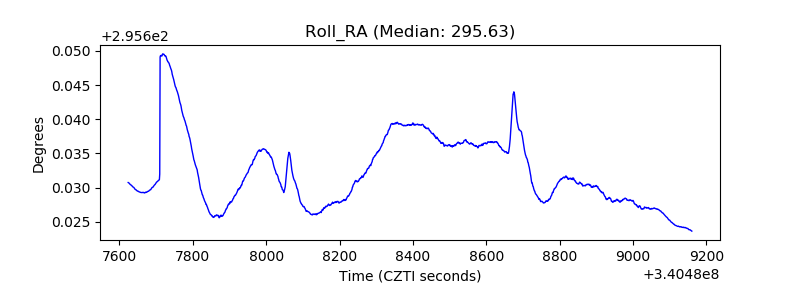 |
| Veto Counter | 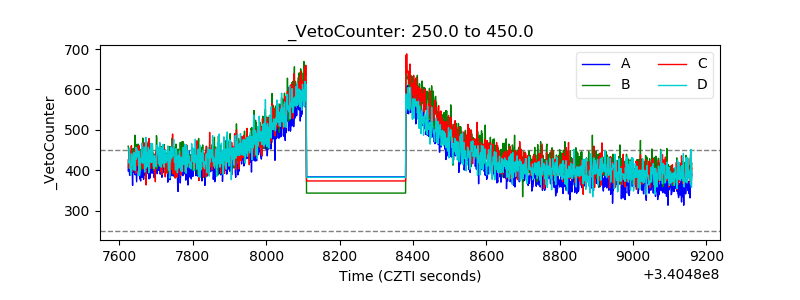 |