| Param | Original file | Final file |
|---|---|---|
| Filename | modeM0/AS1C05_013T06_9000003920cztM0_level2.fits | modeM0/AS1C05_013T06_9000003920cztM0_level2_quad_clean.evt |
| Size (bytes) | 195,454,080 | 266,388,480 |
| Size | 186.4 MB | 254.0 MB |
| Events in quadrant A | 1,189,980 | 1,729,148 |
| Events in quadrant B | 1,137,082 | 1,737,225 |
| Events in quadrant C | 1,150,240 | 1,663,080 |
| Events in quadrant D | 996,184 | 1,492,728 |
| Mode M0 | |||
|---|---|---|---|
| Quadrant | BADHDUFLAG | Total packets | Discarded packets |
| A | 0 | 42950 | 0 |
| B | 0 | 44297 | 0 |
| C | 0 | 42905 | 0 |
| D | 0 | 60656 | 0 |
| Mode M9 | |||
|---|---|---|---|
| Quadrant | BADHDUFLAG | Total packets | Discarded packets |
| A | 0 | 14 | 0 |
| B | 0 | 14 | 0 |
| C | 0 | 14 | 0 |
| D | 0 | 14 | 0 |
| Mode SS | |||
|---|---|---|---|
| Quadrant | BADHDUFLAG | Total packets | Discarded packets |
| A | 0 | 426 | 0 |
| B | 0 | 426 | 0 |
| C | 0 | 426 | 0 |
| D | 0 | 426 | 0 |
| Quadrant | Total seconds | Saturated seconds | Saturation percentage |
|---|---|---|---|
| A | 20997 | 69 | 0.328618% |
| B | 20997 | 210 | 1.000143% |
| C | 20997 | 201 | 0.957280% |
| D | 20997 | 951 | 4.529218% |
Noise dominated data is calculated using 1-second bins in cleaned event files. If a bin has >2000 counts, and if more than 50% of those come from <1% of pixels, then it is considered to be noise-dominated and hence unusable.
| Quadrant | # 1 sec bins | Bins with >0 counts | Bins with >2000 counts | High rate bins dominated by noise | Noise dominated (total time) | Noise dominated (detector-on time) | Marked lightcurve |
|---|---|---|---|---|---|---|---|
| A | 22447 | 20995 | 0 | 0 | 0.00% | 0.00% |  |
| B | 22447 | 20996 | 0 | 0 | 0.00% | 0.00% |  |
| C | 22447 | 20996 | 0 | 0 | 0.00% | 0.00% |  |
| D | 22447 | 20994 | 0 | 0 | 0.00% | 0.00% | 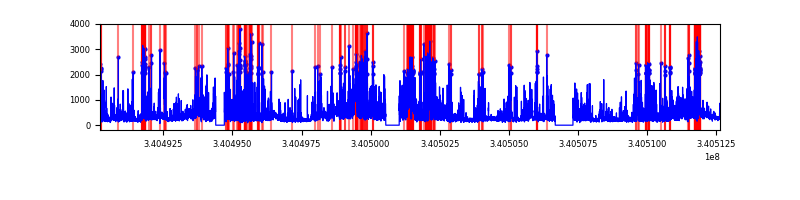 |
Top three noisy pixels from each quadrant. If the there are fewer than three noisy pixels in the level2.evt file, extra rows are filled as -1
| Pixel properties | Quadrant properties | ||||||
|---|---|---|---|---|---|---|---|
| Quadrant | DetID | PixID | Counts | Sigma | Mean | Median | Sigma |
| A | 0 | 29 | 1154 | 11.22 | 310 | 292 | 76.8 |
| A | 7 | 110 | 892 | 7.81 | 310 | 292 | 76.8 |
| A | 14 | 79 | 888 | 7.76 | 310 | 292 | 76.8 |
| B | 2 | 9 | 912 | 10.43 | 300 | 286 | 60.0 |
| B | 3 | 17 | 787 | 8.34 | 300 | 286 | 60.0 |
| B | 14 | 254 | 750 | 7.73 | 300 | 286 | 60.0 |
| C | 12 | 241 | 904 | 7.93 | 304 | 285 | 78.1 |
| C | 2 | 191 | 802 | 6.62 | 304 | 285 | 78.1 |
| C | 9 | 233 | 780 | 6.34 | 304 | 285 | 78.1 |
| D | 3 | 14 | 784 | 6.85 | 283 | 258 | 76.8 |
| D | 4 | 246 | 756 | 6.49 | 283 | 258 | 76.8 |
| D | 6 | 38 | 751 | 6.42 | 283 | 258 | 76.8 |
Histogram calculated using DETX and DETY for each event in the final _common_clean file
| Quadrant A |  |
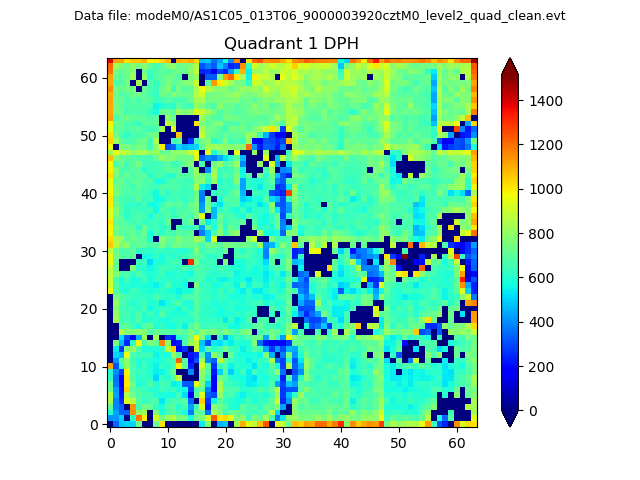 |
Quadrant B |
|---|---|---|---|
| Quadrant D | 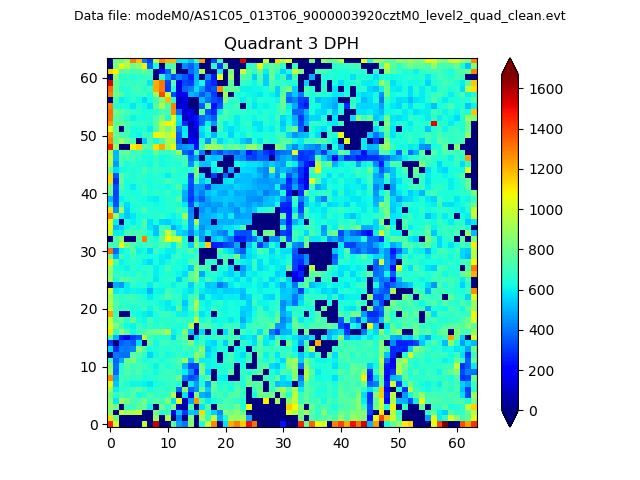 |
 |
Quadrant C |
| Plot type | Count rate plots | Images |
|---|---|---|
| Comparison with Poisson distribution Blue bars denote a histogram of data divided into 1 sec bins. Red curve is a Poisson curve with rate = median count rate of data. |
 |
 |
| Quadrant-wise count rates Data is divided into 100 sec bins |
 |
|
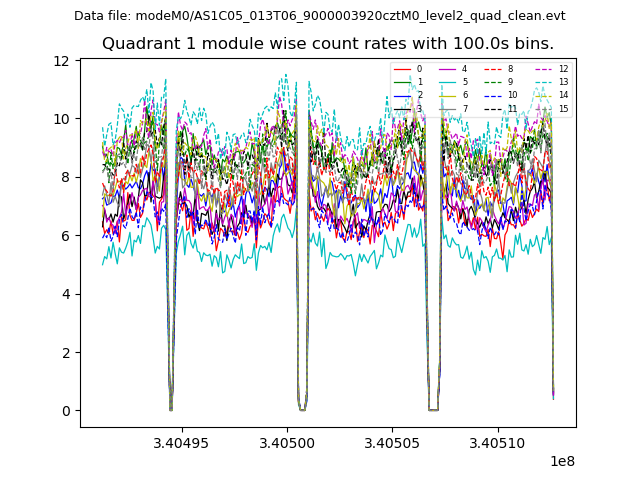
| Module-wise count rates for Quadrant A Data is divided into 100 sec bins |
 |
 |
| Module-wise count rates for Quadrant B Data is divided into 100 sec bins |
 |
 |
| Module-wise count rates for Quadrant C Data is divided into 100 sec bins |
 |
 |
| Module-wise count rates for Quadrant D Data is divided into 100 sec bins |
 |
 |
| Parameter | Plot |
|---|---|
| CZT HV Monitor |  |
| D_VDD |  |
| Temperature 1 | 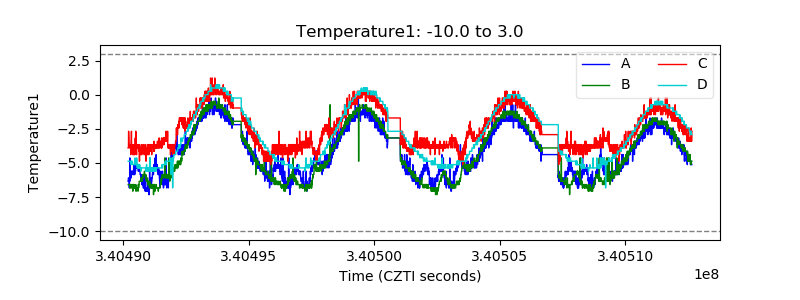 |
| Veto HV Monitor |  |
| Veto LLD |  |
| Alpha Counter |  |
| _CPM_Rate |  |
| CZT Counter |  |
| +2.5 Volts monitor |  |
| +5 Volts monitor |  |
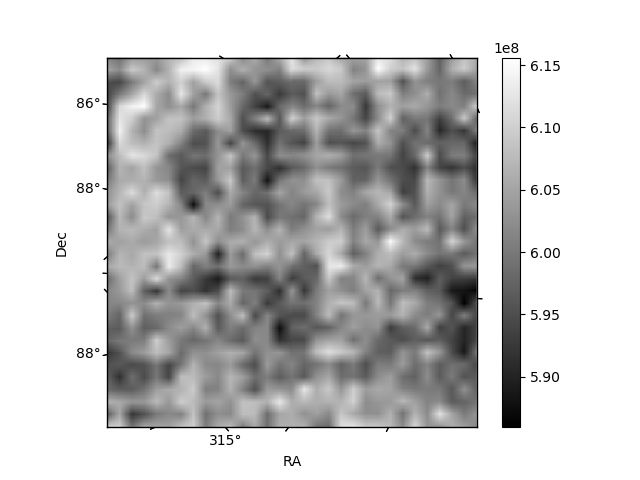
| _ROLL_ROT |  |
| _Roll_DEC |  |
| _Roll_RA |  |
| Veto Counter |  |