| Param | Original file | Final file |
|---|---|---|
| Filename | modeM0/AS1C05_013T06_9000003920_27305cztM0_level2.evt | modeM0/AS1C05_013T06_9000003920_27305cztM0_level2_quad_clean.evt |
| Size (bytes) | 422,208,000 | 105,393,600 |
| Size | 402.6 MB | 100.5 MB |
| Events in quadrant A | 2,640,396 | 711,558 |
| Events in quadrant B | 2,931,065 | 713,534 |
| Events in quadrant C | 2,680,291 | 695,446 |
| Events in quadrant D | 4,146,444 | 672,057 |
| Mode M0 | |||
|---|---|---|---|
| Quadrant | BADHDUFLAG | Total packets | Discarded packets |
| A | 0 | 11793 | 0 |
| B | 0 | 12648 | 0 |
| C | 0 | 11801 | 0 |
| D | 0 | 16259 | 0 |
| Mode M9 | |||
|---|---|---|---|
| Quadrant | BADHDUFLAG | Total packets | Discarded packets |
| A | 0 | 3 | 0 |
| B | 0 | 3 | 0 |
| C | 0 | 3 | 0 |
| D | 0 | 3 | 0 |
| Quadrant | Total seconds | Saturated seconds | Saturation percentage |
|---|---|---|---|
| A | 5711 | 25 | 0.437752% |
| B | 5711 | 135 | 2.363859% |
| C | 5711 | 71 | 1.243215% |
| D | 5711 | 320 | 5.603222% |
Noise dominated data is calculated using 1-second bins in cleaned event files. If a bin has >2000 counts, and if more than 50% of those come from <1% of pixels, then it is considered to be noise-dominated and hence unusable.
| Quadrant | # 1 sec bins | Bins with >0 counts | Bins with >2000 counts | High rate bins dominated by noise | Noise dominated (total time) | Noise dominated (detector-on time) | Marked lightcurve |
|---|---|---|---|---|---|---|---|
| A | 6026 | 5712 | 0 | 0 | 0.00% | 0.00% | 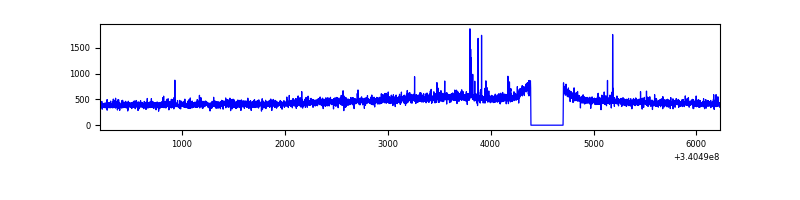 |
| B | 6026 | 5712 | 40 | 40 | 0.66% | 0.70% | 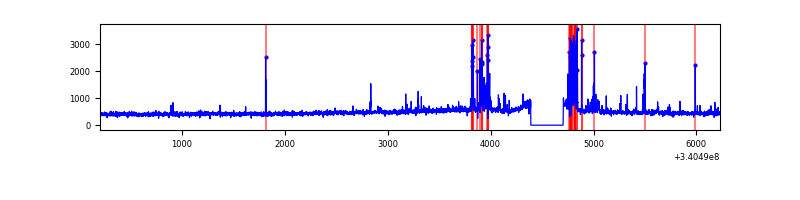 |
| C | 6026 | 5712 | 3 | 3 | 0.05% | 0.05% | 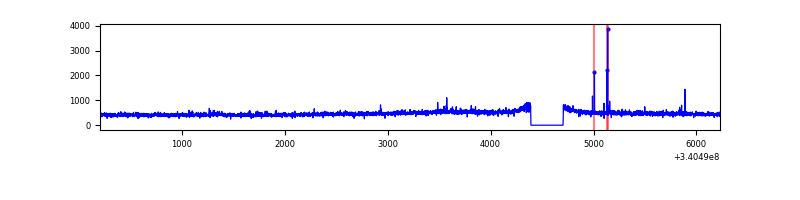 |
| D | 6026 | 5712 | 240 | 240 | 3.98% | 4.20% | 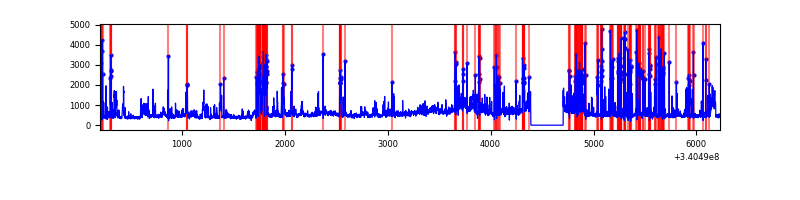 |
Top three noisy pixels from each quadrant. If the there are fewer than three noisy pixels in the level2.evt file, extra rows are filled as -1
| Pixel properties | Quadrant properties | ||||||
|---|---|---|---|---|---|---|---|
| Quadrant | DetID | PixID | Counts | Sigma | Mean | Median | Sigma |
| A | 13 | 248 | 21722 | 152.74 | 676 | 663 | 137.9 |
| A | 13 | 254 | 9693 | 65.5 | 676 | 663 | 137.9 |
| A | 3 | 137 | 6377 | 41.44 | 676 | 663 | 137.9 |
| B | 5 | 172 | 178312 | 1395.89 | 670 | 653 | 127.3 |
| B | 10 | 247 | 36555 | 282.08 | 670 | 653 | 127.3 |
| B | 10 | 245 | 35636 | 274.86 | 670 | 653 | 127.3 |
| C | 14 | 238 | 103954 | 669.09 | 652 | 654 | 154.4 |
| C | 2 | 16 | 27722 | 175.32 | 652 | 654 | 154.4 |
| C | 15 | 208 | 6420 | 37.35 | 652 | 654 | 154.4 |
| D | 1 | 52 | 1322213 | 8314.68 | 642 | 627 | 158.9 |
| D | 2 | 250 | 198741 | 1246.42 | 642 | 627 | 158.9 |
| D | 12 | 233 | 62045 | 386.41 | 642 | 627 | 158.9 |
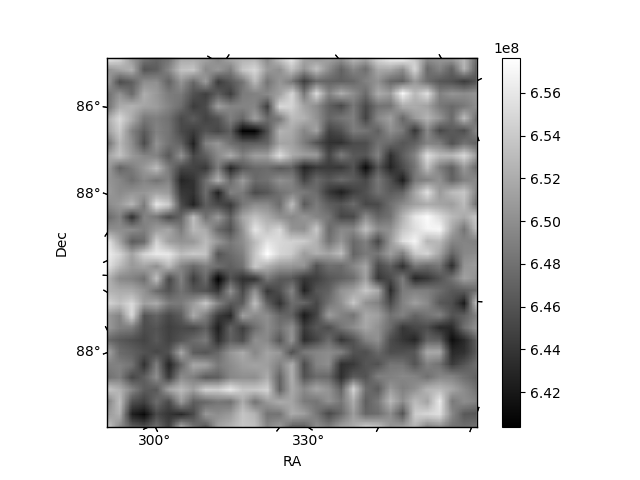
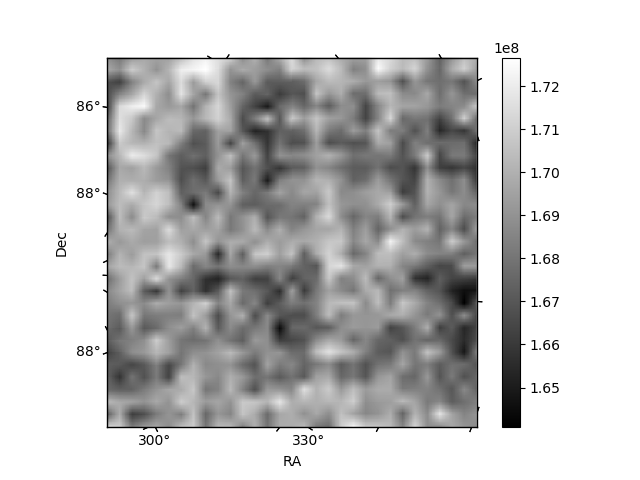
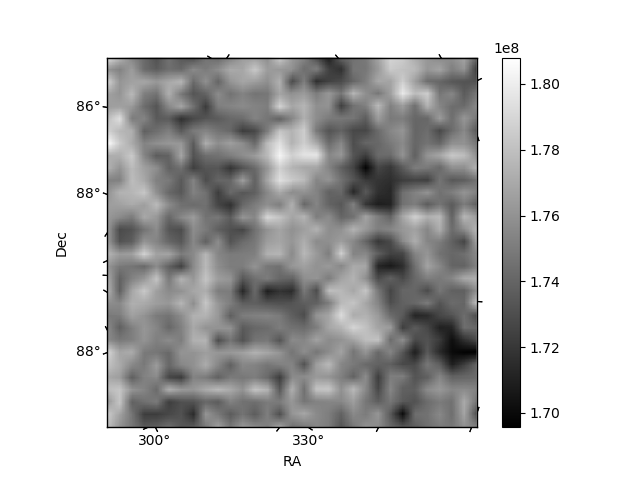
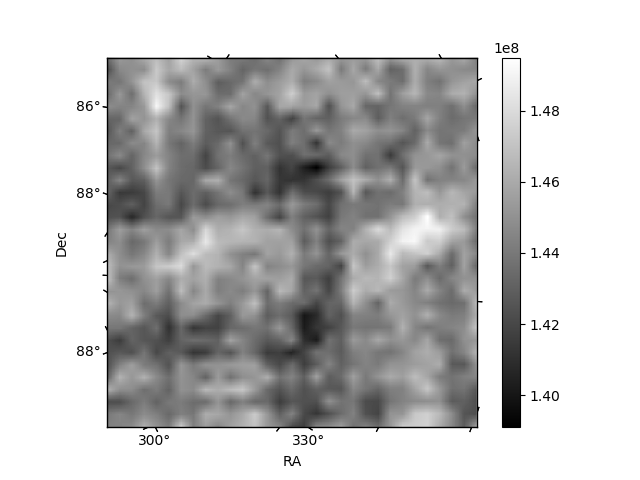
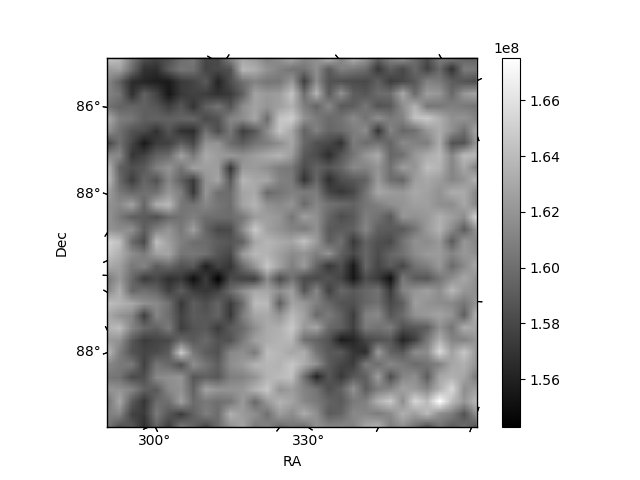
Histogram calculated using DETX and DETY for each event in the final _common_clean file
| Quadrant A | 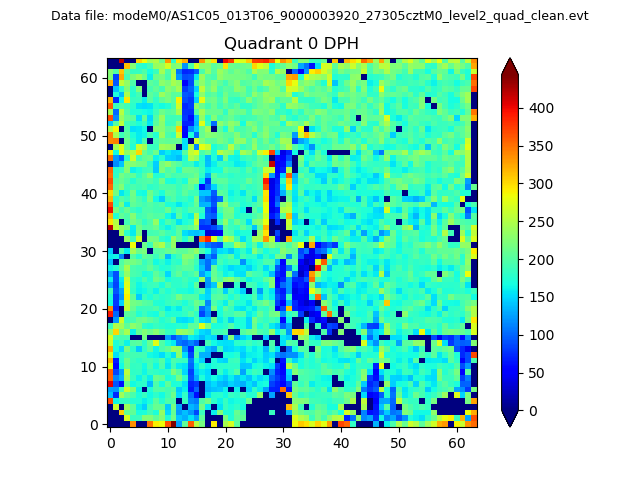 |
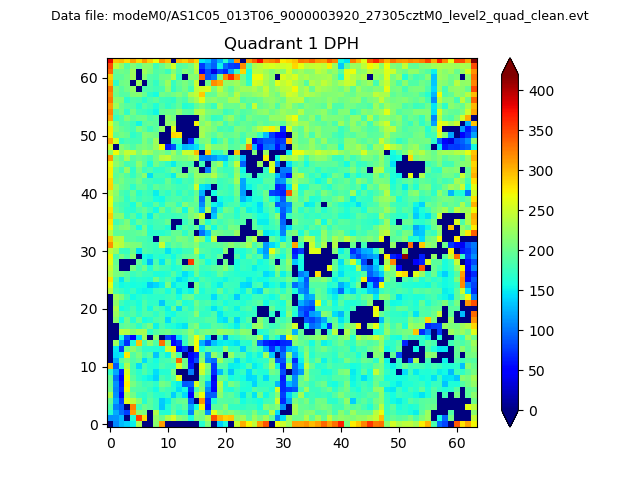 |
Quadrant B |
|---|---|---|---|
| Quadrant D | 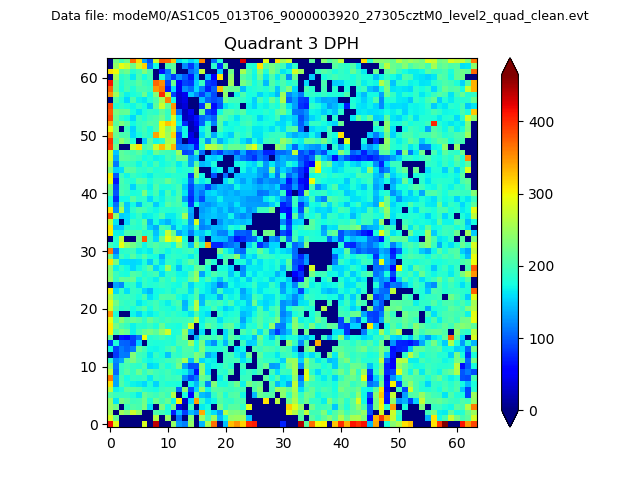 |
 |
Quadrant C |
| Plot type | Count rate plots | Images |
|---|---|---|
| Comparison with Poisson distribution Blue bars denote a histogram of data divided into 1 sec bins. Red curve is a Poisson curve with rate = median count rate of data. |
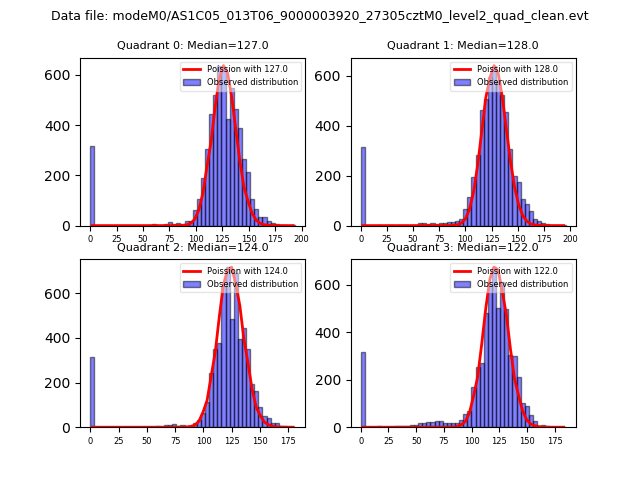 |
 |
| Quadrant-wise count rates Data is divided into 100 sec bins |
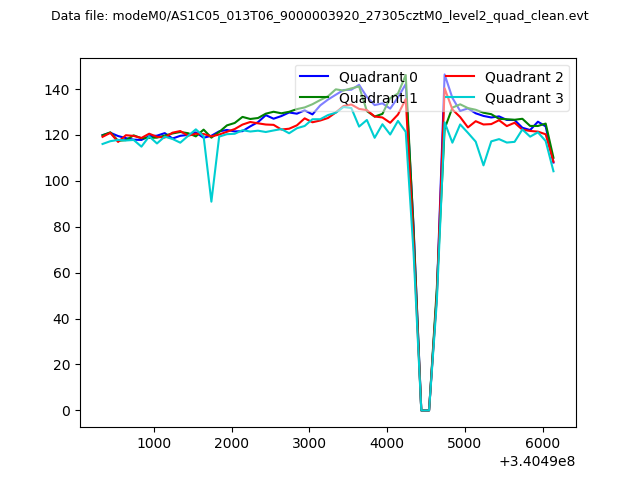 |
|
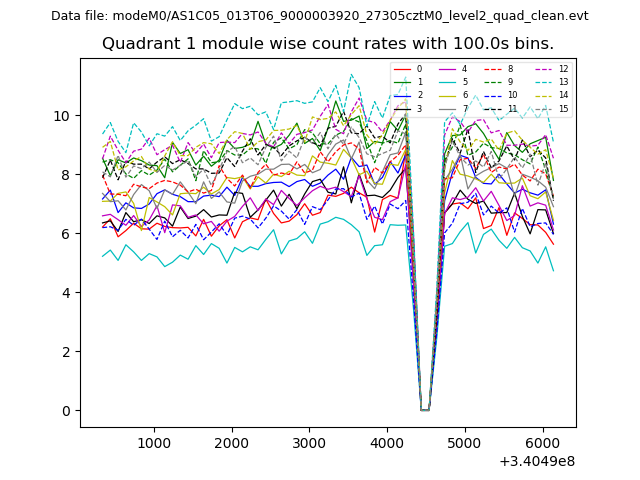
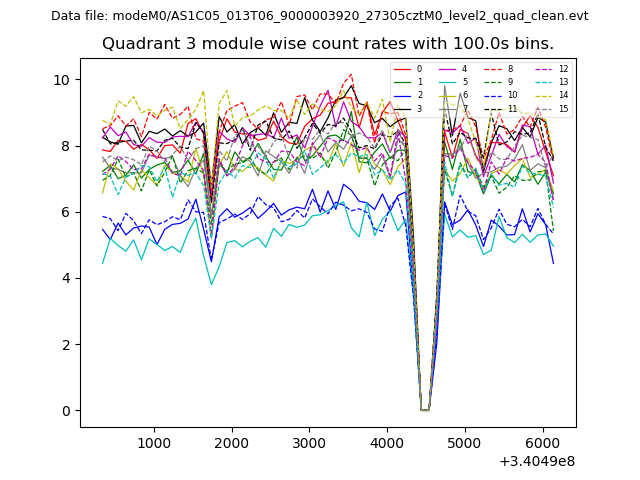
| Module-wise count rates for Quadrant A Data is divided into 100 sec bins |
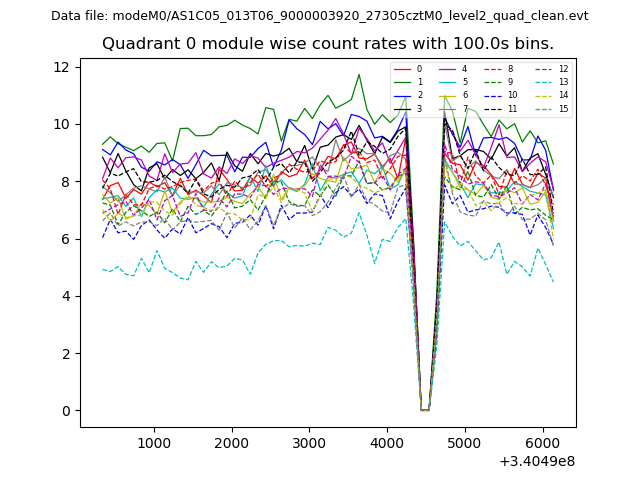 |
 |
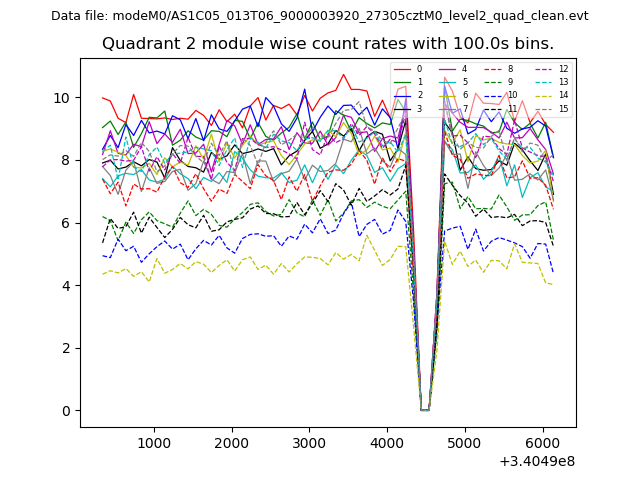
| Module-wise count rates for Quadrant B Data is divided into 100 sec bins |
 |
 |
| Module-wise count rates for Quadrant C Data is divided into 100 sec bins |
 |
 |
| Module-wise count rates for Quadrant D Data is divided into 100 sec bins |
 |
 |
| Parameter | Plot |
|---|---|
| CZT HV Monitor | 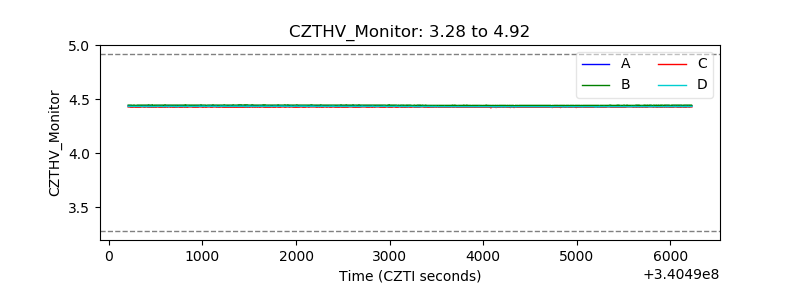 |
| D_VDD | 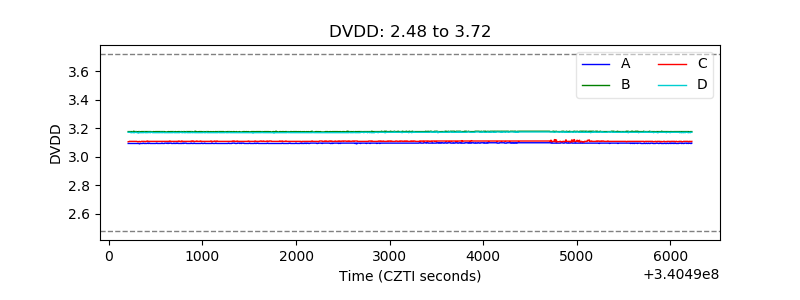 |
| Temperature 1 | 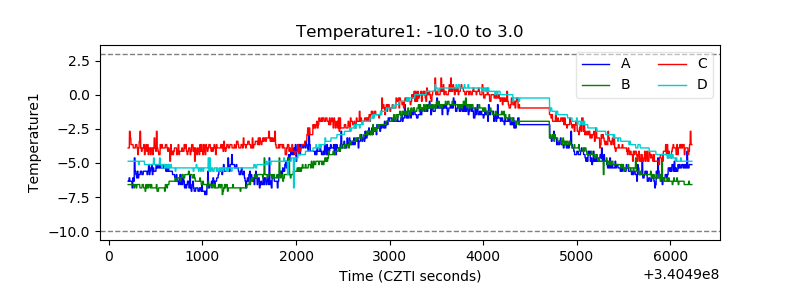 |
| Veto HV Monitor | 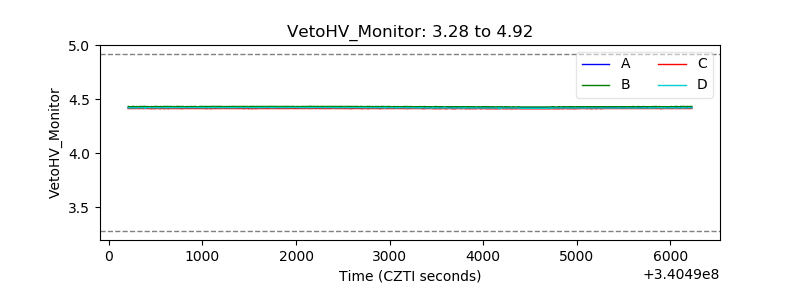 |
| Veto LLD | 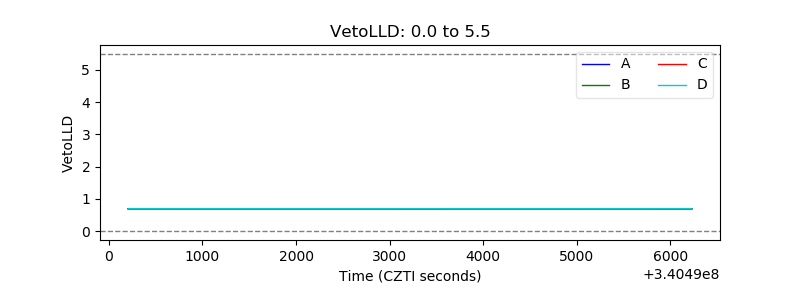 |
| Alpha Counter | 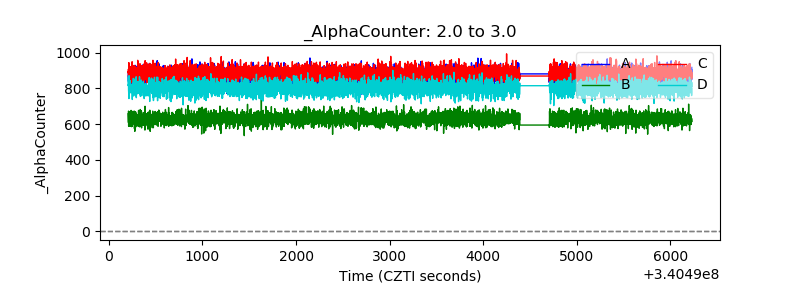 |
| _CPM_Rate | 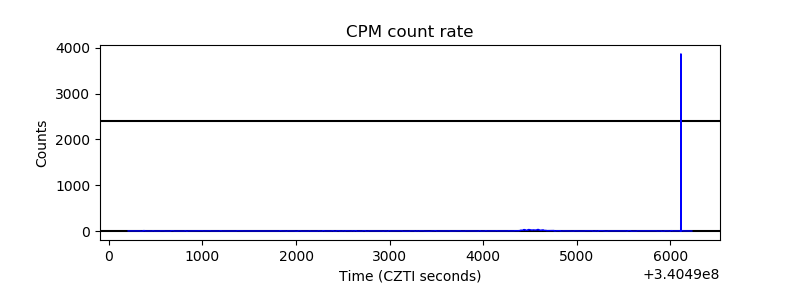 |
| CZT Counter | 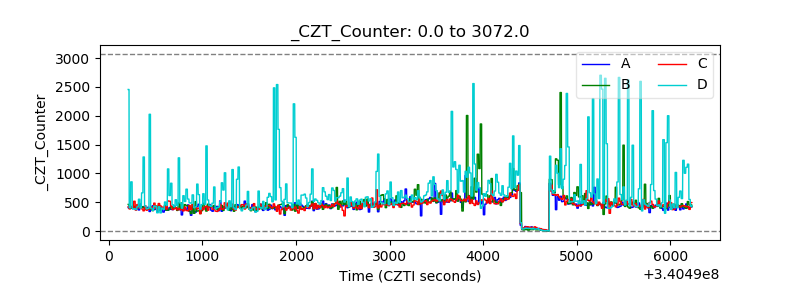 |
| +2.5 Volts monitor |  |
| +5 Volts monitor | 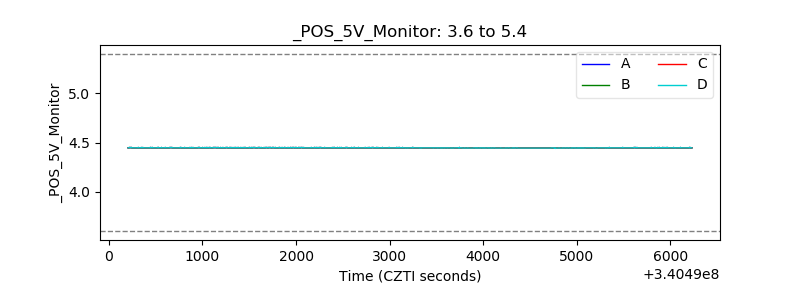 |
| _ROLL_ROT | 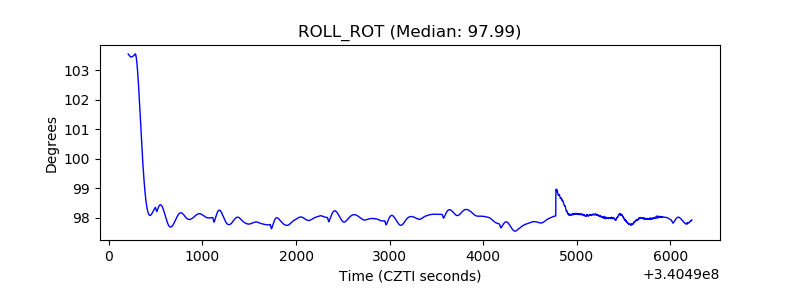 |
| _Roll_DEC | 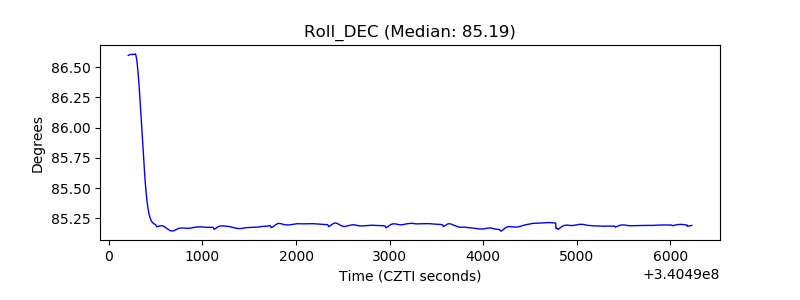 |
| _Roll_RA | 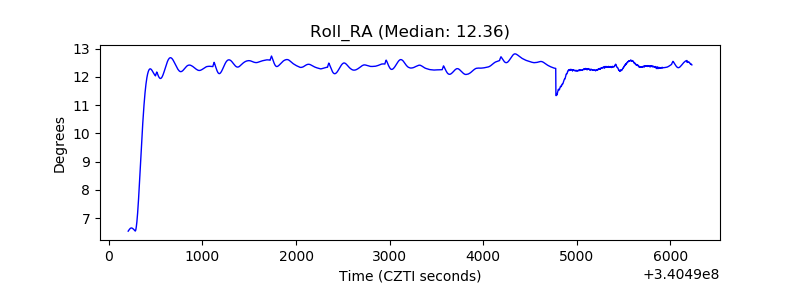 |
| Veto Counter | 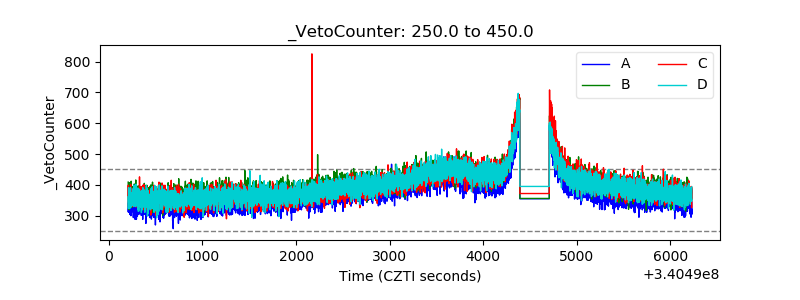 |