| Param | Original file | Final file |
|---|---|---|
| Filename | modeM0/AS1C05_013T06_9000003920_27309cztM0_level2.evt | modeM0/AS1C05_013T06_9000003920_27309cztM0_level2_quad_clean.evt |
| Size (bytes) | 1,129,593,600 | 290,718,720 |
| Size | 1.1 GB | 277.3 MB |
| Events in quadrant A | 7,129,239 | 1,959,381 |
| Events in quadrant B | 7,341,731 | 1,987,738 |
| Events in quadrant C | 7,168,167 | 1,917,365 |
| Events in quadrant D | 11,511,240 | 1,860,535 |
| Mode M0 | |||
|---|---|---|---|
| Quadrant | BADHDUFLAG | Total packets | Discarded packets |
| A | 0 | 31921 | 0 |
| B | 0 | 32427 | 0 |
| C | 0 | 31875 | 0 |
| D | 0 | 45459 | 0 |
| Mode M9 | |||
|---|---|---|---|
| Quadrant | BADHDUFLAG | Total packets | Discarded packets |
| A | 0 | 11 | 0 |
| B | 0 | 11 | 0 |
| C | 0 | 11 | 0 |
| D | 0 | 11 | 0 |
| Quadrant | Total seconds | Saturated seconds | Saturation percentage |
|---|---|---|---|
| A | 15668 | 44 | 0.280827% |
| B | 15668 | 75 | 0.478683% |
| C | 15668 | 130 | 0.829717% |
| D | 15669 | 641 | 4.090880% |
Noise dominated data is calculated using 1-second bins in cleaned event files. If a bin has >2000 counts, and if more than 50% of those come from <1% of pixels, then it is considered to be noise-dominated and hence unusable.
| Quadrant | # 1 sec bins | Bins with >0 counts | Bins with >2000 counts | High rate bins dominated by noise | Noise dominated (total time) | Noise dominated (detector-on time) | Marked lightcurve |
|---|---|---|---|---|---|---|---|
| A | 16803 | 15670 | 8 | 8 | 0.05% | 0.05% | 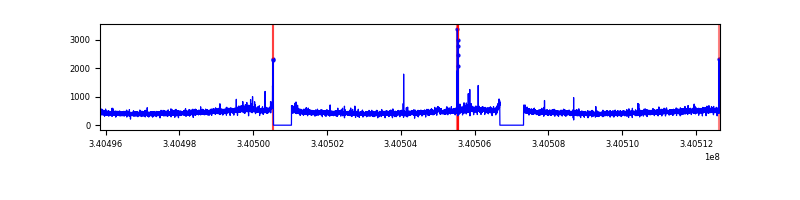 |
| B | 16803 | 15670 | 23 | 23 | 0.14% | 0.15% | 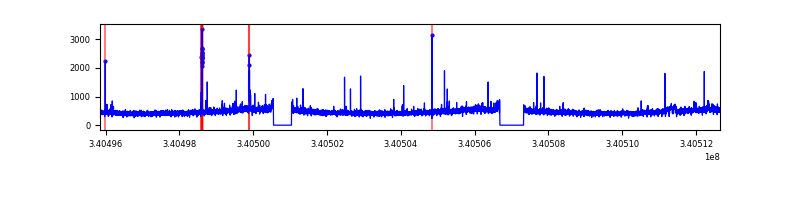 |
| C | 16803 | 15670 | 1 | 1 | 0.01% | 0.01% | 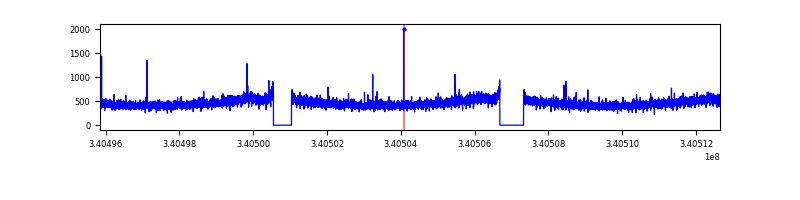 |
| D | 16804 | 15671 | 568 | 568 | 3.38% | 3.62% | 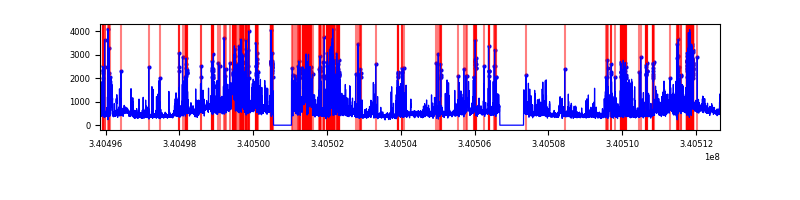 |
Top three noisy pixels from each quadrant. If the there are fewer than three noisy pixels in the level2.evt file, extra rows are filled as -1
| Pixel properties | Quadrant properties | ||||||
|---|---|---|---|---|---|---|---|
| Quadrant | DetID | PixID | Counts | Sigma | Mean | Median | Sigma |
| A | 13 | 248 | 51425 | 135.43 | 1828 | 1786 | 366.5 |
| A | 13 | 254 | 26881 | 68.47 | 1828 | 1786 | 366.5 |
| A | 3 | 137 | 17485 | 42.83 | 1828 | 1786 | 366.5 |
| B | 10 | 245 | 77259 | 221.67 | 1815 | 1769 | 340.5 |
| B | 7 | 205 | 62954 | 179.67 | 1815 | 1769 | 340.5 |
| B | 12 | 111 | 42213 | 118.76 | 1815 | 1769 | 340.5 |
| C | 14 | 238 | 282744 | 682.95 | 1757 | 1764 | 411.4 |
| C | 2 | 16 | 18147 | 39.82 | 1757 | 1764 | 411.4 |
| C | 8 | 128 | 13096 | 27.54 | 1757 | 1764 | 411.4 |
| D | 1 | 52 | 4331672 | 10273.5 | 1742 | 1700 | 421.5 |
| D | 2 | 250 | 164664 | 386.66 | 1742 | 1700 | 421.5 |
| D | 13 | 168 | 107930 | 252.05 | 1742 | 1700 | 421.5 |
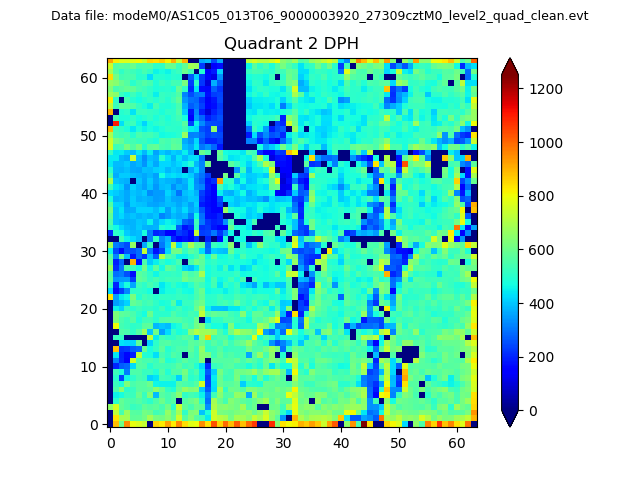
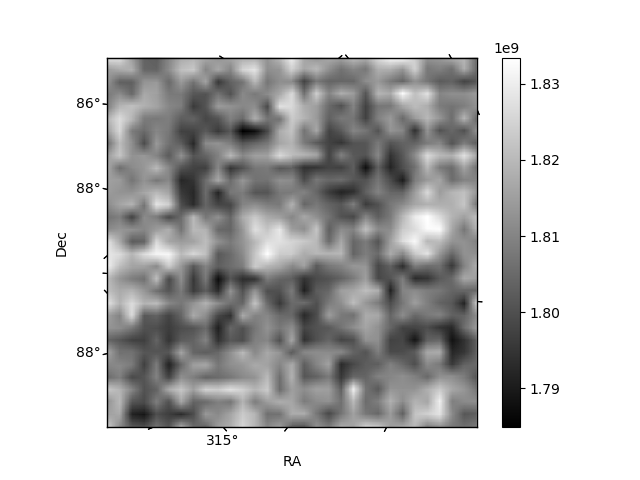
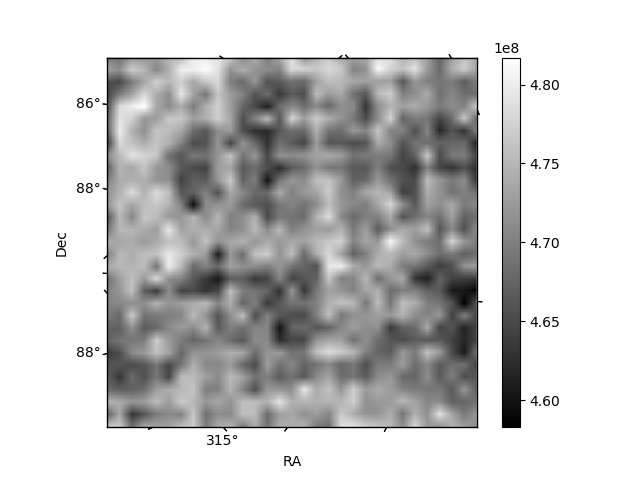
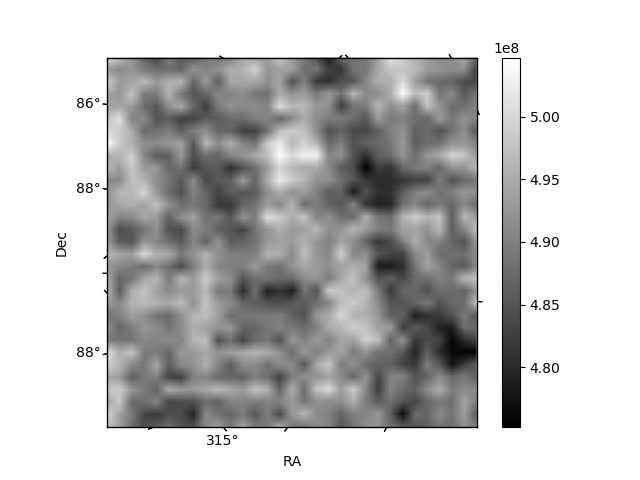
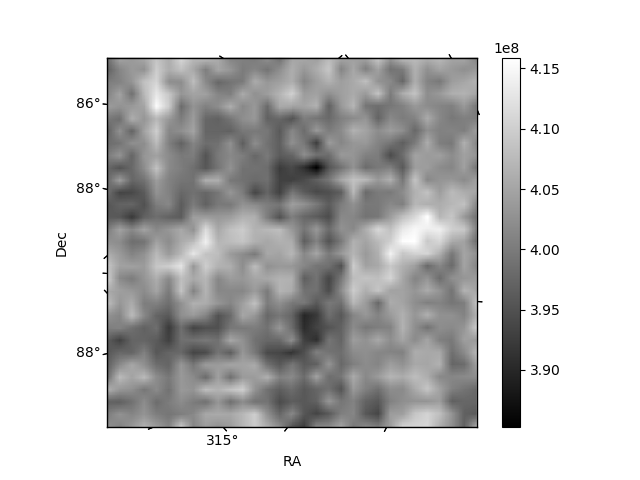
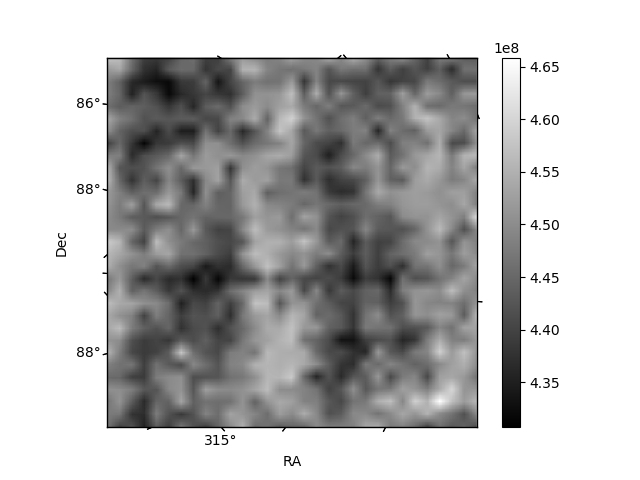
Histogram calculated using DETX and DETY for each event in the final _common_clean file
| Quadrant A | 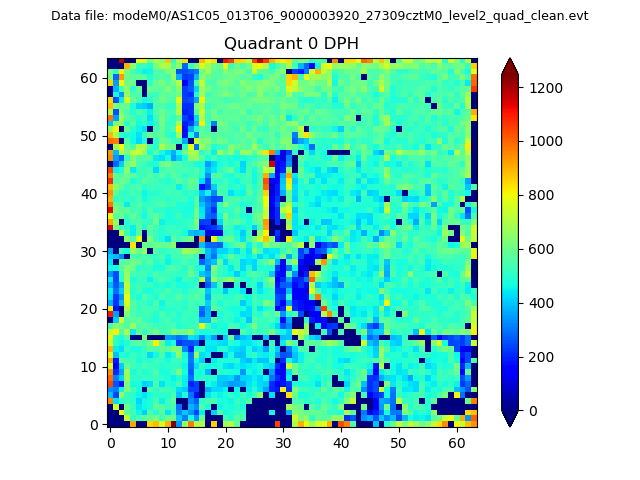 |
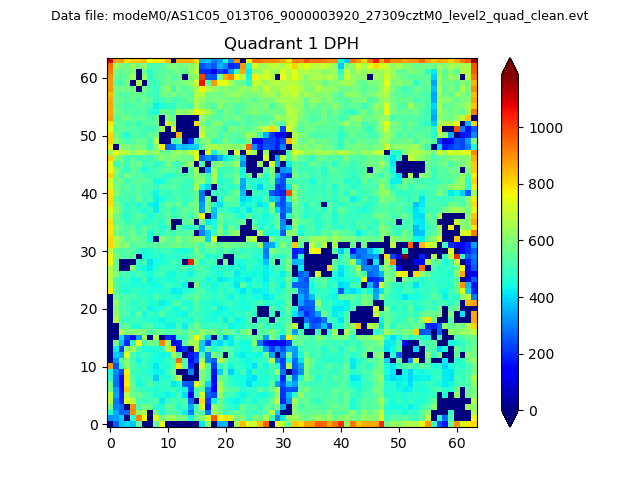 |
Quadrant B |
|---|---|---|---|
| Quadrant D | 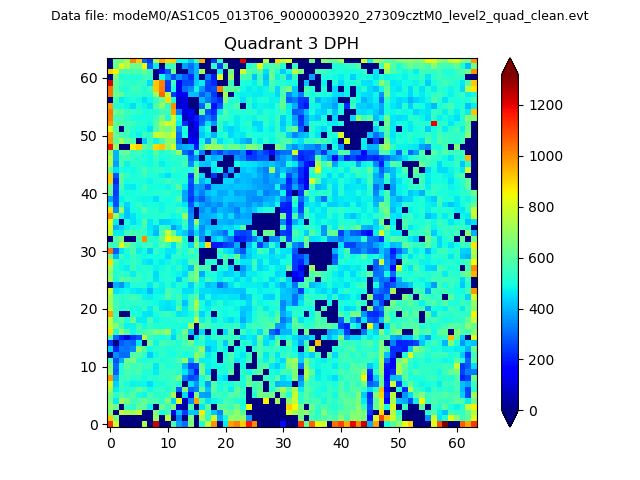 |
 |
Quadrant C |
| Plot type | Count rate plots | Images |
|---|---|---|
| Comparison with Poisson distribution Blue bars denote a histogram of data divided into 1 sec bins. Red curve is a Poisson curve with rate = median count rate of data. |
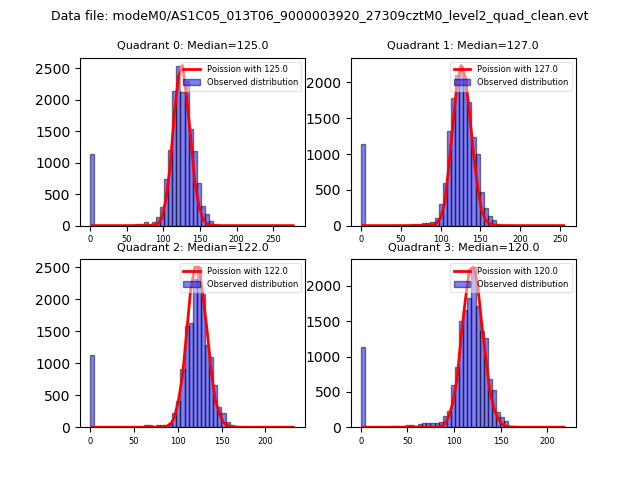 |
 |
| Quadrant-wise count rates Data is divided into 100 sec bins |
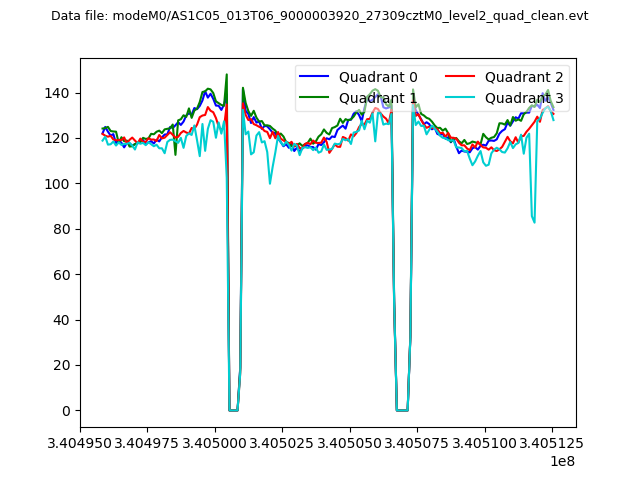 |
|
| Module-wise count rates for Quadrant A Data is divided into 100 sec bins |
 |
 |
| Module-wise count rates for Quadrant B Data is divided into 100 sec bins |
 |
 |
| Module-wise count rates for Quadrant C Data is divided into 100 sec bins |
 |
 |
| Module-wise count rates for Quadrant D Data is divided into 100 sec bins |
 |
 |
| Parameter | Plot |
|---|---|
| CZT HV Monitor |  |
| D_VDD | 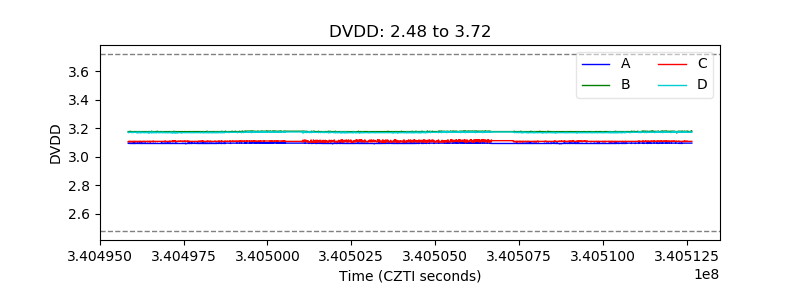 |
| Temperature 1 | 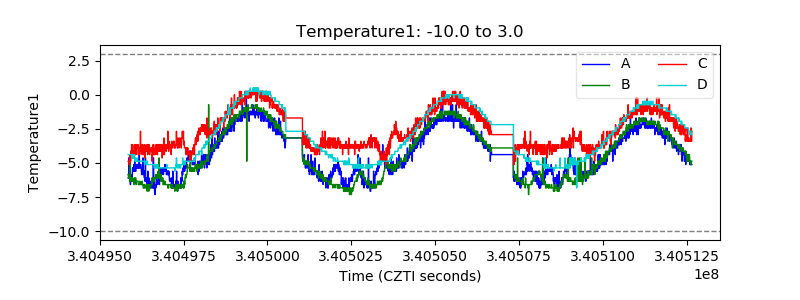 |
| Veto HV Monitor | 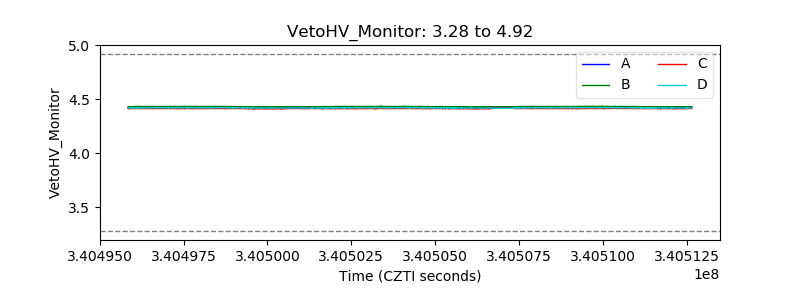 |
| Veto LLD | 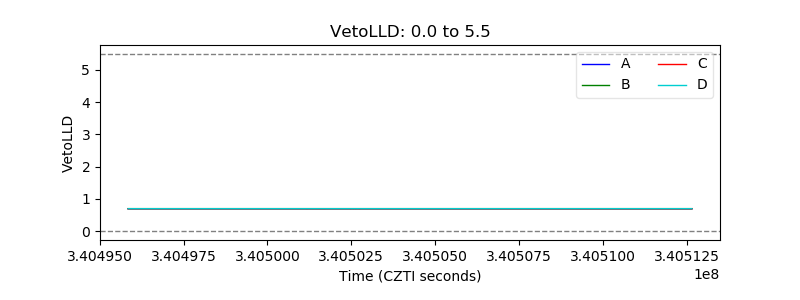 |
| Alpha Counter |  |
| _CPM_Rate | 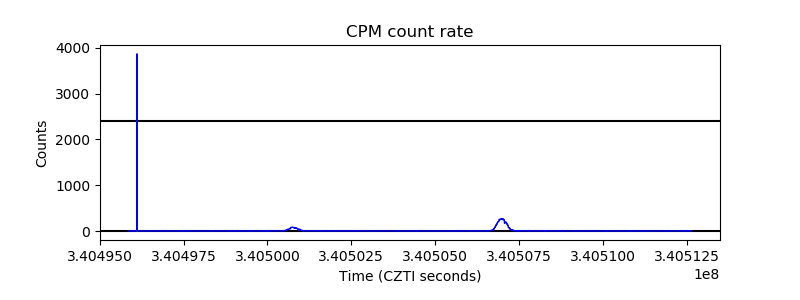 |
| CZT Counter | 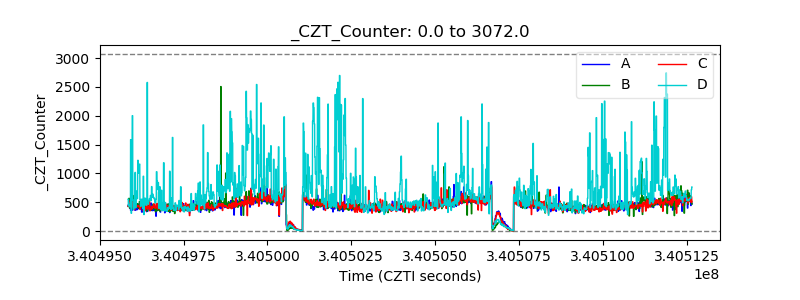 |
| +2.5 Volts monitor |  |
| +5 Volts monitor |  |
| _ROLL_ROT |  |
| _Roll_DEC |  |
| _Roll_RA | 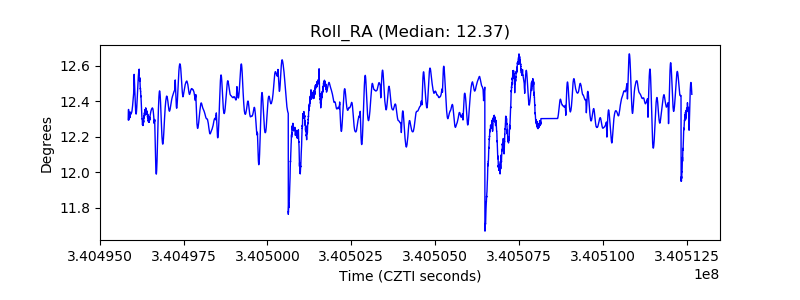 |
| Veto Counter |  |