| Param | Original file | Final file |
|---|---|---|
| Filename | modeM0/AS1T03_255T01_9000003922cztM0_level2.fits | modeM0/AS1T03_255T01_9000003922cztM0_level2_quad_clean.evt |
| Size (bytes) | 2,303,354,880 | 1,860,894,720 |
| Size | 2.1 GB | 1.7 GB |
| Events in quadrant A | 14,673,604 | 11,031,383 |
| Events in quadrant B | 13,714,252 | 10,661,855 |
| Events in quadrant C | 13,648,064 | 9,978,475 |
| Events in quadrant D | 12,103,026 | 9,070,222 |
| Mode SS | |||
|---|---|---|---|
| Quadrant | BADHDUFLAG | Total packets | Discarded packets |
| A | 0 | 4646 | 0 |
| B | 0 | 4646 | 0 |
| C | 0 | 4646 | 0 |
| D | 0 | 4646 | 0 |
| Mode M9 | |||
|---|---|---|---|
| Quadrant | BADHDUFLAG | Total packets | Discarded packets |
| A | 0 | 370 | 0 |
| B | 0 | 370 | 0 |
| C | 0 | 370 | 0 |
| D | 0 | 370 | 0 |
| Mode M0 | |||
|---|---|---|---|
| Quadrant | BADHDUFLAG | Total packets | Discarded packets |
| A | 0 | 486806 | 0 |
| B | 0 | 534630 | 0 |
| C | 0 | 552445 | 0 |
| D | 0 | 610699 | 0 |
| Quadrant | Total seconds | Saturated seconds | Saturation percentage |
|---|---|---|---|
| A | 227902 | 2577 | 1.130749% |
| B | 227902 | 7355 | 3.227264% |
| C | 227902 | 11332 | 4.972313% |
| D | 227902 | 11262 | 4.941598% |
Noise dominated data is calculated using 1-second bins in cleaned event files. If a bin has >2000 counts, and if more than 50% of those come from <1% of pixels, then it is considered to be noise-dominated and hence unusable.
| Quadrant | # 1 sec bins | Bins with >0 counts | Bins with >2000 counts | High rate bins dominated by noise | Noise dominated (total time) | Noise dominated (detector-on time) | Marked lightcurve |
|---|---|---|---|---|---|---|---|
| A | 265022 | 227884 | 0 | 0 | 0.00% | 0.00% | 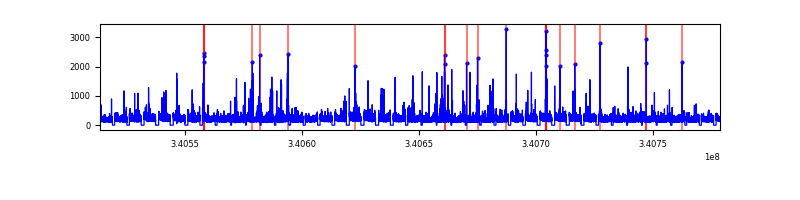 |
| B | 265022 | 227737 | 0 | 0 | 0.00% | 0.00% | 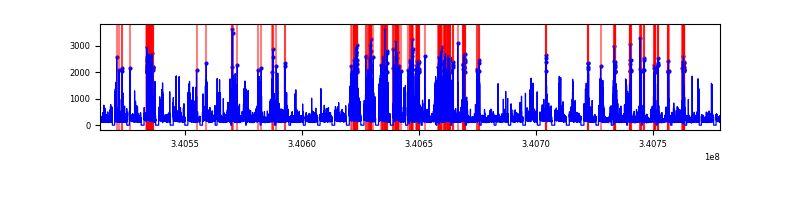 |
| C | 265022 | 227745 | 0 | 0 | 0.00% | 0.00% | 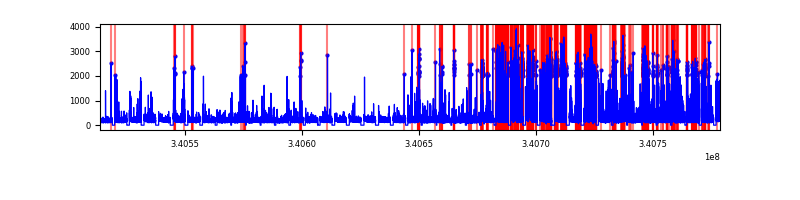 |
| D | 265022 | 227710 | 0 | 0 | 0.00% | 0.00% | 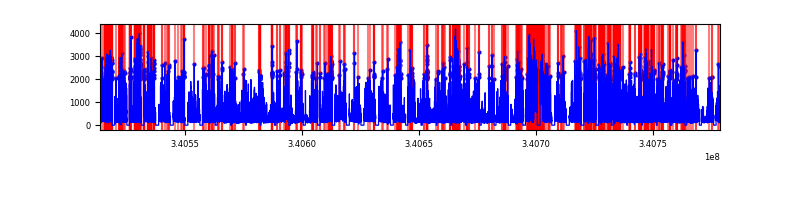 |
Top three noisy pixels from each quadrant. If the there are fewer than three noisy pixels in the level2.evt file, extra rows are filled as -1
| Pixel properties | Quadrant properties | ||||||
|---|---|---|---|---|---|---|---|
| Quadrant | DetID | PixID | Counts | Sigma | Mean | Median | Sigma |
| A | 0 | 29 | 14232 | 11.79 | 3821 | 3603 | 901.5 |
| A | 7 | 110 | 11612 | 8.88 | 3821 | 3603 | 901.5 |
| A | 0 | 30 | 11294 | 8.53 | 3821 | 3603 | 901.5 |
| B | 2 | 9 | 10687 | 10.26 | 3639 | 3480 | 702.3 |
| B | 5 | 128 | 9052 | 7.93 | 3639 | 3480 | 702.3 |
| B | 2 | 8 | 8989 | 7.84 | 3639 | 3480 | 702.3 |
| C | 1 | 81 | 10474 | 7.88 | 3606 | 3375 | 900.9 |
| C | 1 | 80 | 10462 | 7.87 | 3606 | 3375 | 900.9 |
| C | 12 | 241 | 9644 | 6.96 | 3606 | 3375 | 900.9 |
| D | 10 | 189 | 8729 | 6.13 | 3459 | 3159 | 909.3 |
| D | 3 | 14 | 8588 | 5.97 | 3459 | 3159 | 909.3 |
| D | 7 | 3 | 8534 | 5.91 | 3459 | 3159 | 909.3 |
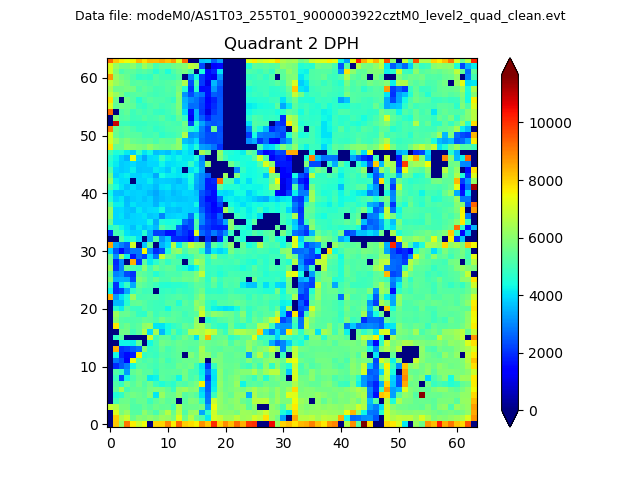
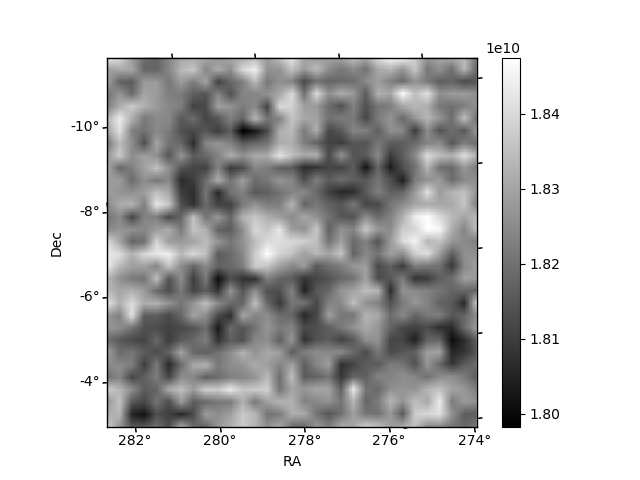
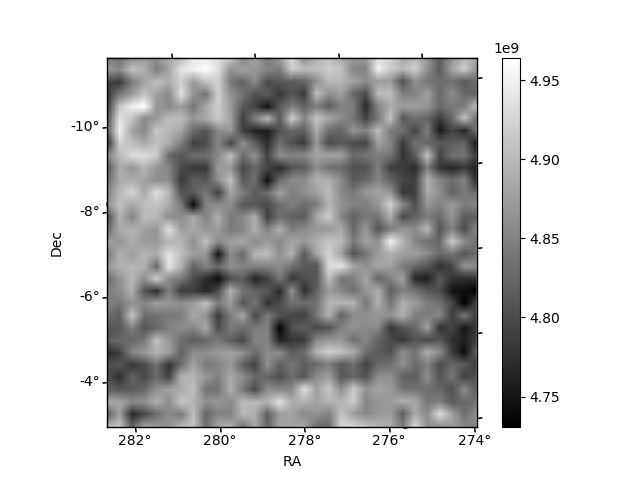
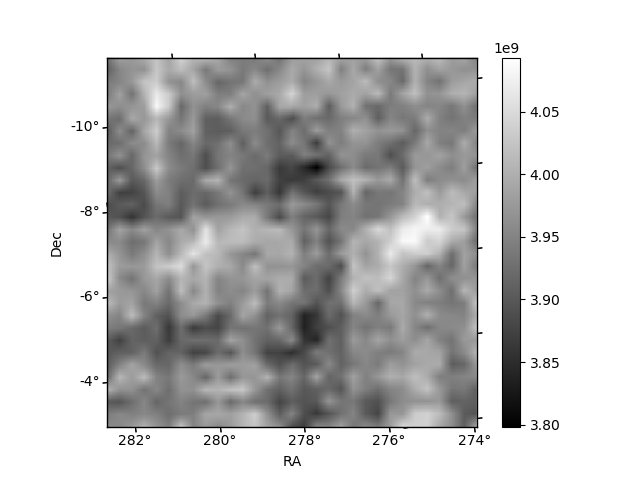
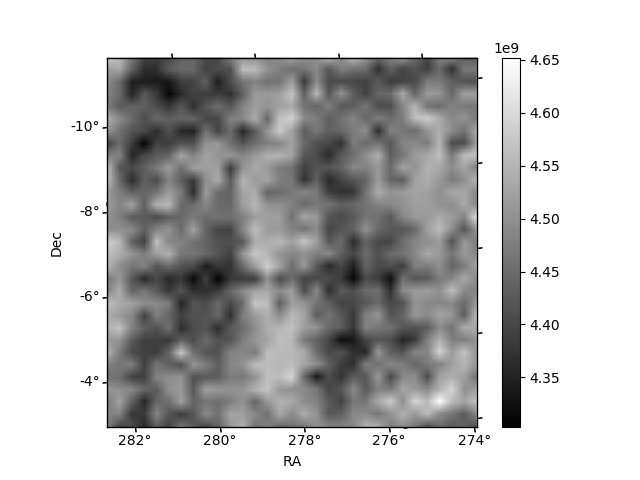
Histogram calculated using DETX and DETY for each event in the final _common_clean file
| Quadrant A | 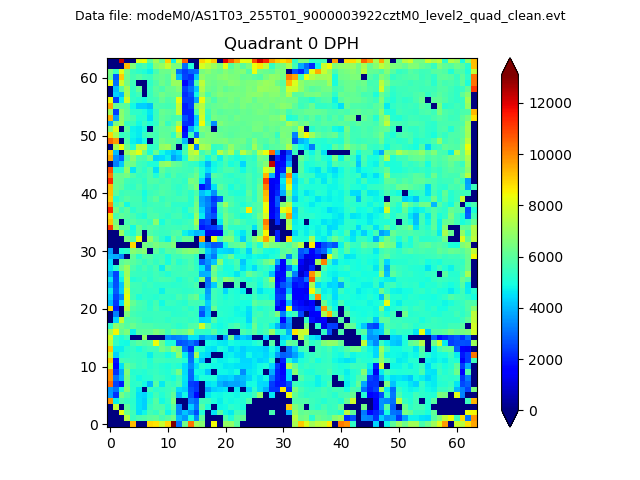 |
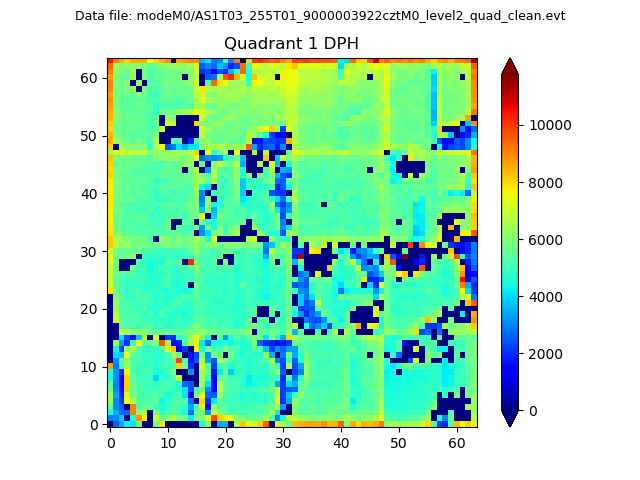 |
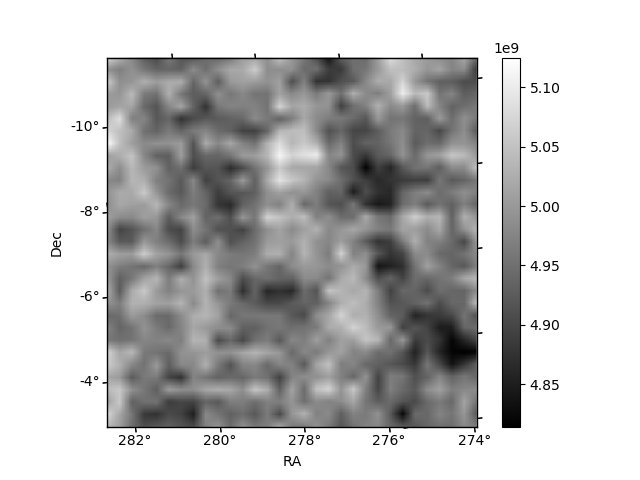
Quadrant B |
|---|---|---|---|
| Quadrant D | 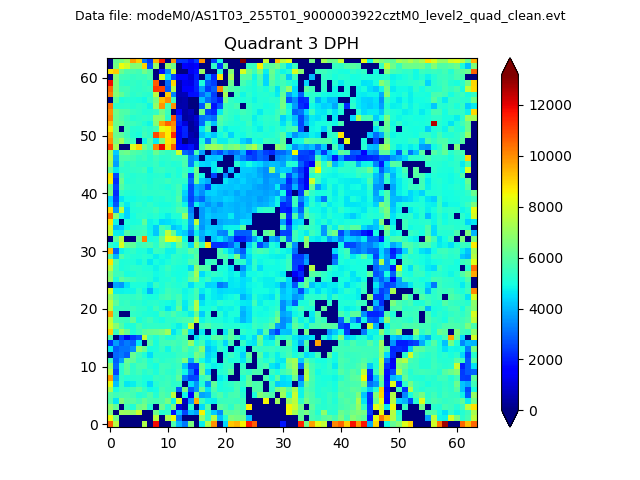 |
 |
Quadrant C |
| Plot type | Count rate plots | Images |
|---|---|---|
| Comparison with Poisson distribution Blue bars denote a histogram of data divided into 1 sec bins. Red curve is a Poisson curve with rate = median count rate of data. |
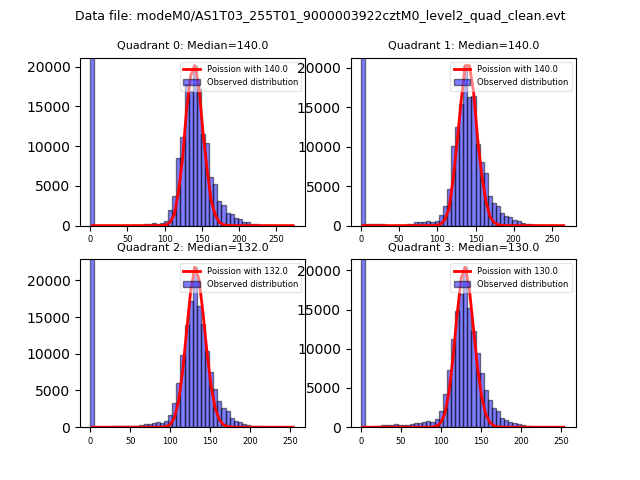 |
 |
| Quadrant-wise count rates Data is divided into 100 sec bins |
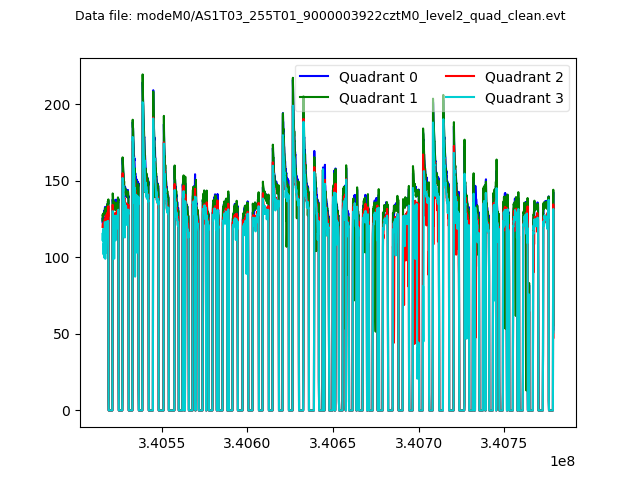 |
|
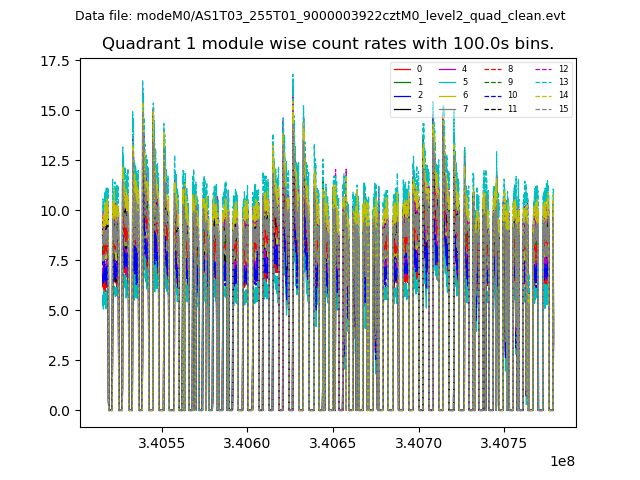
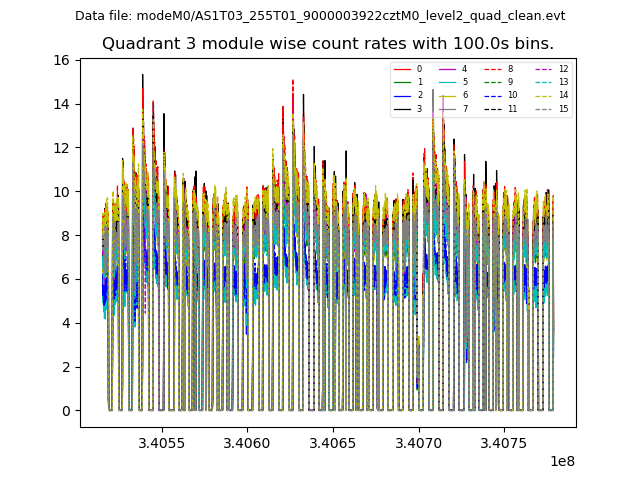
| Module-wise count rates for Quadrant A Data is divided into 100 sec bins |
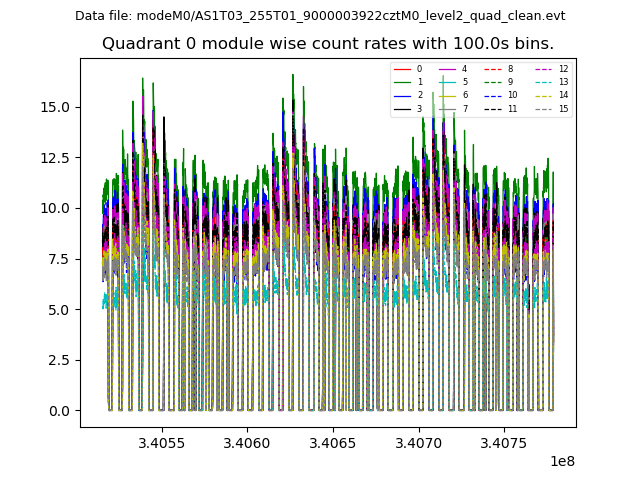 |
 |
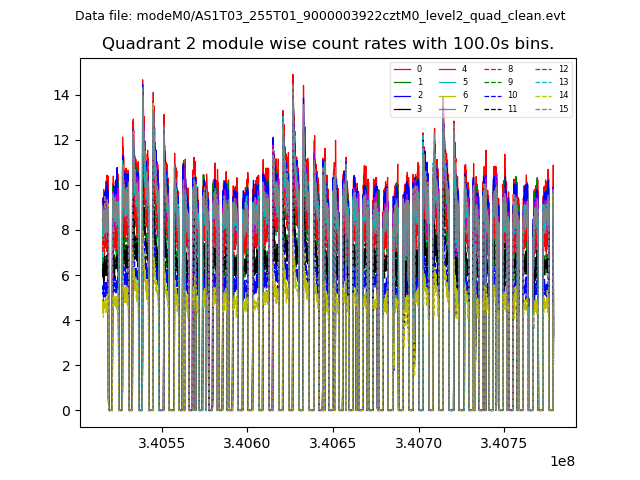
| Module-wise count rates for Quadrant B Data is divided into 100 sec bins |
 |
 |
| Module-wise count rates for Quadrant C Data is divided into 100 sec bins |
 |
 |
| Module-wise count rates for Quadrant D Data is divided into 100 sec bins |
 |
 |
| Parameter | Plot |
|---|---|
| CZT HV Monitor | 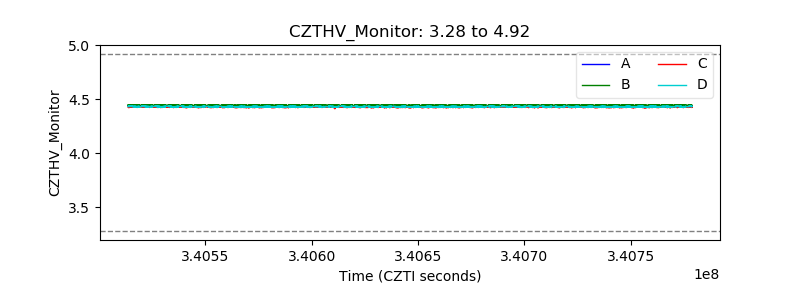 |
| D_VDD | 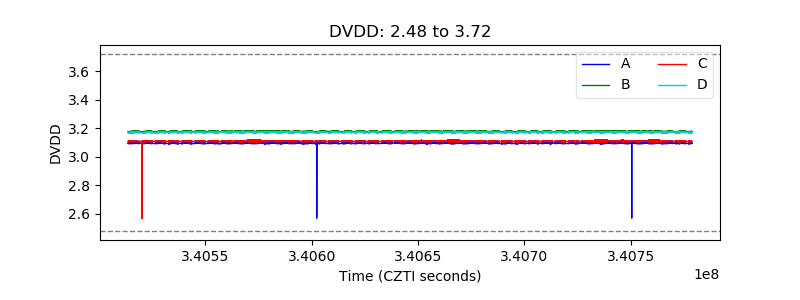 |
| Temperature 1 | 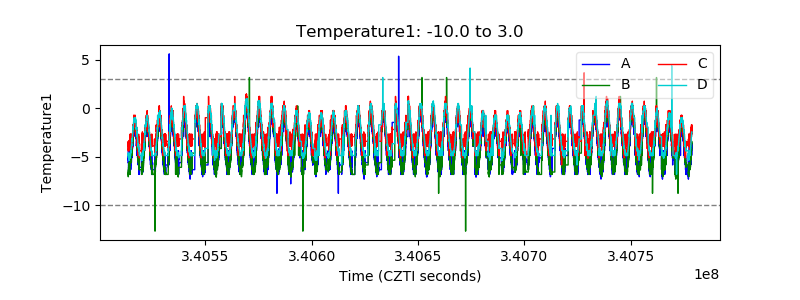 |
| Veto HV Monitor | 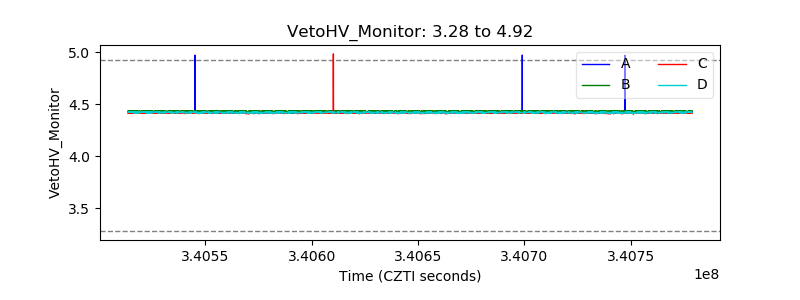 |
| Veto LLD | 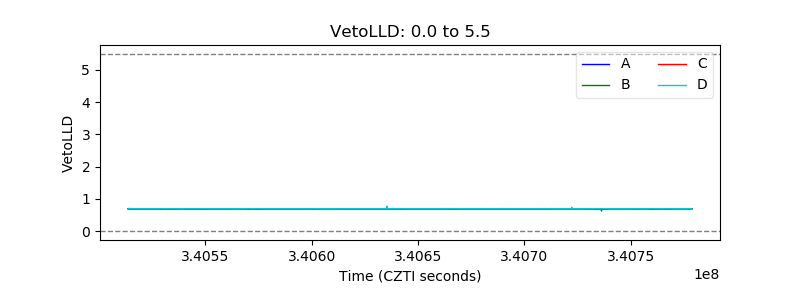 |
| Alpha Counter | 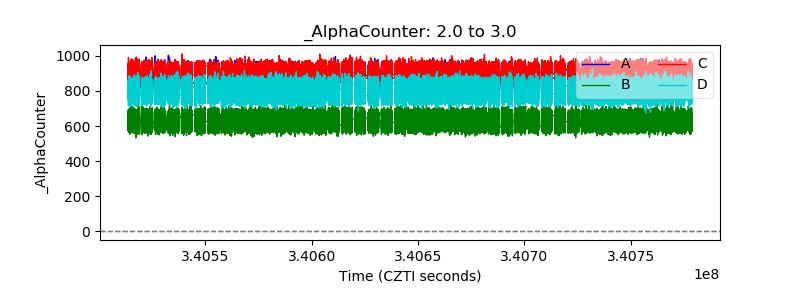 |
| _CPM_Rate | 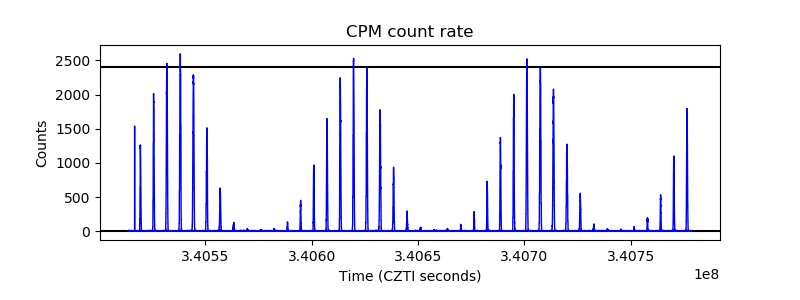 |
| CZT Counter | 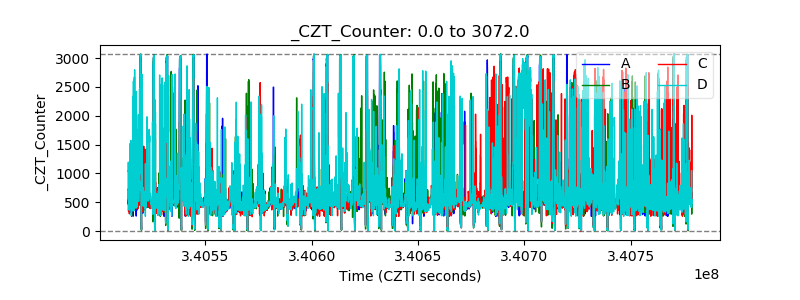 |
| +2.5 Volts monitor | 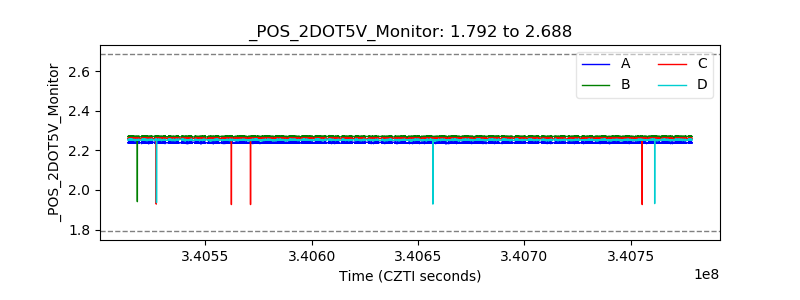 |
| +5 Volts monitor | 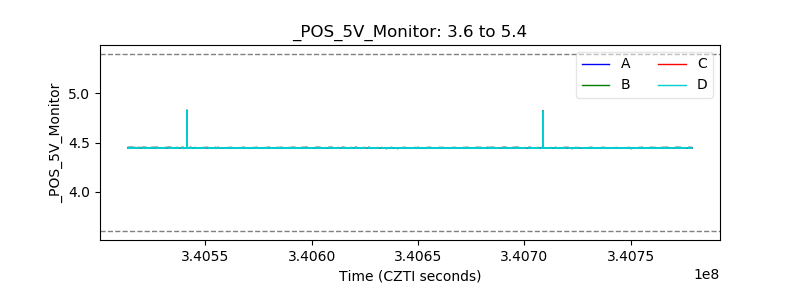 |
| _ROLL_ROT | 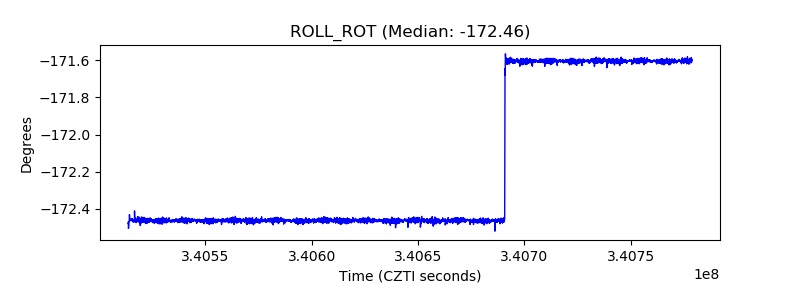 |
| _Roll_DEC | 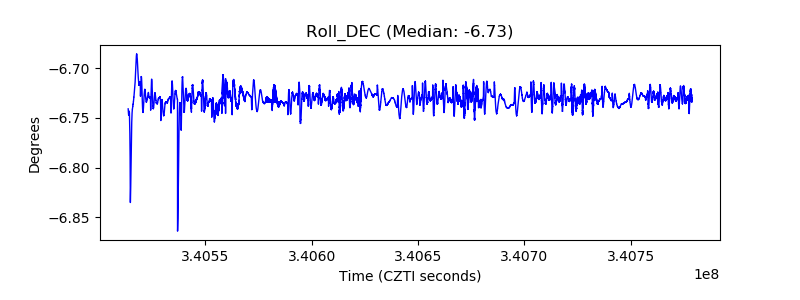 |
| _Roll_RA | 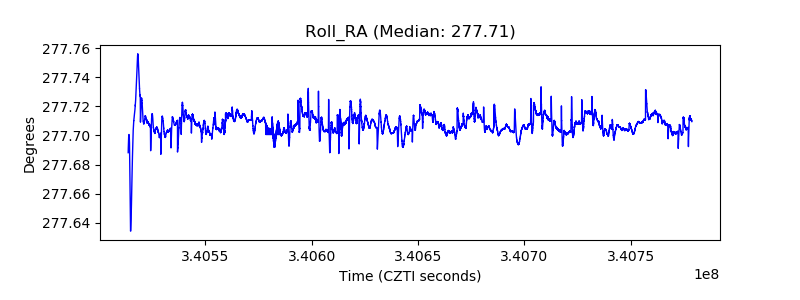 |
| Veto Counter | 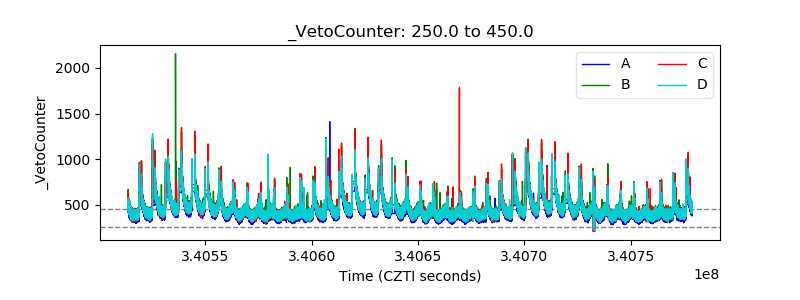 |