| Param | Original file | Final file |
|---|---|---|
| Filename | modeM0/AS1T03_255T01_9000003922_27309cztM0_level2.evt | modeM0/AS1T03_255T01_9000003922_27309cztM0_level2_quad_clean.evt |
| Size (bytes) | 549,780,480 | 77,256,000 |
| Size | 524.3 MB | 73.7 MB |
| Events in quadrant A | 3,377,266 | 484,750 |
| Events in quadrant B | 3,497,004 | 487,897 |
| Events in quadrant C | 3,446,926 | 461,387 |
| Events in quadrant D | 5,864,155 | 427,389 |
| Mode M9 | |||
|---|---|---|---|
| Quadrant | BADHDUFLAG | Total packets | Discarded packets |
| A | 0 | 10 | 0 |
| B | 0 | 10 | 0 |
| C | 0 | 10 | 0 |
| D | 0 | 10 | 0 |
| Mode M0 | |||
|---|---|---|---|
| Quadrant | BADHDUFLAG | Total packets | Discarded packets |
| A | 0 | 14147 | 0 |
| B | 0 | 14472 | 0 |
| C | 0 | 14478 | 0 |
| D | 0 | 22003 | 0 |
| Quadrant | Total seconds | Saturated seconds | Saturation percentage |
|---|---|---|---|
| A | 6851 | 51 | 0.744417% |
| B | 6851 | 71 | 1.036345% |
| C | 6851 | 126 | 1.839148% |
| D | 6851 | 567 | 8.276164% |
Noise dominated data is calculated using 1-second bins in cleaned event files. If a bin has >2000 counts, and if more than 50% of those come from <1% of pixels, then it is considered to be noise-dominated and hence unusable.
| Quadrant | # 1 sec bins | Bins with >0 counts | Bins with >2000 counts | High rate bins dominated by noise | Noise dominated (total time) | Noise dominated (detector-on time) | Marked lightcurve |
|---|---|---|---|---|---|---|---|
| A | 7816 | 6851 | 0 | 0 | 0.00% | 0.00% | 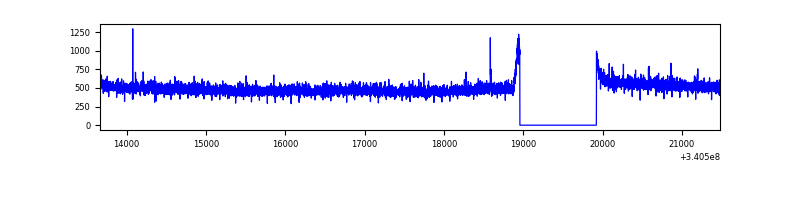 |
| B | 7816 | 6851 | 2 | 2 | 0.03% | 0.03% | 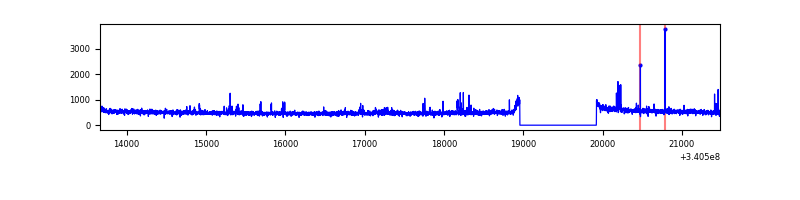 |
| C | 7816 | 6851 | 10 | 10 | 0.13% | 0.15% | 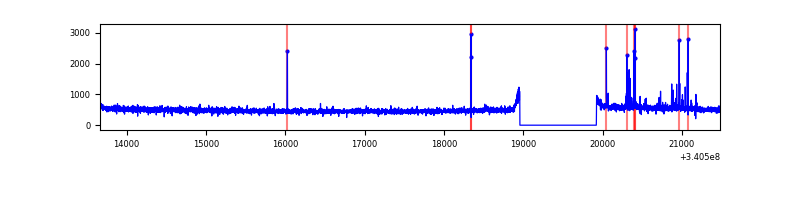 |
| D | 7816 | 6851 | 555 | 555 | 7.10% | 8.10% | 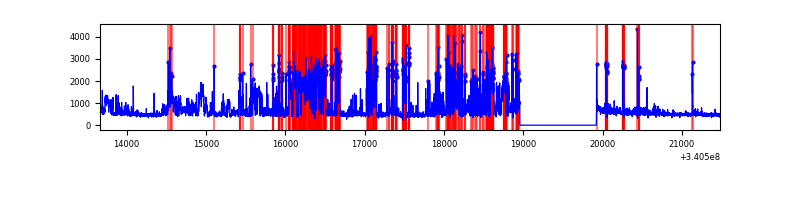 |
Top three noisy pixels from each quadrant. If the there are fewer than three noisy pixels in the level2.evt file, extra rows are filled as -1
| Pixel properties | Quadrant properties | ||||||
|---|---|---|---|---|---|---|---|
| Quadrant | DetID | PixID | Counts | Sigma | Mean | Median | Sigma |
| A | 13 | 254 | 11326 | 59.84 | 874 | 857 | 174.9 |
| A | 3 | 137 | 8214 | 42.05 | 874 | 857 | 174.9 |
| A | 0 | 226 | 7553 | 38.28 | 874 | 857 | 174.9 |
| B | 0 | 190 | 28056 | 162.49 | 868 | 848 | 167.4 |
| B | 0 | 229 | 23339 | 134.32 | 868 | 848 | 167.4 |
| B | 12 | 111 | 20317 | 116.27 | 868 | 848 | 167.4 |
| C | 14 | 238 | 137082 | 700.32 | 826 | 831 | 194.6 |
| C | 2 | 16 | 80091 | 407.39 | 826 | 831 | 194.6 |
| C | 10 | 22 | 6945 | 31.43 | 826 | 831 | 194.6 |
| D | 1 | 52 | 2605474 | 13193.27 | 810 | 791 | 197.4 |
| D | 12 | 233 | 107230 | 539.13 | 810 | 791 | 197.4 |
| D | 2 | 250 | 69424 | 347.64 | 810 | 791 | 197.4 |
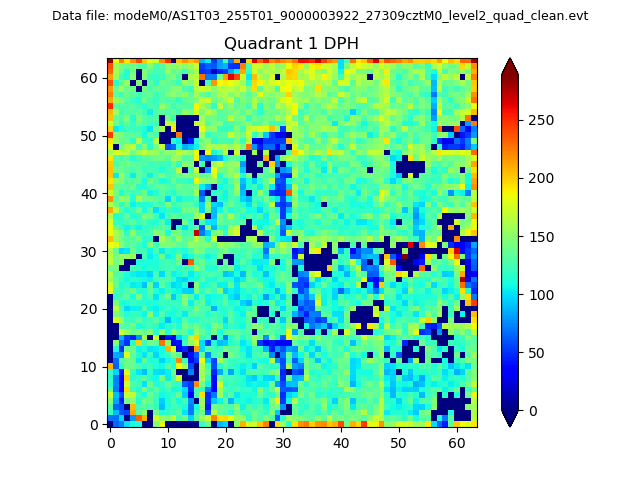
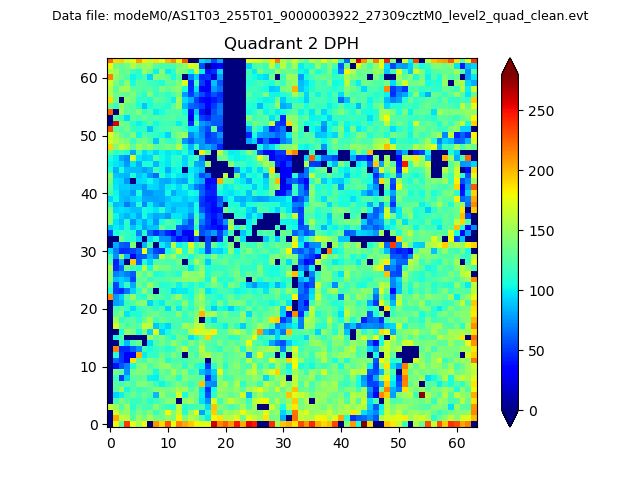
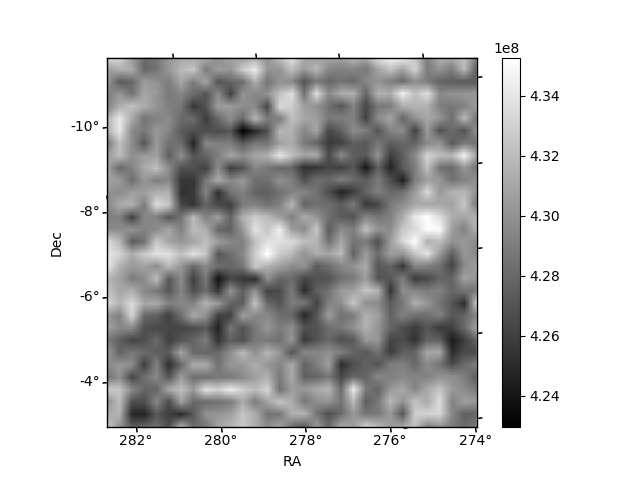
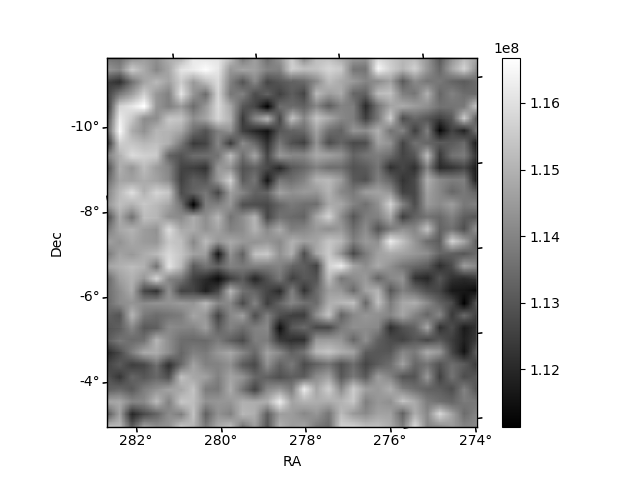
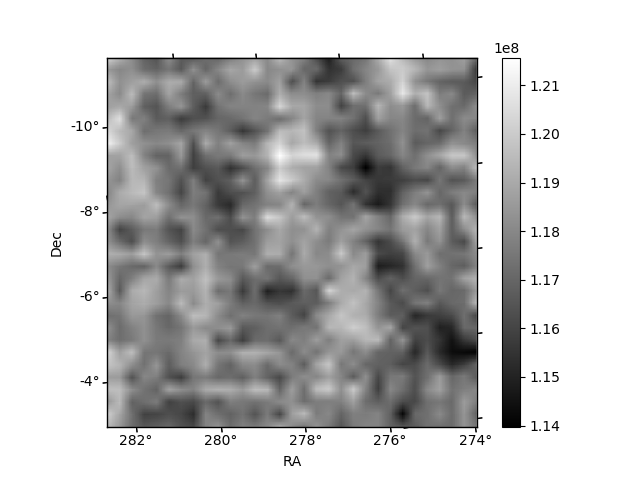
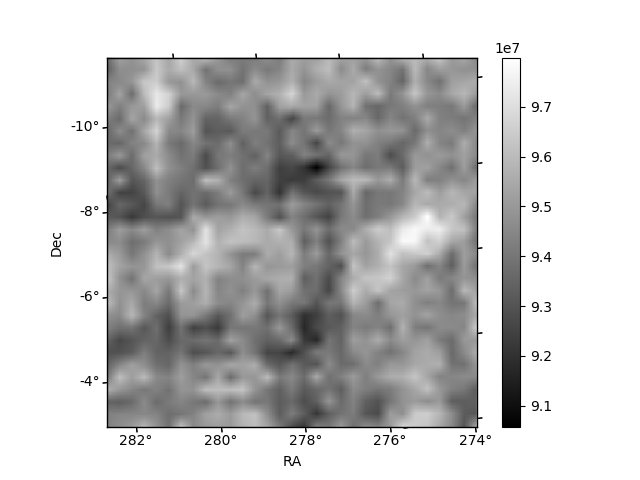
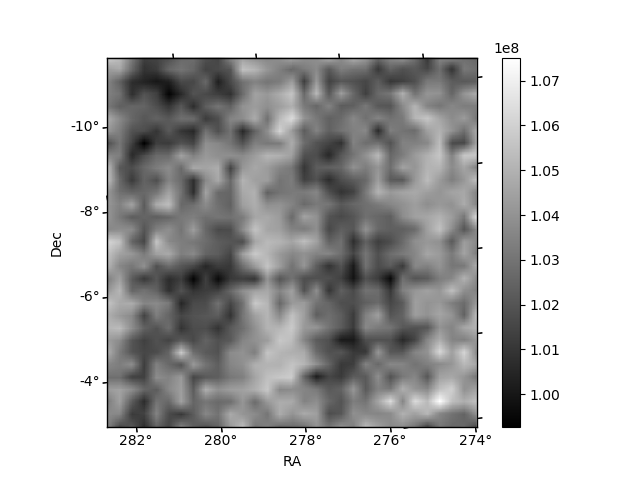
Histogram calculated using DETX and DETY for each event in the final _common_clean file
| Quadrant A |  |
 |
Quadrant B |
|---|---|---|---|
| Quadrant D | 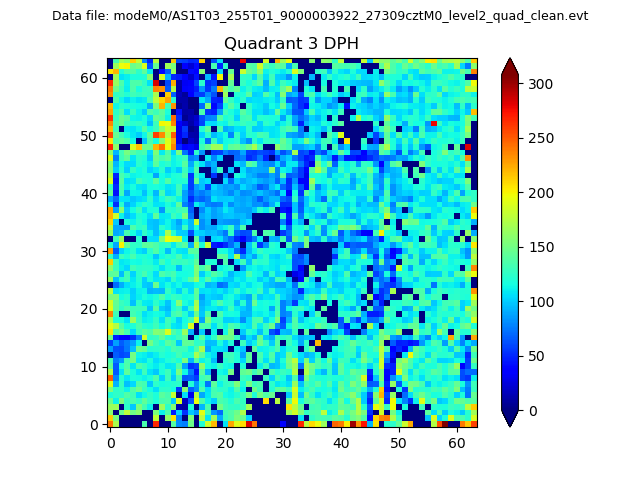 |
 |
Quadrant C |
| Plot type | Count rate plots | Images |
|---|---|---|
| Comparison with Poisson distribution Blue bars denote a histogram of data divided into 1 sec bins. Red curve is a Poisson curve with rate = median count rate of data. |
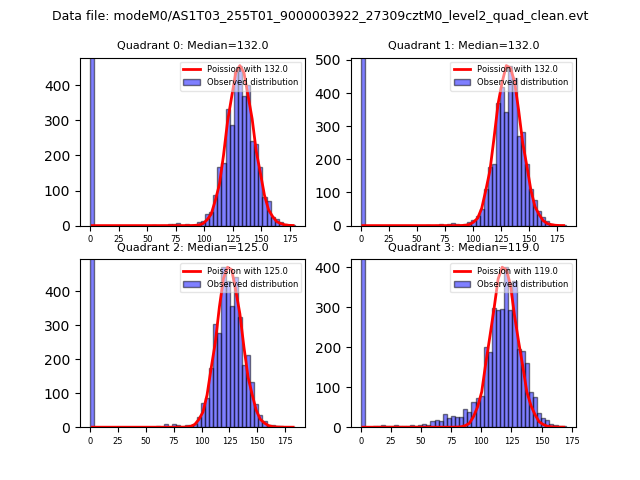 |
 |
| Quadrant-wise count rates Data is divided into 100 sec bins |
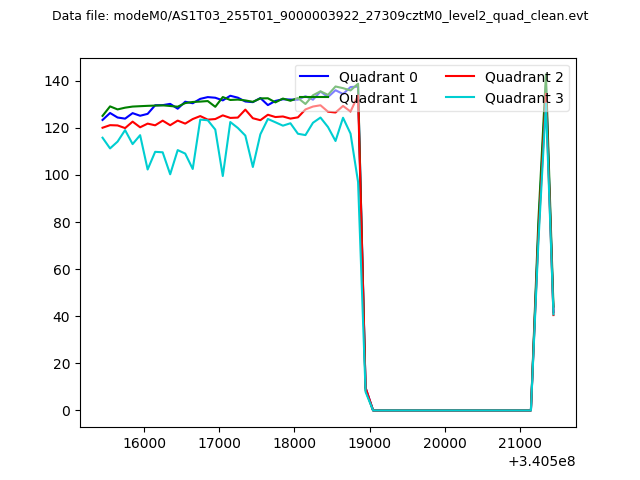 |
|
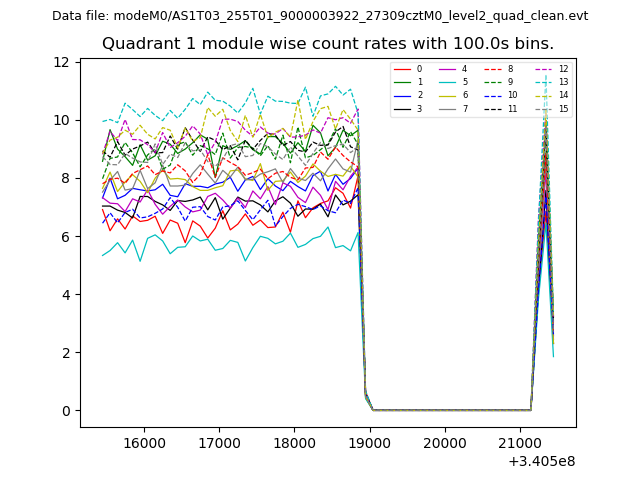
| Module-wise count rates for Quadrant A Data is divided into 100 sec bins |
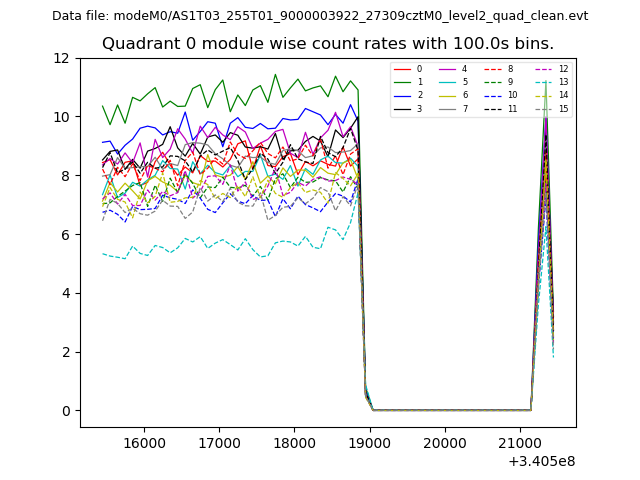 |
 |
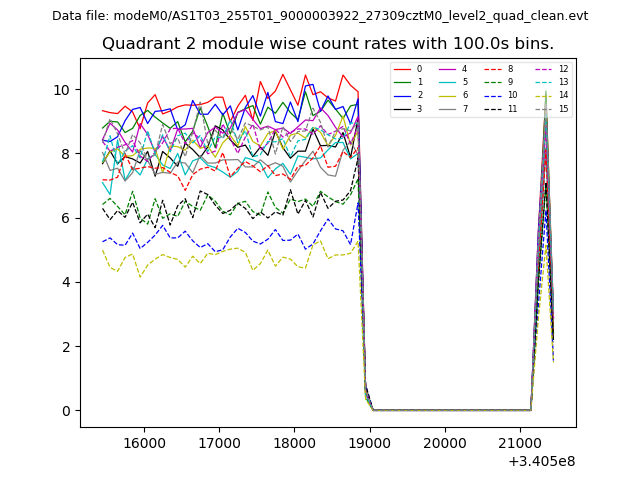
| Module-wise count rates for Quadrant B Data is divided into 100 sec bins |
 |
 |
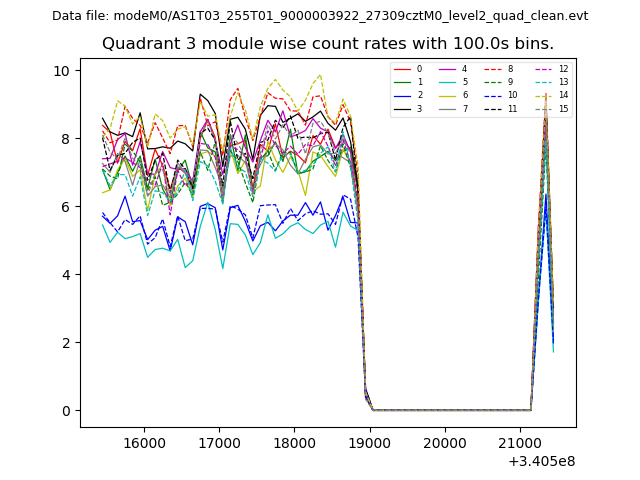
| Module-wise count rates for Quadrant C Data is divided into 100 sec bins |
 |
 |
| Module-wise count rates for Quadrant D Data is divided into 100 sec bins |
 |
 |
| Parameter | Plot |
|---|---|
| CZT HV Monitor | 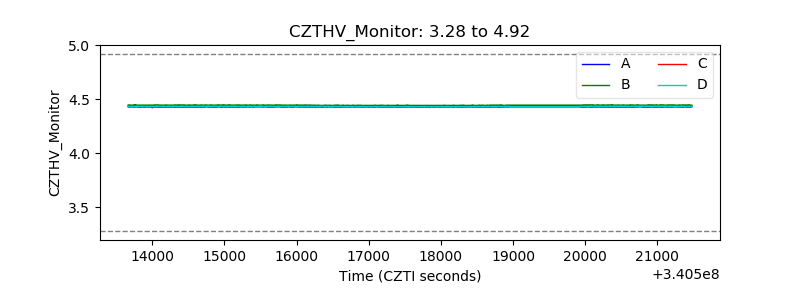 |
| D_VDD | 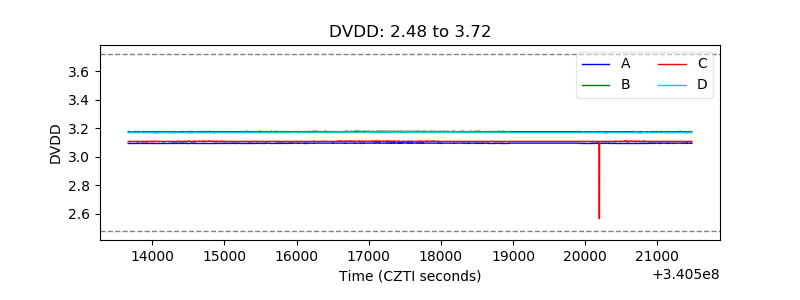 |
| Temperature 1 | 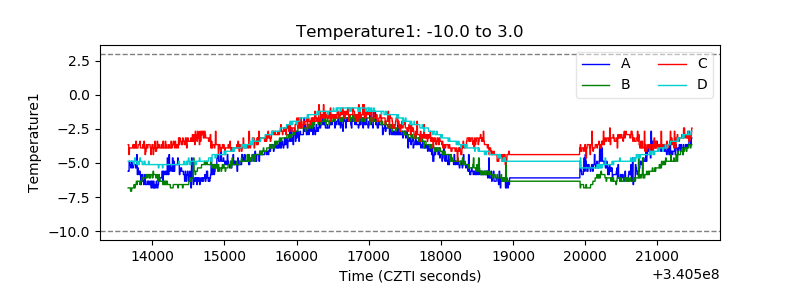 |
| Veto HV Monitor | 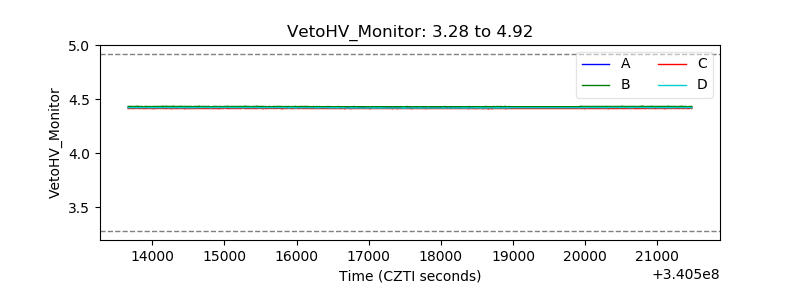 |
| Veto LLD | 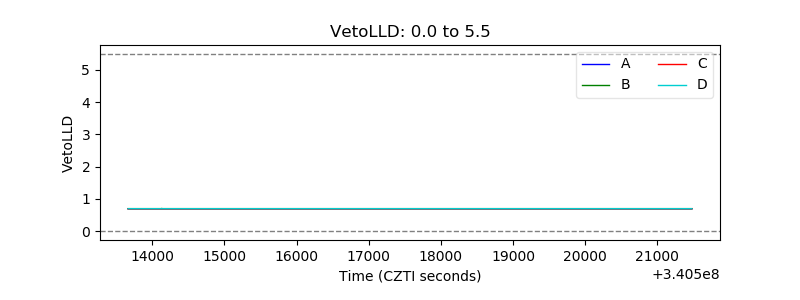 |
| Alpha Counter | 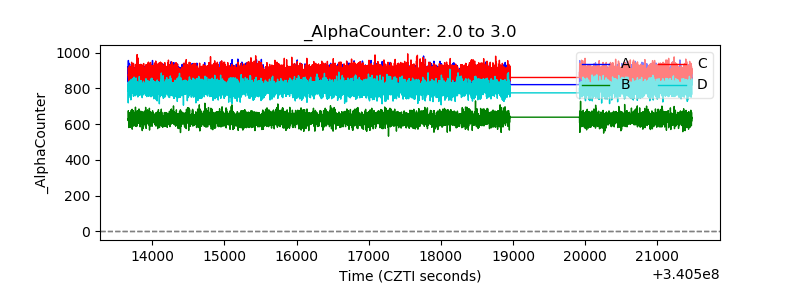 |
| _CPM_Rate |  |
| CZT Counter | 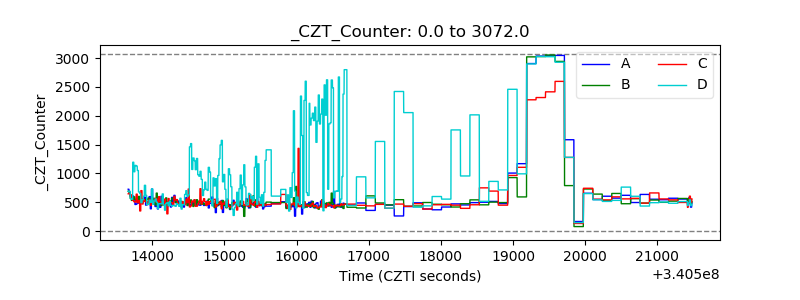 |
| +2.5 Volts monitor |  |
| +5 Volts monitor |  |
| _ROLL_ROT | 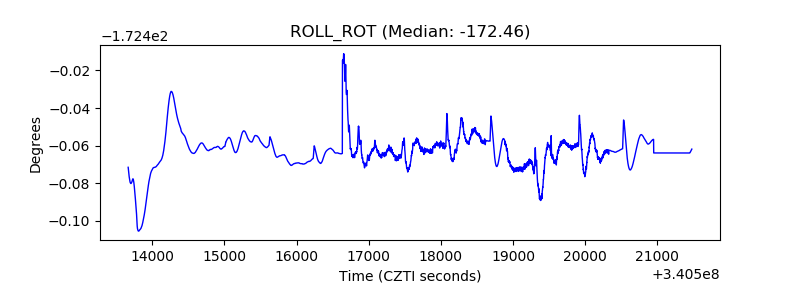 |
| _Roll_DEC | 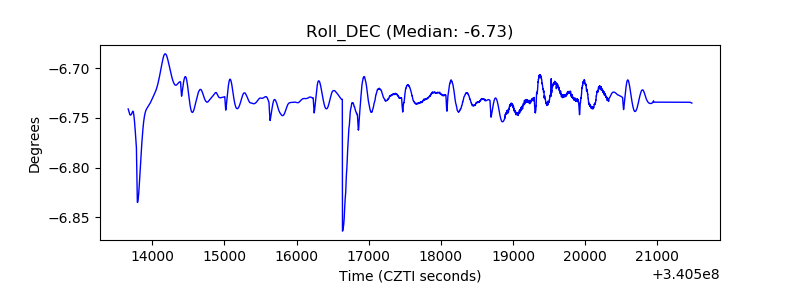 |
| _Roll_RA |  |
| Veto Counter | 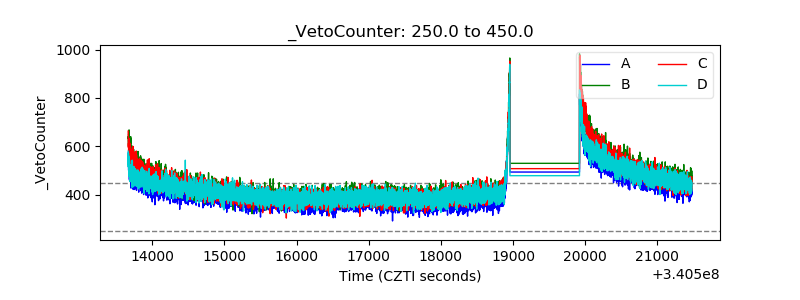 |