| Param | Original file | Final file |
|---|---|---|
| Filename | modeM0/AS1T03_255T01_9000003922_27311cztM0_level2.evt | modeM0/AS1T03_255T01_9000003922_27311cztM0_level2_quad_clean.evt |
| Size (bytes) | 517,590,720 | 85,121,280 |
| Size | 493.6 MB | 81.2 MB |
| Events in quadrant A | 3,393,698 | 550,149 |
| Events in quadrant B | 3,501,349 | 552,360 |
| Events in quadrant C | 3,476,356 | 521,606 |
| Events in quadrant D | 4,863,722 | 500,980 |
| Mode M9 | |||
|---|---|---|---|
| Quadrant | BADHDUFLAG | Total packets | Discarded packets |
| A | 0 | 11 | 0 |
| B | 0 | 11 | 0 |
| C | 0 | 11 | 0 |
| D | 0 | 11 | 0 |
| Mode M0 | |||
|---|---|---|---|
| Quadrant | BADHDUFLAG | Total packets | Discarded packets |
| A | 0 | 14145 | 0 |
| B | 0 | 14480 | 0 |
| C | 0 | 14459 | 0 |
| D | 0 | 18580 | 0 |
| Quadrant | Total seconds | Saturated seconds | Saturation percentage |
|---|---|---|---|
| A | 6485 | 77 | 1.187355% |
| B | 6486 | 100 | 1.541782% |
| C | 6486 | 166 | 2.559359% |
| D | 6486 | 399 | 6.151711% |
Noise dominated data is calculated using 1-second bins in cleaned event files. If a bin has >2000 counts, and if more than 50% of those come from <1% of pixels, then it is considered to be noise-dominated and hence unusable.
| Quadrant | # 1 sec bins | Bins with >0 counts | Bins with >2000 counts | High rate bins dominated by noise | Noise dominated (total time) | Noise dominated (detector-on time) | Marked lightcurve |
|---|---|---|---|---|---|---|---|
| A | 7580 | 6485 | 0 | 0 | 0.00% | 0.00% | 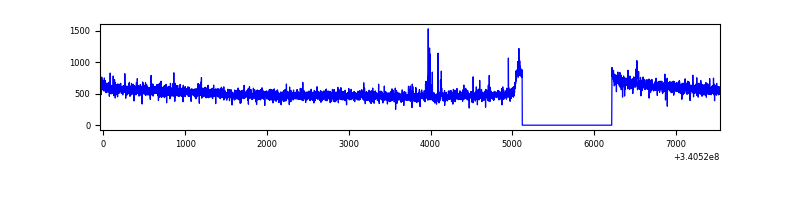 |
| B | 7581 | 6486 | 11 | 11 | 0.15% | 0.17% | 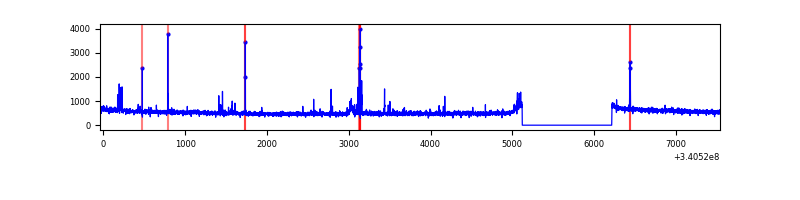 |
| C | 7581 | 6486 | 8 | 8 | 0.11% | 0.12% | 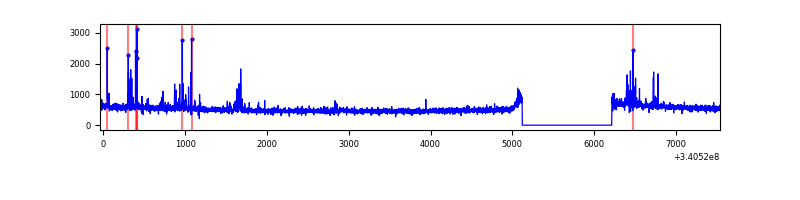 |
| D | 7581 | 6486 | 329 | 329 | 4.34% | 5.07% | 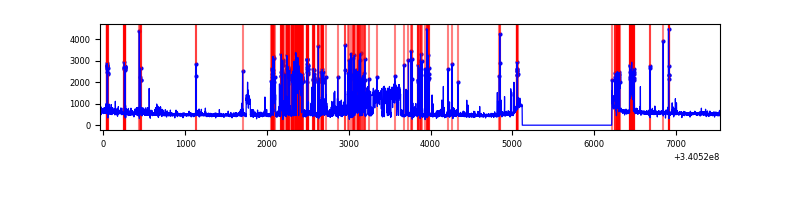 |
Top three noisy pixels from each quadrant. If the there are fewer than three noisy pixels in the level2.evt file, extra rows are filled as -1
| Pixel properties | Quadrant properties | ||||||
|---|---|---|---|---|---|---|---|
| Quadrant | DetID | PixID | Counts | Sigma | Mean | Median | Sigma |
| A | 13 | 248 | 15743 | 85.49 | 874 | 857 | 174.1 |
| A | 13 | 254 | 11488 | 61.05 | 874 | 857 | 174.1 |
| A | 12 | 189 | 10686 | 56.45 | 874 | 857 | 174.1 |
| B | 10 | 245 | 55574 | 332.21 | 860 | 840 | 164.8 |
| B | 10 | 247 | 36513 | 216.52 | 860 | 840 | 164.8 |
| B | 0 | 229 | 21929 | 128.0 | 860 | 840 | 164.8 |
| C | 2 | 16 | 152334 | 794.22 | 818 | 824 | 190.8 |
| C | 14 | 238 | 134029 | 698.27 | 818 | 824 | 190.8 |
| C | 13 | 61 | 5732 | 25.73 | 818 | 824 | 190.8 |
| D | 1 | 52 | 1590768 | 8168.67 | 814 | 796 | 194.6 |
| D | 2 | 250 | 114567 | 584.51 | 814 | 796 | 194.6 |
| D | 12 | 233 | 47434 | 239.61 | 814 | 796 | 194.6 |
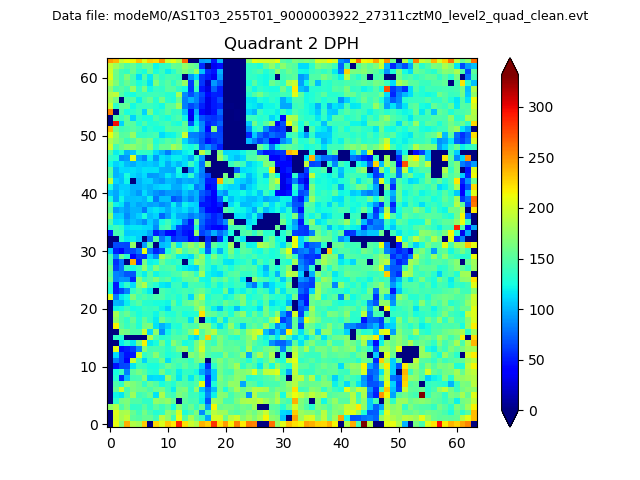
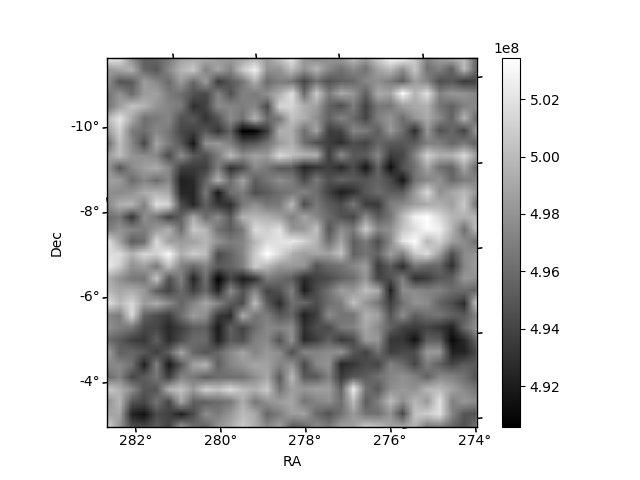
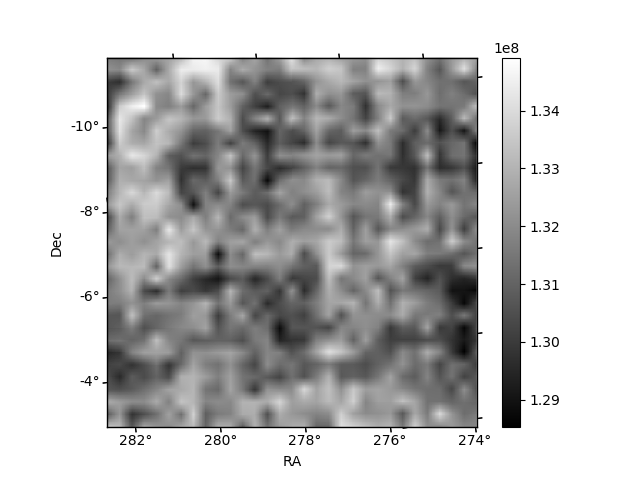
Histogram calculated using DETX and DETY for each event in the final _common_clean file
| Quadrant A | 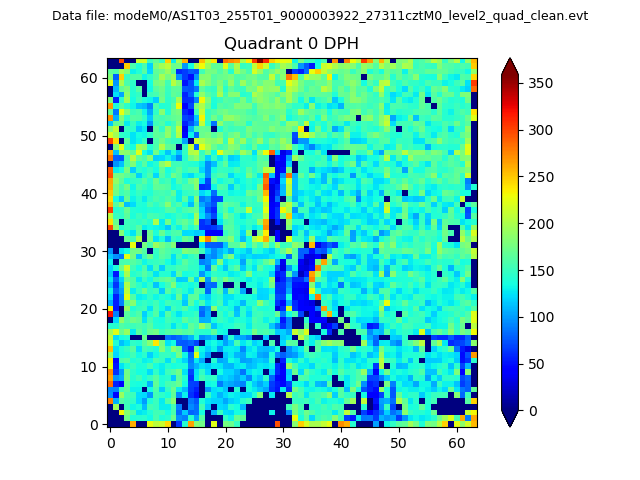 |
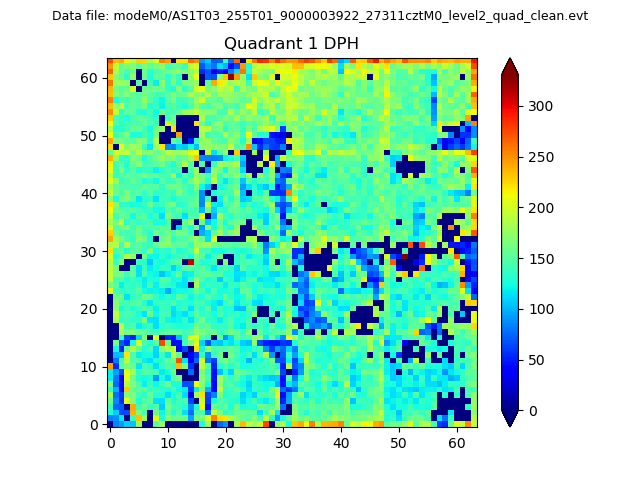 |
Quadrant B |
|---|---|---|---|
| Quadrant D | 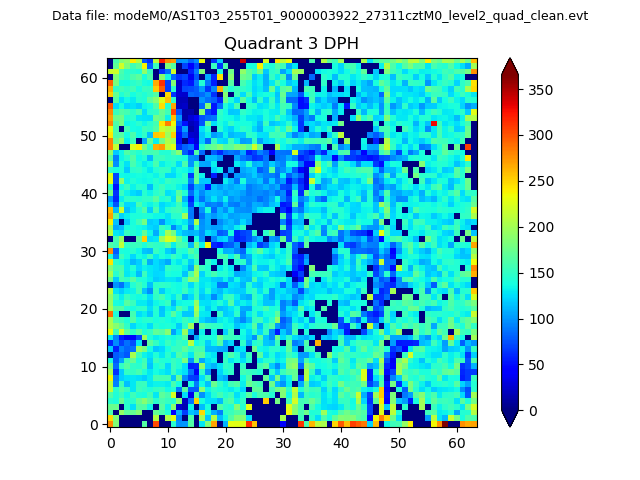 |
 |
Quadrant C |
| Plot type | Count rate plots | Images |
|---|---|---|
| Comparison with Poisson distribution Blue bars denote a histogram of data divided into 1 sec bins. Red curve is a Poisson curve with rate = median count rate of data. |
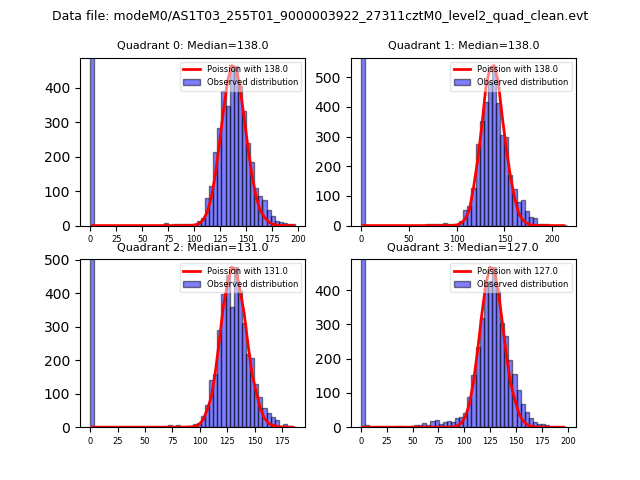 |
 |
| Quadrant-wise count rates Data is divided into 100 sec bins |
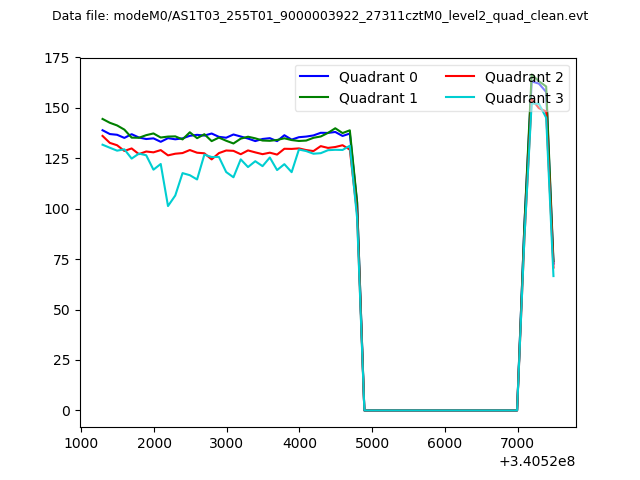 |
|
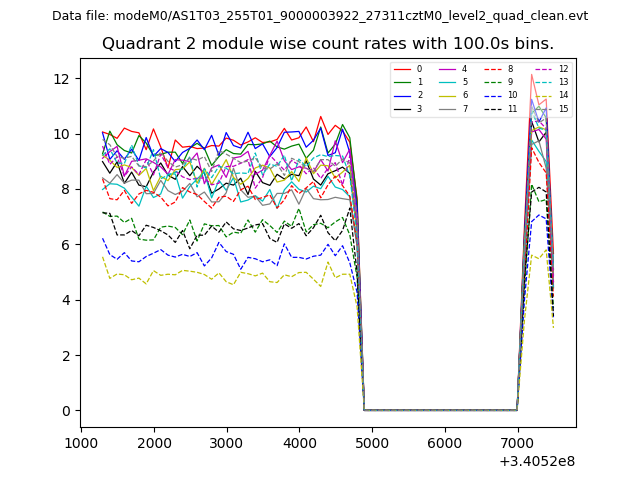
| Module-wise count rates for Quadrant A Data is divided into 100 sec bins |
 |
 |
| Module-wise count rates for Quadrant B Data is divided into 100 sec bins |
 |
 |
| Module-wise count rates for Quadrant C Data is divided into 100 sec bins |
 |
 |
| Module-wise count rates for Quadrant D Data is divided into 100 sec bins |
 |
 |
| Parameter | Plot |
|---|---|
| CZT HV Monitor | 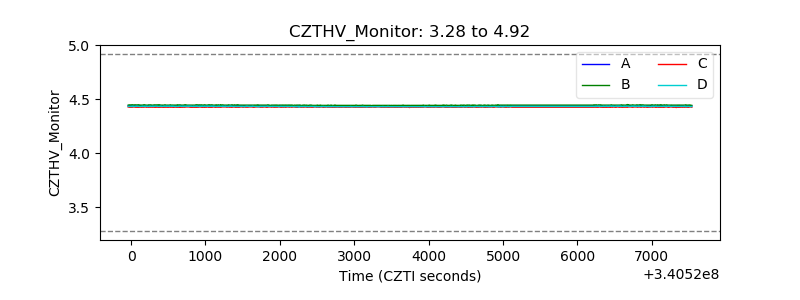 |
| D_VDD | 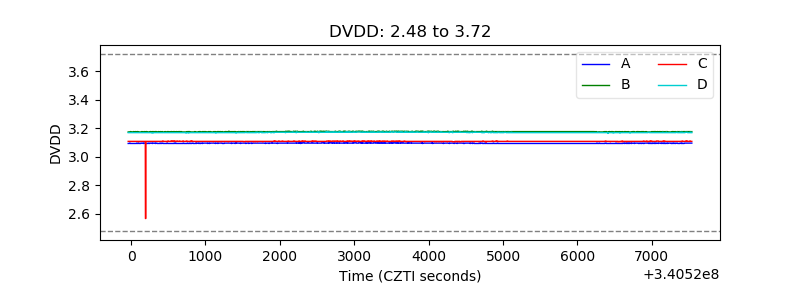 |
| Temperature 1 | 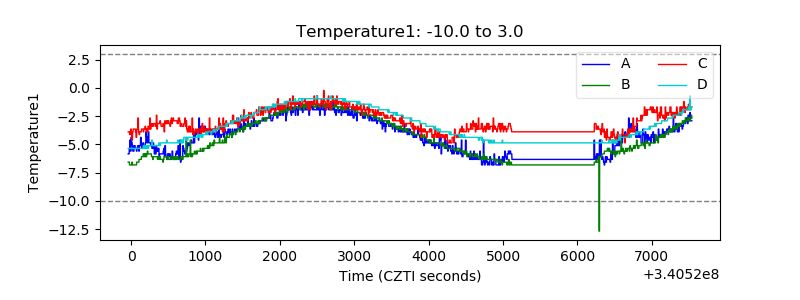 |
| Veto HV Monitor | 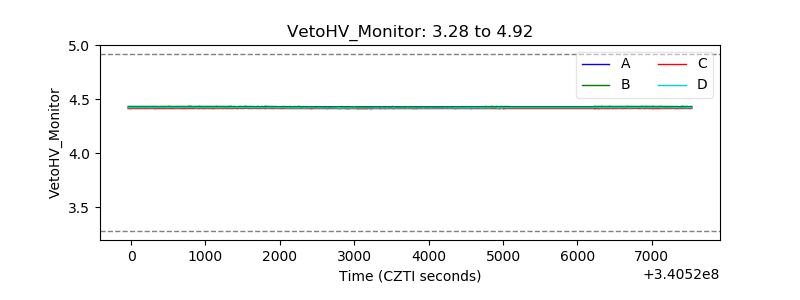 |
| Veto LLD | 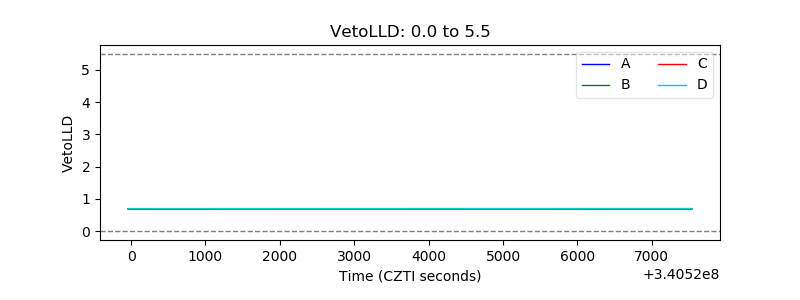 |
| Alpha Counter | 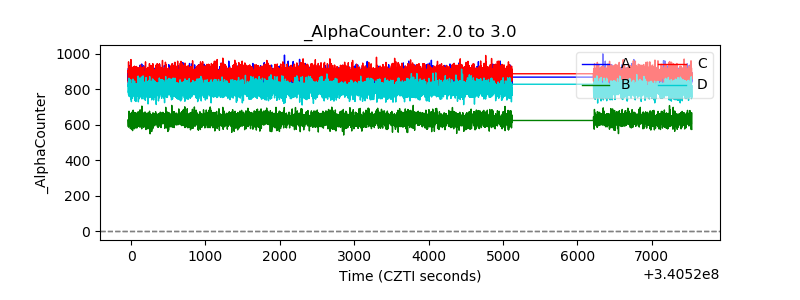 |
| _CPM_Rate | 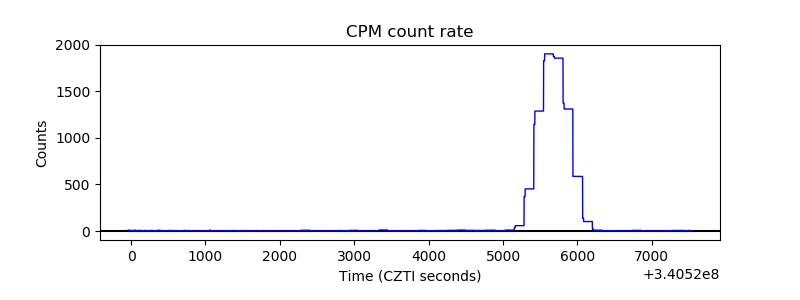 |
| CZT Counter | 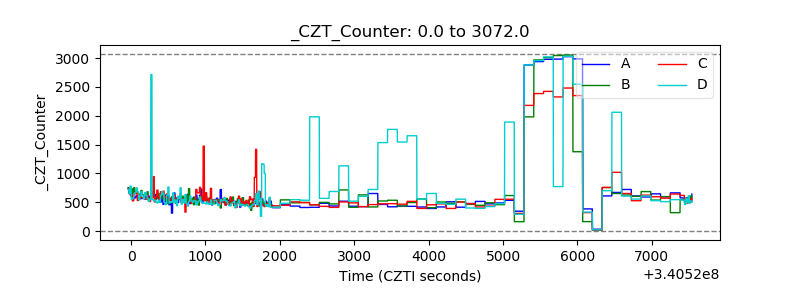 |
| +2.5 Volts monitor |  |
| +5 Volts monitor |  |
| _ROLL_ROT |  |
| _Roll_DEC |  |
| _Roll_RA | 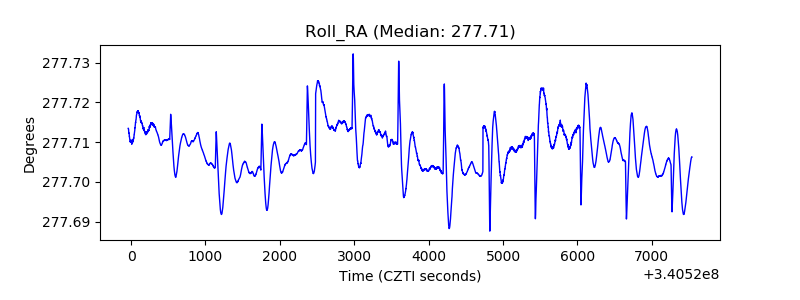 |
| Veto Counter |  |