| Param | Original file | Final file |
|---|---|---|
| Filename | modeM0/AS1T03_255T01_9000003922_27312cztM0_level2.evt | modeM0/AS1T03_255T01_9000003922_27312cztM0_level2_quad_clean.evt |
| Size (bytes) | 523,912,320 | 99,144,000 |
| Size | 499.6 MB | 94.6 MB |
| Events in quadrant A | 3,500,497 | 665,099 |
| Events in quadrant B | 3,680,525 | 664,479 |
| Events in quadrant C | 3,544,541 | 621,434 |
| Events in quadrant D | 4,713,048 | 611,166 |
| Mode M9 | |||
|---|---|---|---|
| Quadrant | BADHDUFLAG | Total packets | Discarded packets |
| A | 0 | 13 | 0 |
| B | 0 | 14 | 0 |
| C | 0 | 14 | 0 |
| D | 0 | 14 | 0 |
| Mode M0 | |||
|---|---|---|---|
| Quadrant | BADHDUFLAG | Total packets | Discarded packets |
| A | 0 | 14582 | 0 |
| B | 0 | 15095 | 0 |
| C | 0 | 14695 | 0 |
| D | 0 | 18056 | 0 |
| Quadrant | Total seconds | Saturated seconds | Saturation percentage |
|---|---|---|---|
| A | 6321 | 87 | 1.376364% |
| B | 6320 | 161 | 2.547468% |
| C | 6320 | 171 | 2.705696% |
| D | 6320 | 483 | 7.642405% |
Noise dominated data is calculated using 1-second bins in cleaned event files. If a bin has >2000 counts, and if more than 50% of those come from <1% of pixels, then it is considered to be noise-dominated and hence unusable.
| Quadrant | # 1 sec bins | Bins with >0 counts | Bins with >2000 counts | High rate bins dominated by noise | Noise dominated (total time) | Noise dominated (detector-on time) | Marked lightcurve |
|---|---|---|---|---|---|---|---|
| A | 7541 | 6321 | 1 | 1 | 0.01% | 0.02% | 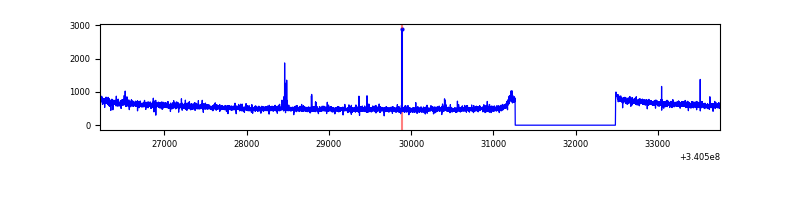 |
| B | 7540 | 6320 | 43 | 43 | 0.57% | 0.68% | 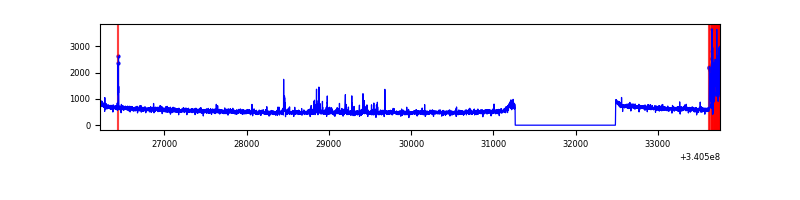 |
| C | 7540 | 6320 | 11 | 11 | 0.15% | 0.17% | 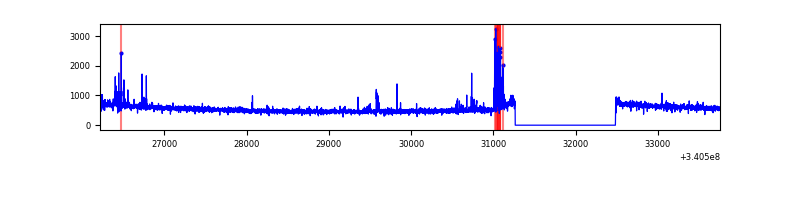 |
| D | 7540 | 6320 | 323 | 323 | 4.28% | 5.11% | 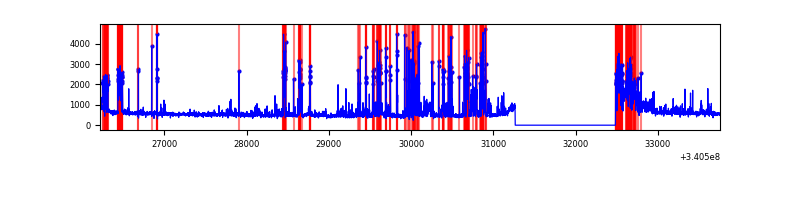 |
Top three noisy pixels from each quadrant. If the there are fewer than three noisy pixels in the level2.evt file, extra rows are filled as -1
| Pixel properties | Quadrant properties | ||||||
|---|---|---|---|---|---|---|---|
| Quadrant | DetID | PixID | Counts | Sigma | Mean | Median | Sigma |
| A | 13 | 248 | 20011 | 107.68 | 901 | 888 | 177.6 |
| A | 13 | 254 | 10591 | 54.64 | 901 | 888 | 177.6 |
| A | 12 | 189 | 10338 | 53.21 | 901 | 888 | 177.6 |
| B | 10 | 245 | 164335 | 981.27 | 880 | 860 | 166.6 |
| B | 15 | 32 | 52739 | 311.41 | 880 | 860 | 166.6 |
| B | 12 | 111 | 19264 | 110.47 | 880 | 860 | 166.6 |
| C | 2 | 16 | 154975 | 792.64 | 834 | 841 | 194.5 |
| C | 14 | 238 | 135230 | 691.1 | 834 | 841 | 194.5 |
| C | 13 | 61 | 5685 | 24.91 | 834 | 841 | 194.5 |
| D | 1 | 52 | 823268 | 4112.75 | 836 | 819 | 200.0 |
| D | 6 | 112 | 367812 | 1835.19 | 836 | 819 | 200.0 |
| D | 2 | 250 | 237079 | 1181.45 | 836 | 819 | 200.0 |
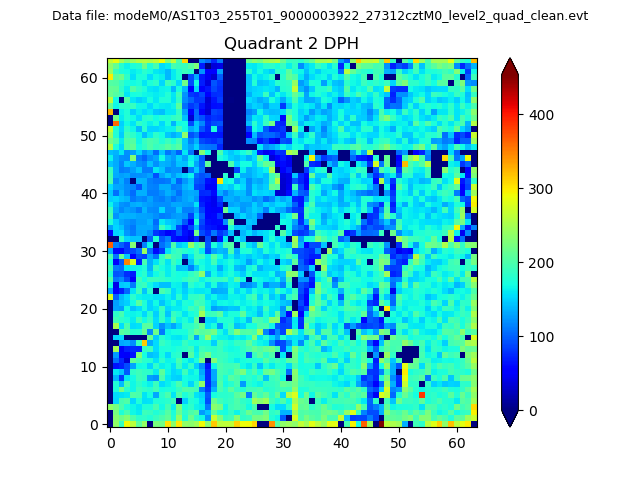
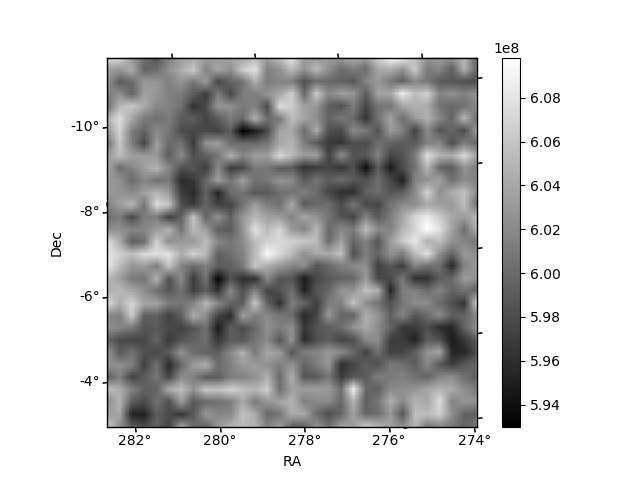
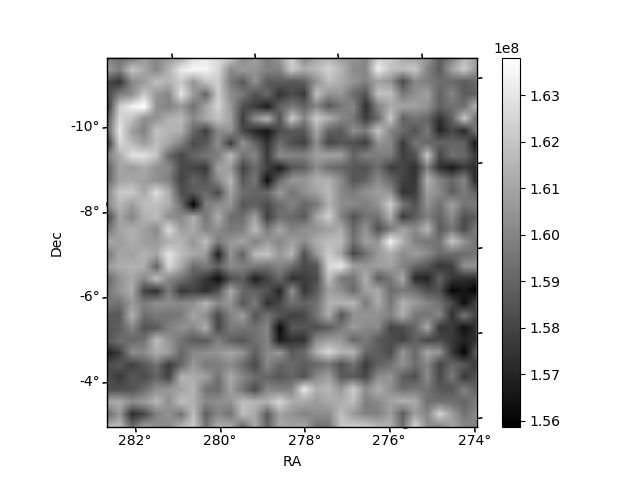
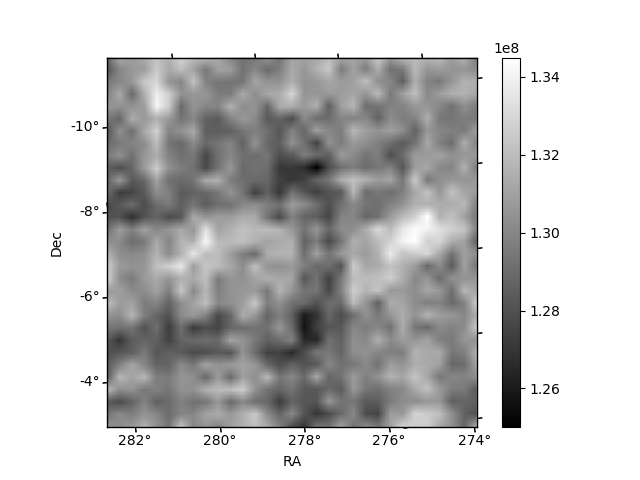
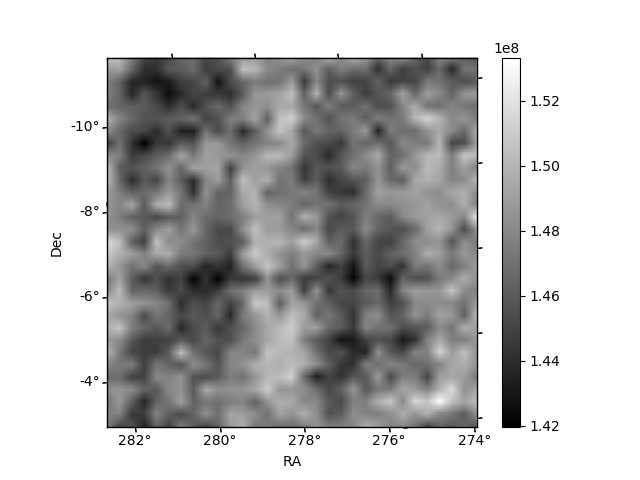
Histogram calculated using DETX and DETY for each event in the final _common_clean file
| Quadrant A | 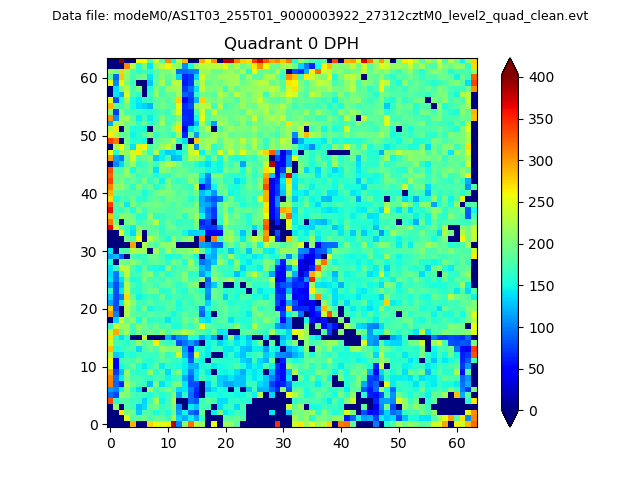 |
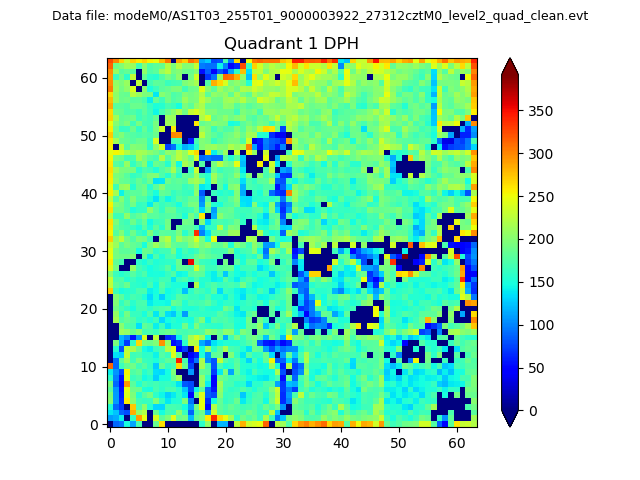 |
Quadrant B |
|---|---|---|---|
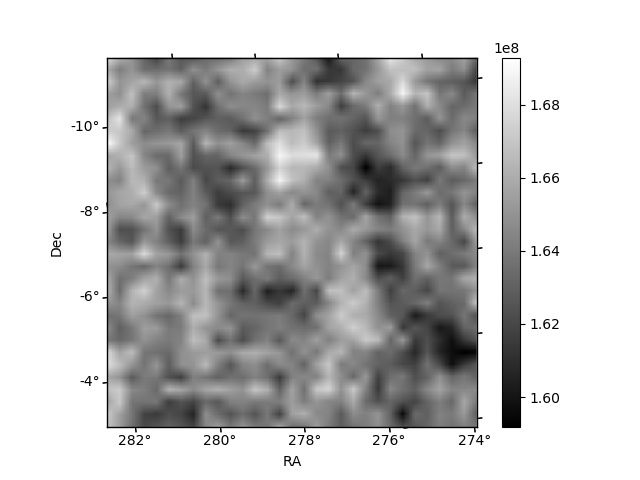
| Quadrant D | 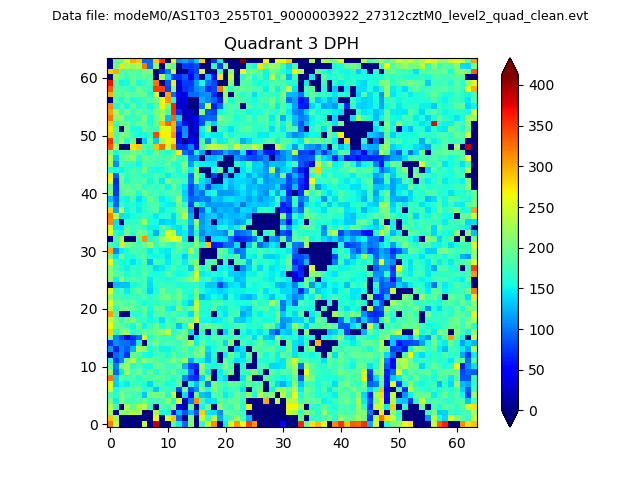 |
 |
Quadrant C |
| Plot type | Count rate plots | Images |
|---|---|---|
| Comparison with Poisson distribution Blue bars denote a histogram of data divided into 1 sec bins. Red curve is a Poisson curve with rate = median count rate of data. |
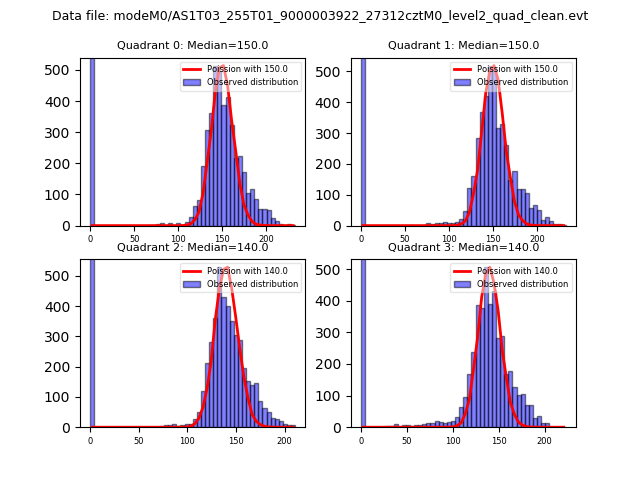 |
 |
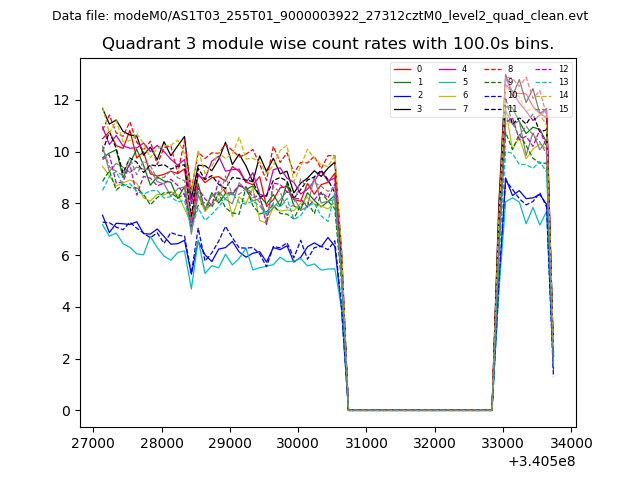
| Quadrant-wise count rates Data is divided into 100 sec bins |
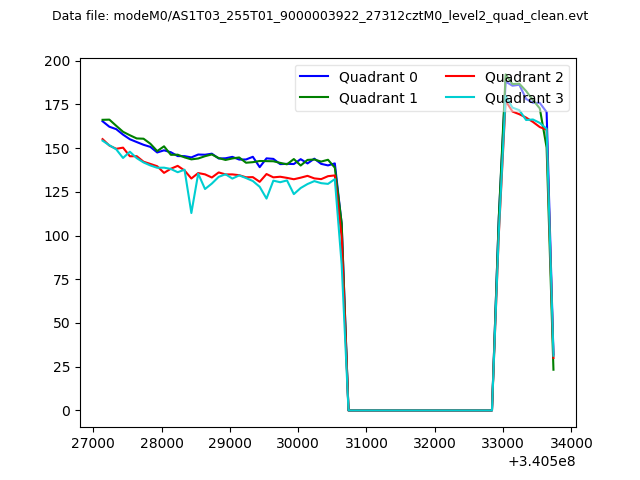 |
|
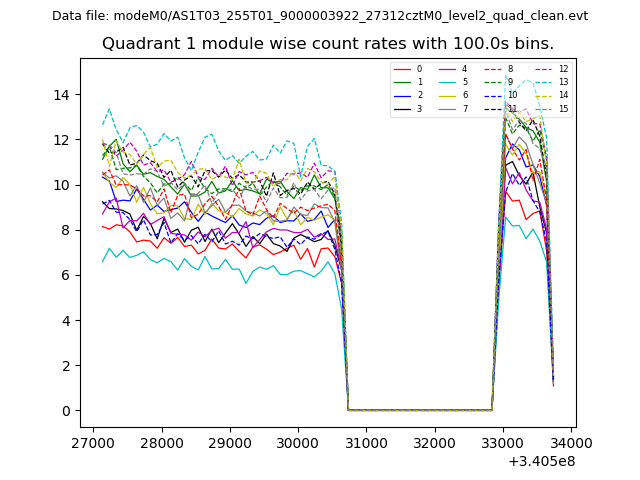
| Module-wise count rates for Quadrant A Data is divided into 100 sec bins |
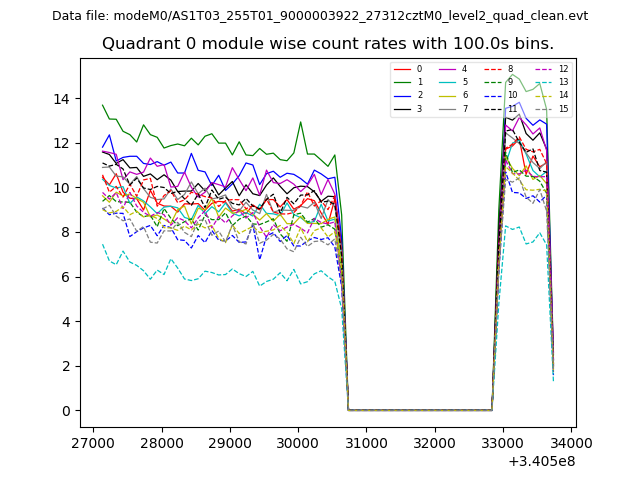 |
 |
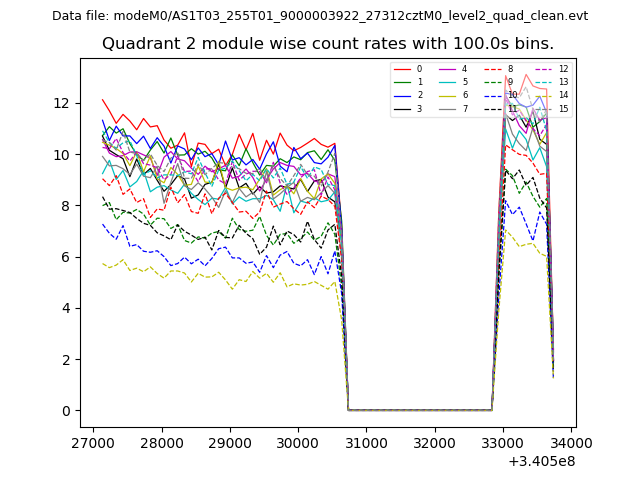
| Module-wise count rates for Quadrant B Data is divided into 100 sec bins |
 |
 |
| Module-wise count rates for Quadrant C Data is divided into 100 sec bins |
 |
 |
| Module-wise count rates for Quadrant D Data is divided into 100 sec bins |
 |
 |
| Parameter | Plot |
|---|---|
| CZT HV Monitor | 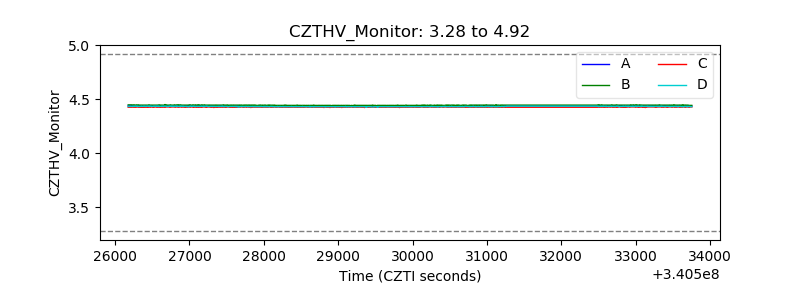 |
| D_VDD | 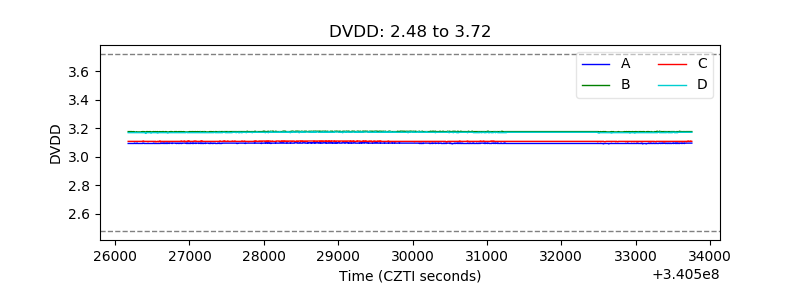 |
| Temperature 1 |  |
| Veto HV Monitor | 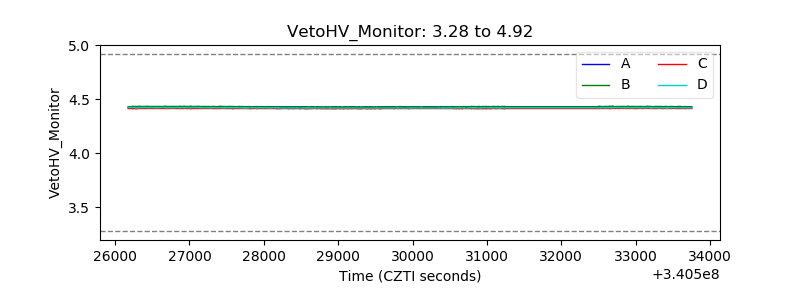 |
| Veto LLD |  |
| Alpha Counter | 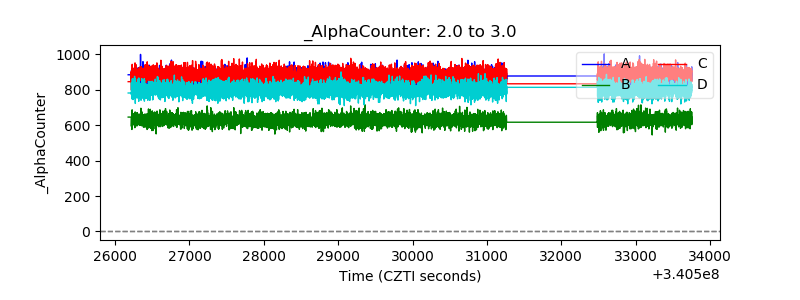 |
| _CPM_Rate | 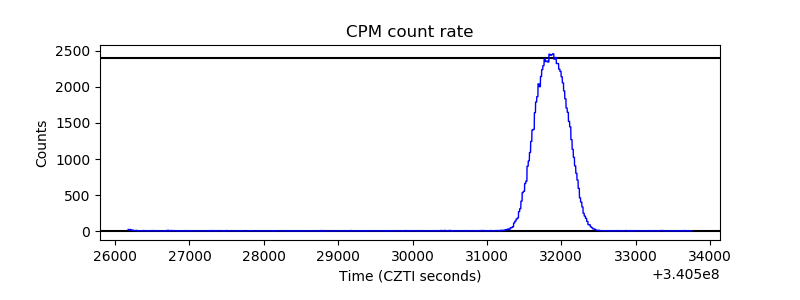 |
| CZT Counter | 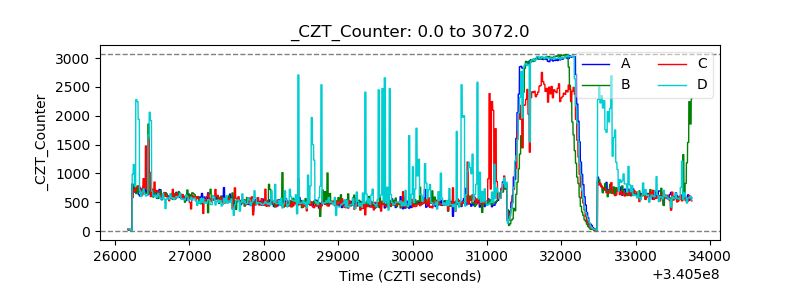 |
| +2.5 Volts monitor |  |
| +5 Volts monitor |  |
| _ROLL_ROT | 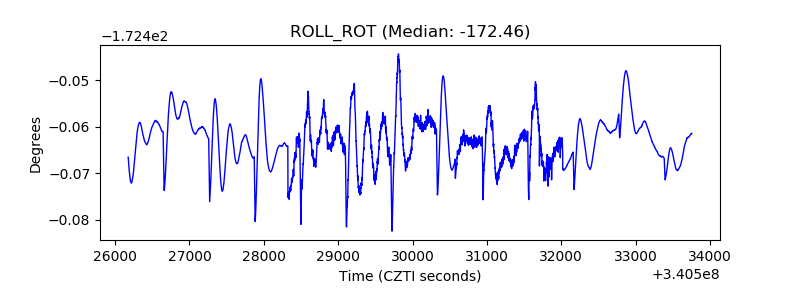 |
| _Roll_DEC |  |
| _Roll_RA | 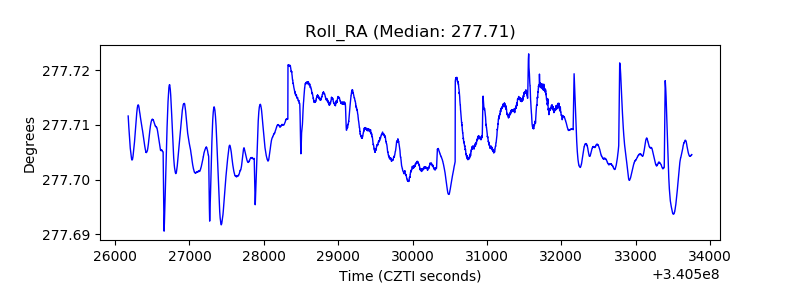 |
| Veto Counter | 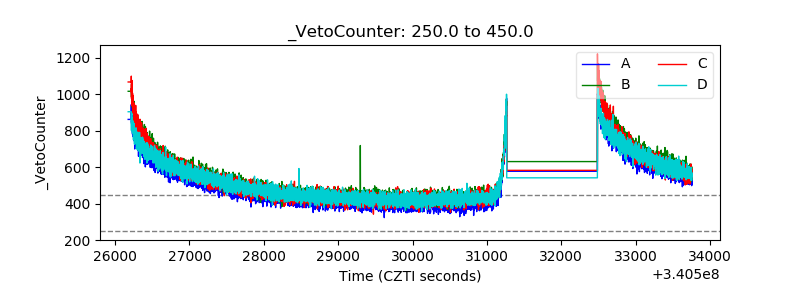 |