| Param | Original file | Final file |
|---|---|---|
| Filename | modeM0/AS1T03_255T01_9000003922_27313cztM0_level2.evt | modeM0/AS1T03_255T01_9000003922_27313cztM0_level2_quad_clean.evt |
| Size (bytes) | 531,423,360 | 114,039,360 |
| Size | 506.8 MB | 108.8 MB |
| Events in quadrant A | 3,372,121 | 797,913 |
| Events in quadrant B | 4,811,023 | 773,051 |
| Events in quadrant C | 3,324,452 | 737,341 |
| Events in quadrant D | 4,182,085 | 728,447 |
| Mode M9 | |||
|---|---|---|---|
| Quadrant | BADHDUFLAG | Total packets | Discarded packets |
| A | 0 | 13 | 0 |
| B | 0 | 13 | 0 |
| C | 0 | 13 | 0 |
| D | 0 | 13 | 0 |
| Mode M0 | |||
|---|---|---|---|
| Quadrant | BADHDUFLAG | Total packets | Discarded packets |
| A | 0 | 14006 | 0 |
| B | 0 | 18466 | 0 |
| C | 0 | 13776 | 0 |
| D | 0 | 16364 | 0 |
| Quadrant | Total seconds | Saturated seconds | Saturation percentage |
|---|---|---|---|
| A | 5968 | 88 | 1.474531% |
| B | 5969 | 474 | 7.941029% |
| C | 5969 | 126 | 2.110906% |
| D | 5969 | 266 | 4.456358% |
Noise dominated data is calculated using 1-second bins in cleaned event files. If a bin has >2000 counts, and if more than 50% of those come from <1% of pixels, then it is considered to be noise-dominated and hence unusable.
| Quadrant | # 1 sec bins | Bins with >0 counts | Bins with >2000 counts | High rate bins dominated by noise | Noise dominated (total time) | Noise dominated (detector-on time) | Marked lightcurve |
|---|---|---|---|---|---|---|---|
| A | 7263 | 5969 | 1 | 1 | 0.01% | 0.02% | 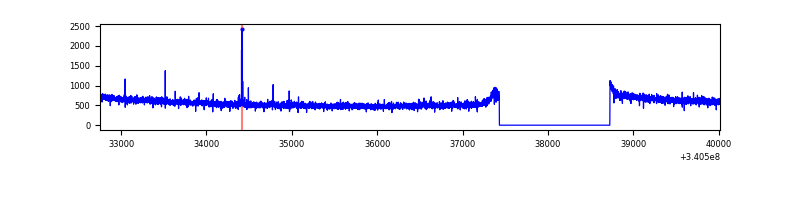 |
| B | 7264 | 5969 | 326 | 326 | 4.49% | 5.46% | 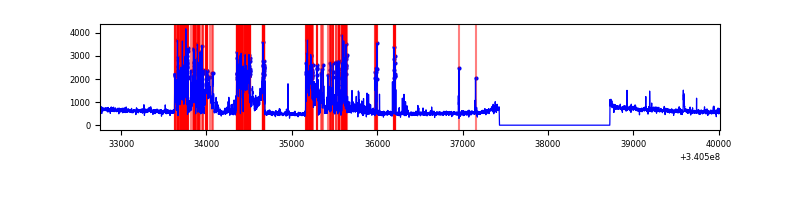 |
| C | 7264 | 5969 | 0 | 0 | 0.00% | 0.00% | 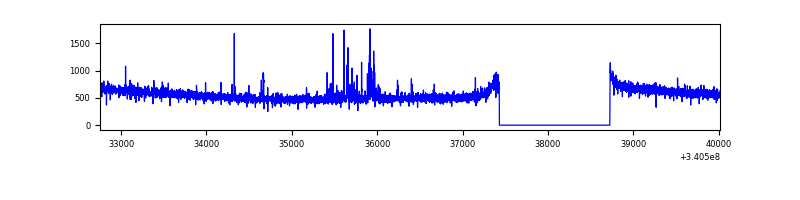 |
| D | 7264 | 5969 | 186 | 186 | 2.56% | 3.12% | 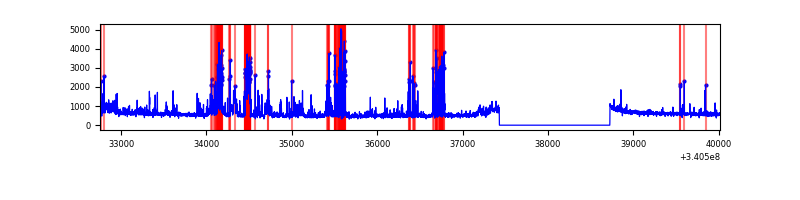 |
Top three noisy pixels from each quadrant. If the there are fewer than three noisy pixels in the level2.evt file, extra rows are filled as -1
| Pixel properties | Quadrant properties | ||||||
|---|---|---|---|---|---|---|---|
| Quadrant | DetID | PixID | Counts | Sigma | Mean | Median | Sigma |
| A | 13 | 248 | 21322 | 119.05 | 868 | 857 | 171.9 |
| A | 13 | 254 | 9933 | 52.8 | 868 | 857 | 171.9 |
| A | 0 | 226 | 7699 | 39.8 | 868 | 857 | 171.9 |
| B | 10 | 245 | 1524167 | 9677.06 | 832 | 814 | 157.4 |
| B | 0 | 190 | 22012 | 134.66 | 832 | 814 | 157.4 |
| B | 12 | 111 | 17895 | 108.51 | 832 | 814 | 157.4 |
| C | 14 | 238 | 131025 | 701.89 | 799 | 805 | 185.5 |
| C | 2 | 16 | 70525 | 375.79 | 799 | 805 | 185.5 |
| C | 15 | 208 | 10920 | 54.52 | 799 | 805 | 185.5 |
| D | 1 | 52 | 854846 | 4144.03 | 812 | 796 | 206.1 |
| D | 2 | 250 | 194814 | 941.42 | 812 | 796 | 206.1 |
| D | 12 | 233 | 41280 | 196.44 | 812 | 796 | 206.1 |
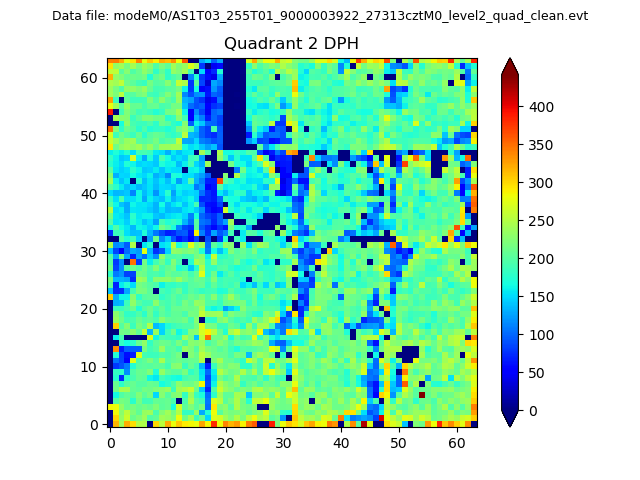
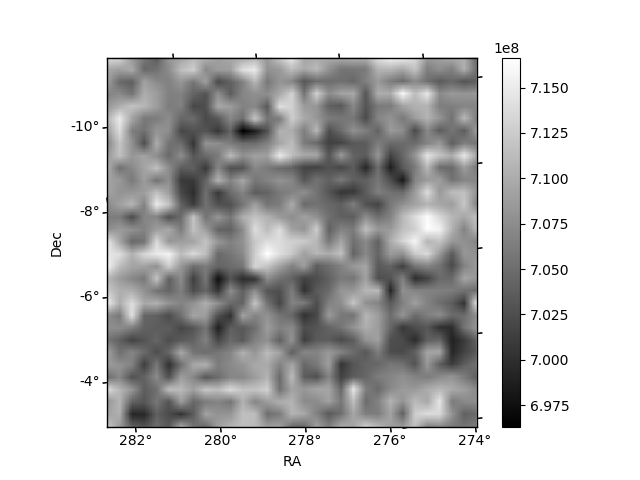
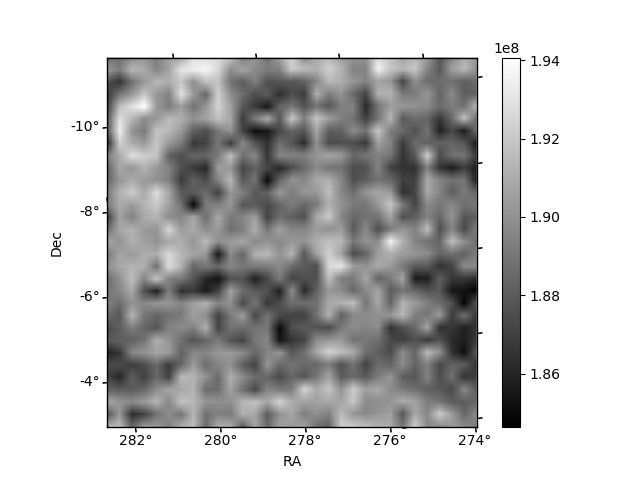
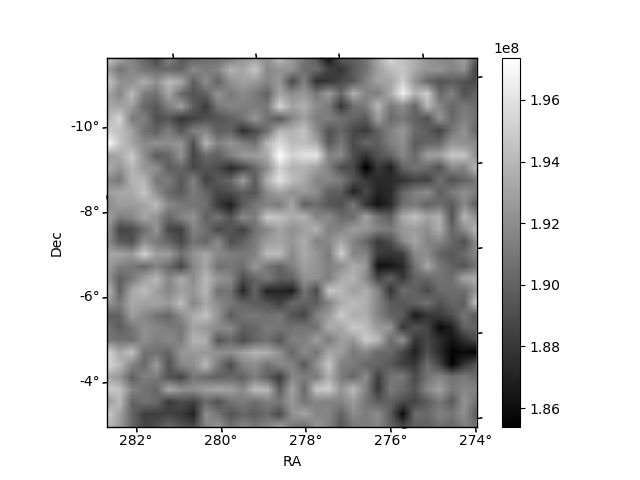
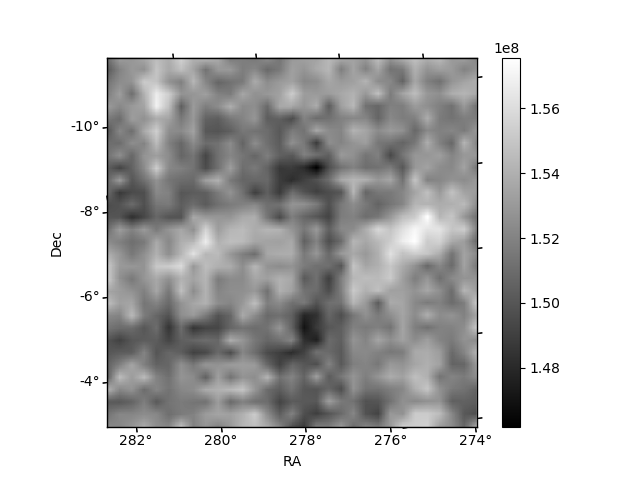
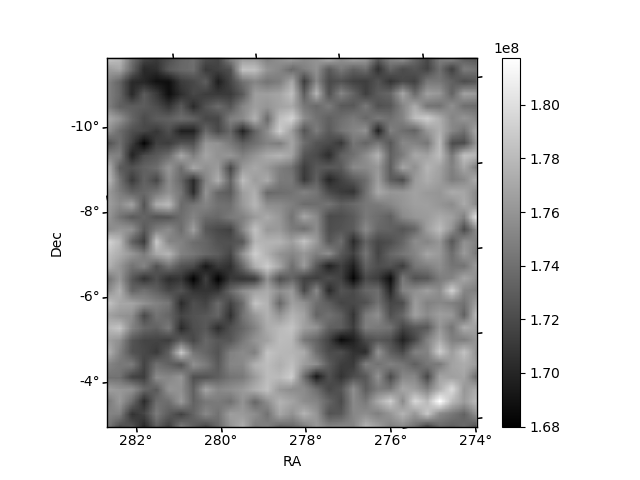
Histogram calculated using DETX and DETY for each event in the final _common_clean file
| Quadrant A | 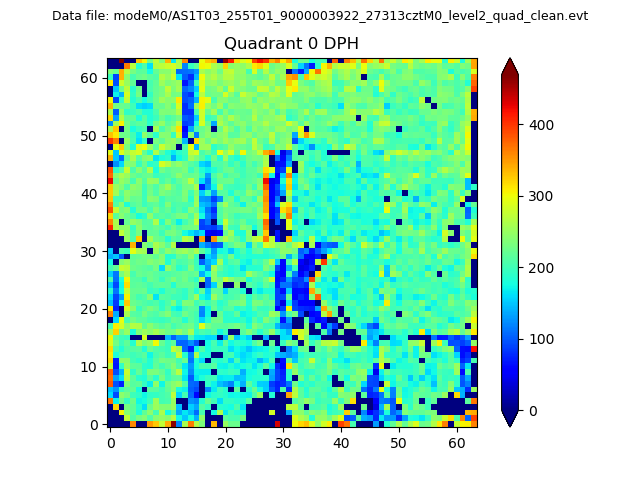 |
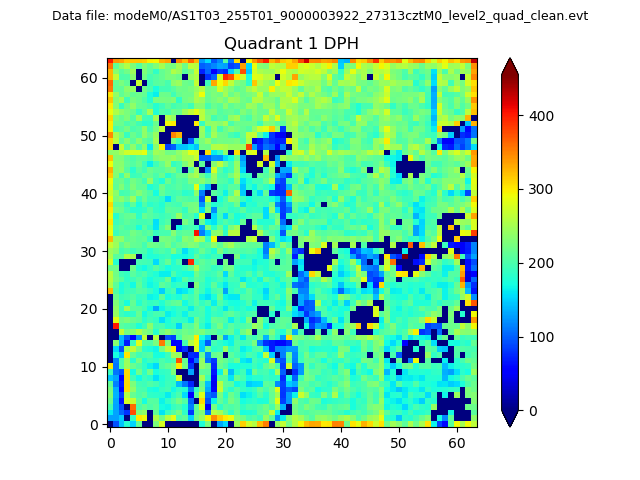 |
Quadrant B |
|---|---|---|---|
| Quadrant D | 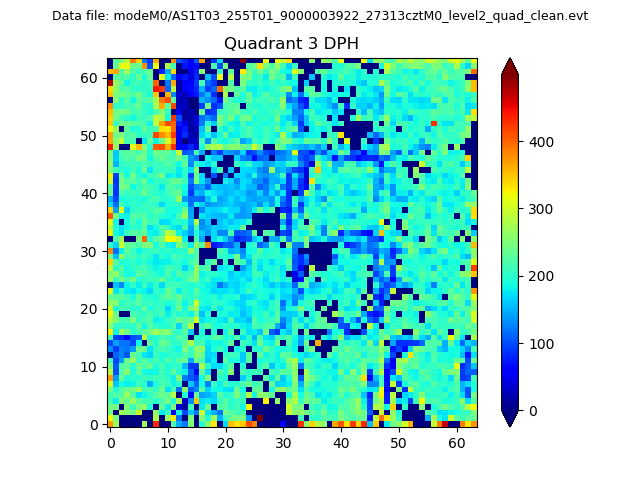 |
 |
Quadrant C |
| Plot type | Count rate plots | Images |
|---|---|---|
| Comparison with Poisson distribution Blue bars denote a histogram of data divided into 1 sec bins. Red curve is a Poisson curve with rate = median count rate of data. |
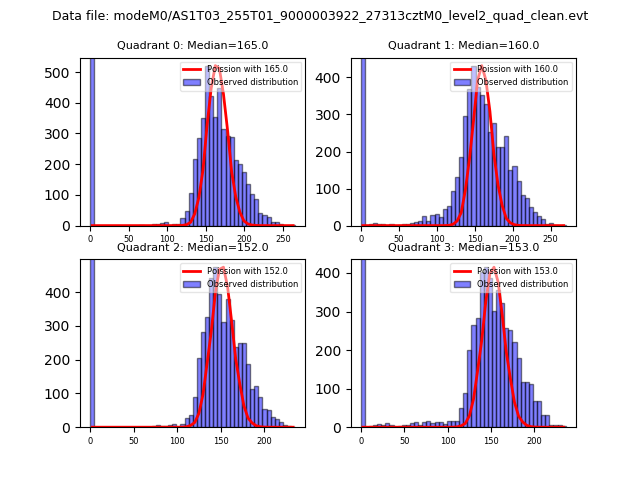 |
 |
| Quadrant-wise count rates Data is divided into 100 sec bins |
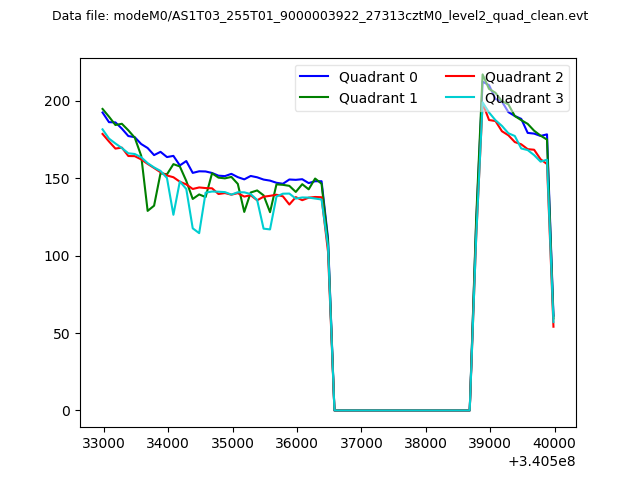 |
|
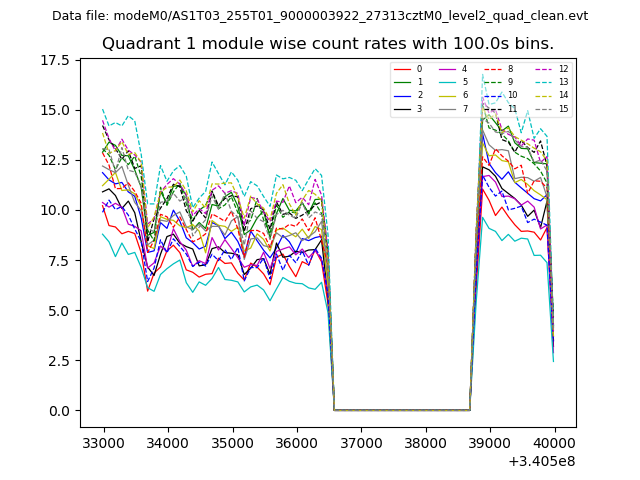
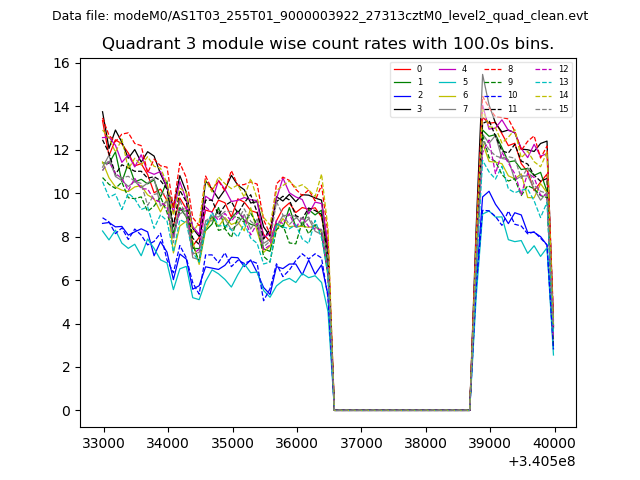
| Module-wise count rates for Quadrant A Data is divided into 100 sec bins |
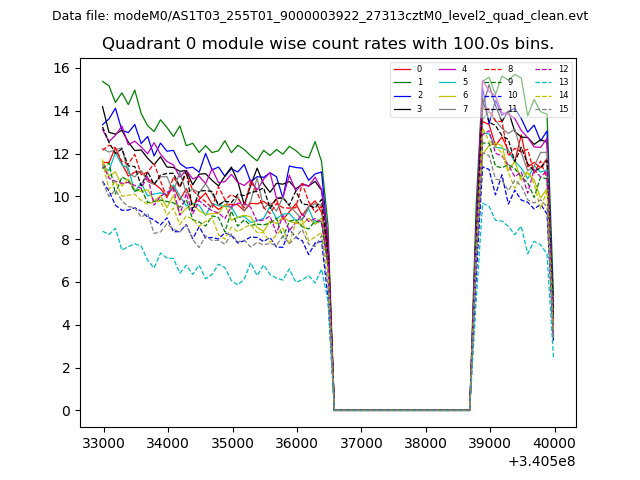 |
 |
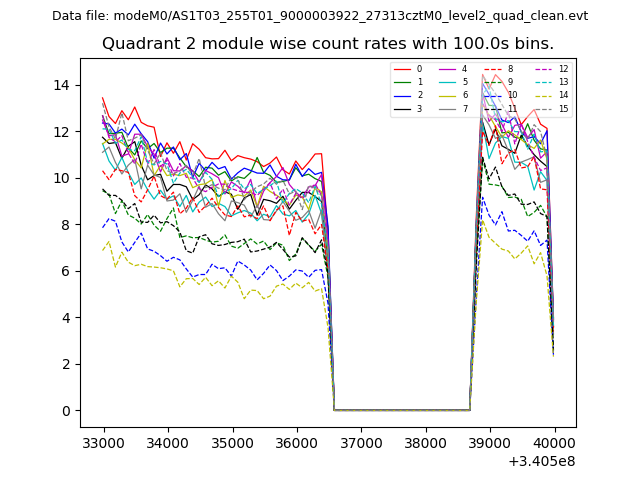
| Module-wise count rates for Quadrant B Data is divided into 100 sec bins |
 |
 |
| Module-wise count rates for Quadrant C Data is divided into 100 sec bins |
 |
 |
| Module-wise count rates for Quadrant D Data is divided into 100 sec bins |
 |
 |
| Parameter | Plot |
|---|---|
| CZT HV Monitor | 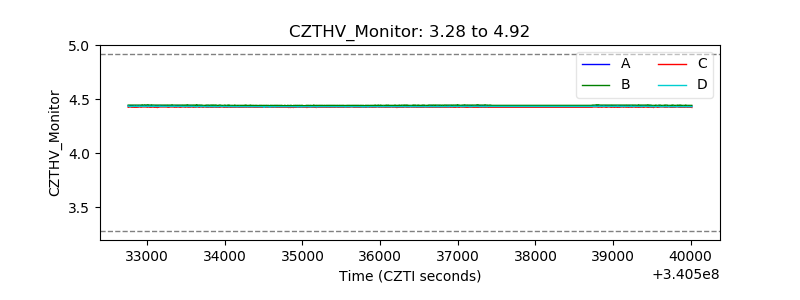 |
| D_VDD | 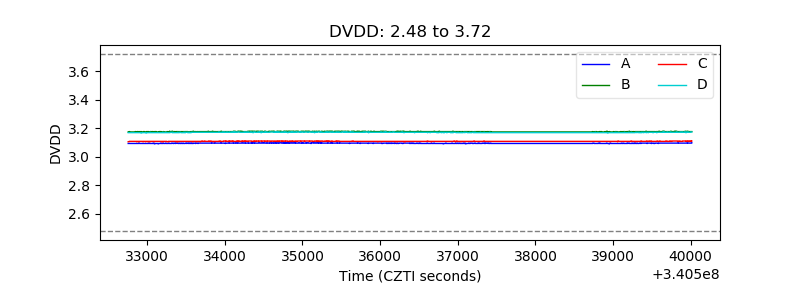 |
| Temperature 1 | 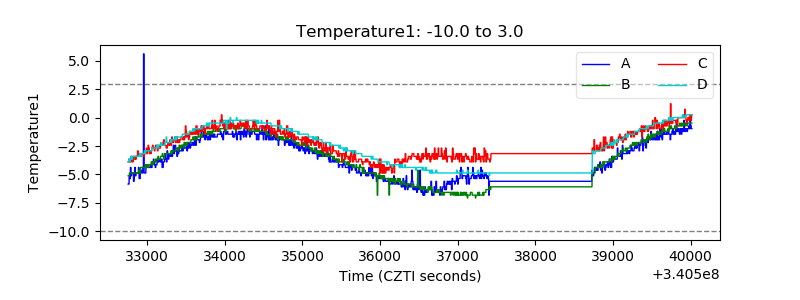 |
| Veto HV Monitor | 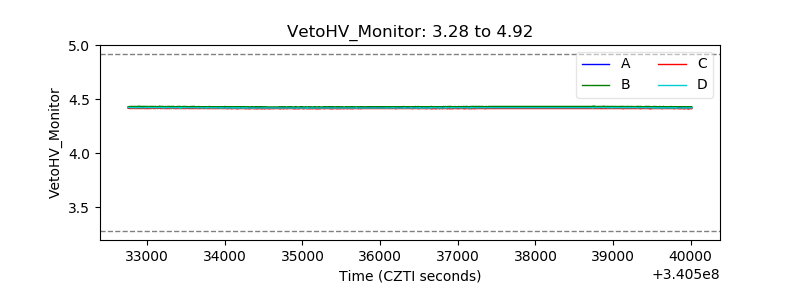 |
| Veto LLD | 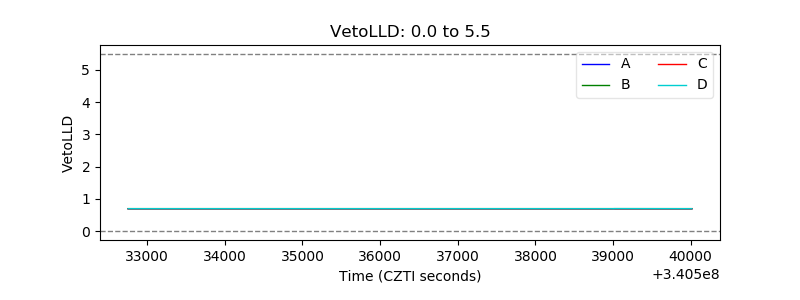 |
| Alpha Counter | 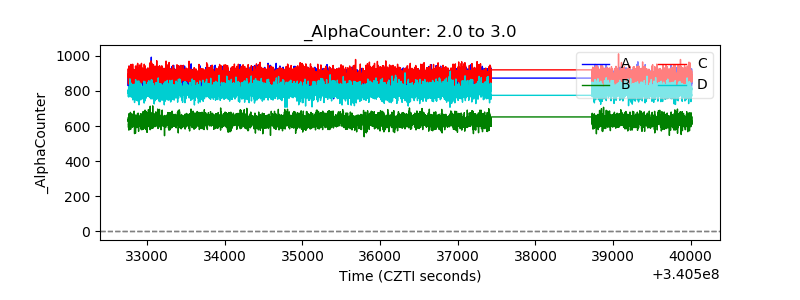 |
| _CPM_Rate | 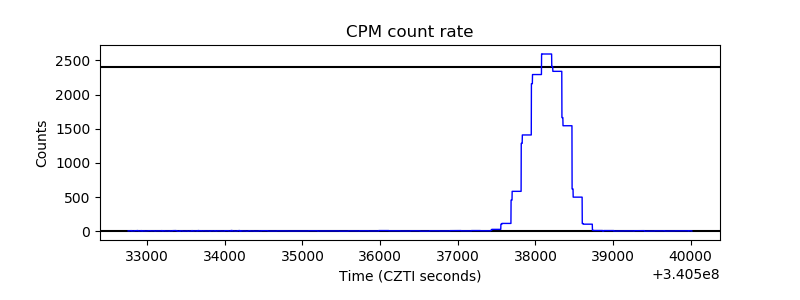 |
| CZT Counter | 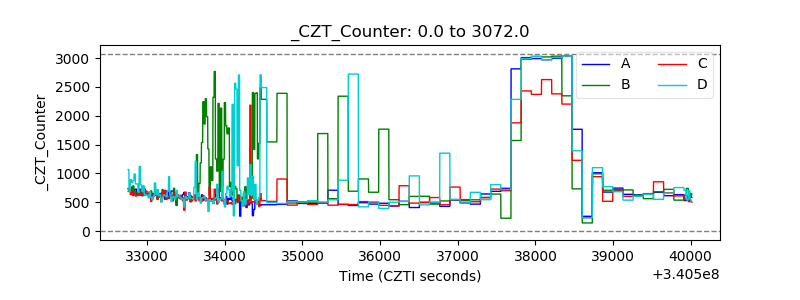 |
| +2.5 Volts monitor | 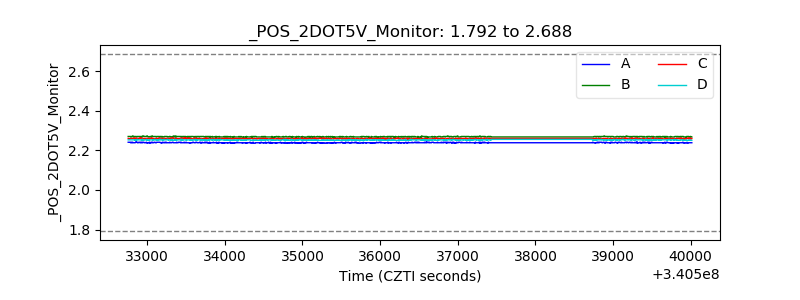 |
| +5 Volts monitor |  |
| _ROLL_ROT | 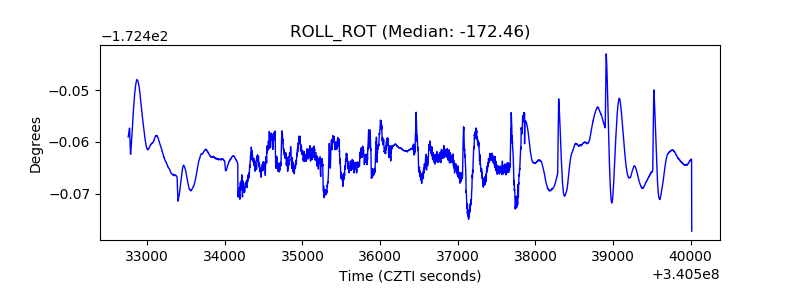 |
| _Roll_DEC |  |
| _Roll_RA | 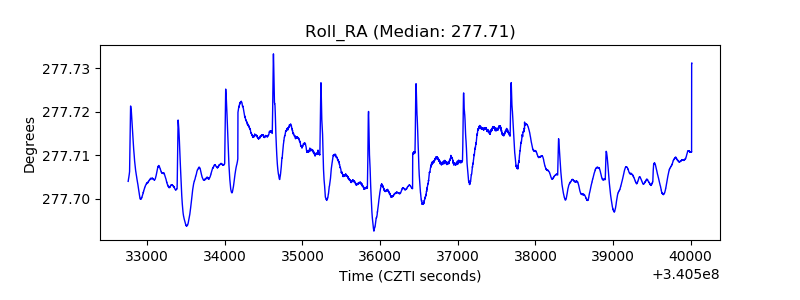 |
| Veto Counter | 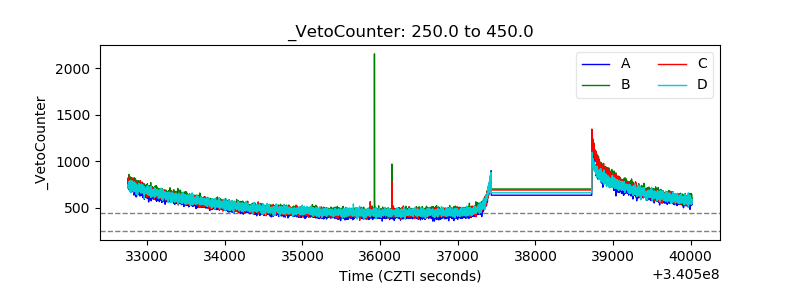 |