| Param | Original file | Final file |
|---|---|---|
| Filename | modeM0/AS1T03_255T01_9000003922_27314cztM0_level2.evt | modeM0/AS1T03_255T01_9000003922_27314cztM0_level2_quad_clean.evt |
| Size (bytes) | 477,959,040 | 117,570,240 |
| Size | 455.8 MB | 112.1 MB |
| Events in quadrant A | 3,470,265 | 817,820 |
| Events in quadrant B | 3,526,661 | 809,133 |
| Events in quadrant C | 3,354,386 | 753,852 |
| Events in quadrant D | 3,709,937 | 754,717 |
| Mode M9 | |||
|---|---|---|---|
| Quadrant | BADHDUFLAG | Total packets | Discarded packets |
| A | 0 | 13 | 0 |
| B | 0 | 13 | 0 |
| C | 0 | 13 | 0 |
| D | 0 | 13 | 0 |
| Mode M0 | |||
|---|---|---|---|
| Quadrant | BADHDUFLAG | Total packets | Discarded packets |
| A | 0 | 14230 | 0 |
| B | 0 | 14300 | 0 |
| C | 0 | 13759 | 0 |
| D | 0 | 14875 | 0 |
| Quadrant | Total seconds | Saturated seconds | Saturation percentage |
|---|---|---|---|
| A | 6095 | 153 | 2.510254% |
| B | 6095 | 196 | 3.215751% |
| C | 6094 | 164 | 2.691172% |
| D | 6094 | 158 | 2.592714% |
Noise dominated data is calculated using 1-second bins in cleaned event files. If a bin has >2000 counts, and if more than 50% of those come from <1% of pixels, then it is considered to be noise-dominated and hence unusable.
| Quadrant | # 1 sec bins | Bins with >0 counts | Bins with >2000 counts | High rate bins dominated by noise | Noise dominated (total time) | Noise dominated (detector-on time) | Marked lightcurve |
|---|---|---|---|---|---|---|---|
| A | 7400 | 6095 | 22 | 22 | 0.30% | 0.36% |  |
| B | 7400 | 6095 | 41 | 41 | 0.55% | 0.67% |  |
| C | 7399 | 6094 | 10 | 10 | 0.14% | 0.16% | 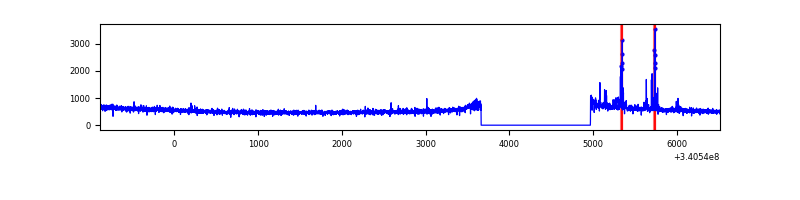 |
| D | 7399 | 6094 | 42 | 42 | 0.57% | 0.69% | 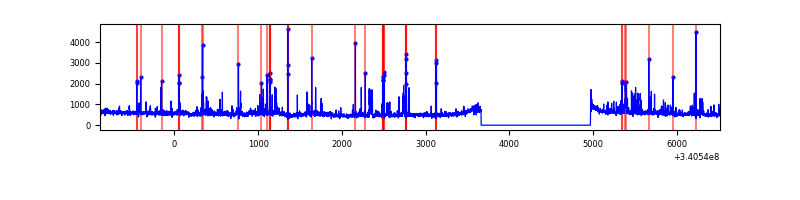 |
Top three noisy pixels from each quadrant. If the there are fewer than three noisy pixels in the level2.evt file, extra rows are filled as -1
| Pixel properties | Quadrant properties | ||||||
|---|---|---|---|---|---|---|---|
| Quadrant | DetID | PixID | Counts | Sigma | Mean | Median | Sigma |
| A | 13 | 248 | 102876 | 589.77 | 872 | 859 | 173.0 |
| A | 13 | 254 | 10205 | 54.03 | 872 | 859 | 173.0 |
| A | 0 | 226 | 7810 | 40.18 | 872 | 859 | 173.0 |
| B | 5 | 172 | 137906 | 865.0 | 847 | 832 | 158.5 |
| B | 0 | 190 | 22835 | 138.85 | 847 | 832 | 158.5 |
| B | 10 | 245 | 21637 | 131.29 | 847 | 832 | 158.5 |
| C | 14 | 238 | 129689 | 692.41 | 805 | 812 | 186.1 |
| C | 2 | 16 | 81170 | 431.74 | 805 | 812 | 186.1 |
| C | 15 | 208 | 7220 | 34.43 | 805 | 812 | 186.1 |
| D | 1 | 52 | 305455 | 1428.81 | 827 | 808 | 213.2 |
| D | 2 | 250 | 147854 | 689.66 | 827 | 808 | 213.2 |
| D | 2 | 234 | 25428 | 115.47 | 827 | 808 | 213.2 |
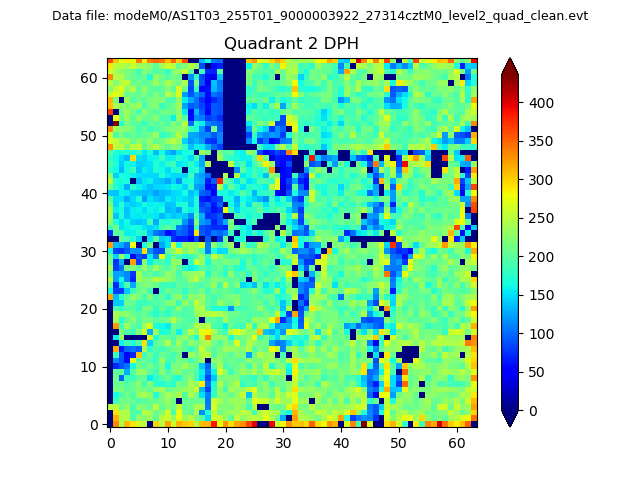
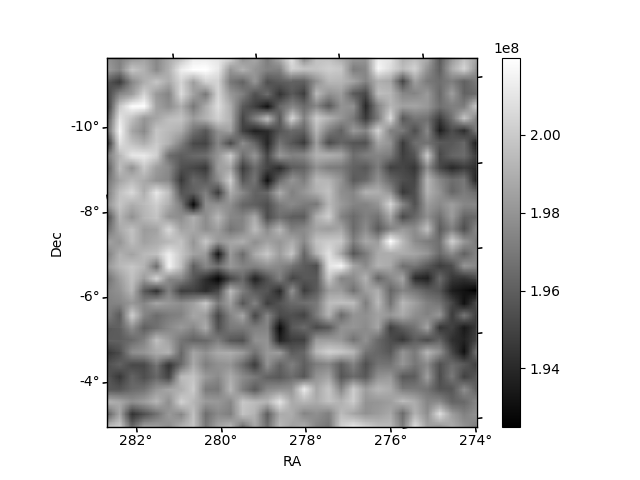
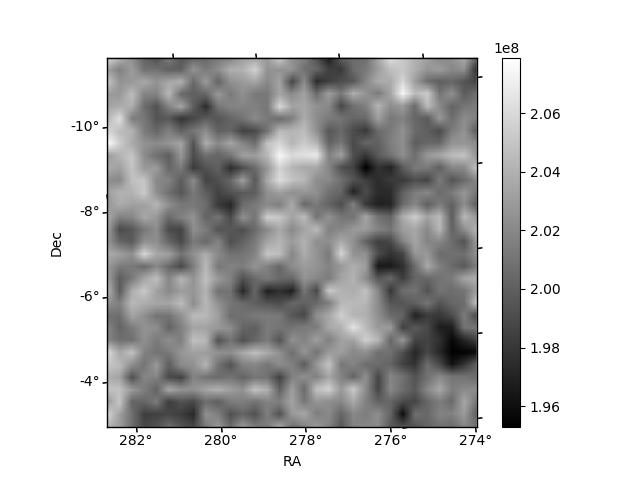
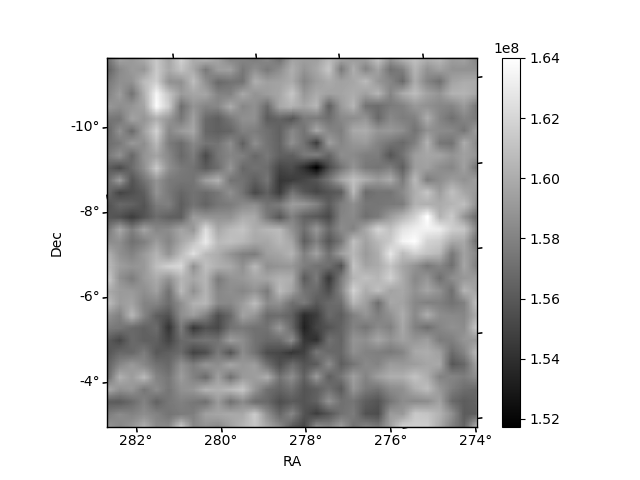
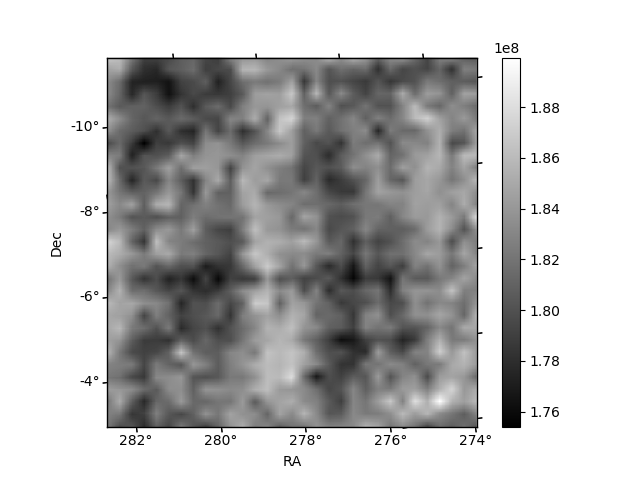
Histogram calculated using DETX and DETY for each event in the final _common_clean file
| Quadrant A | 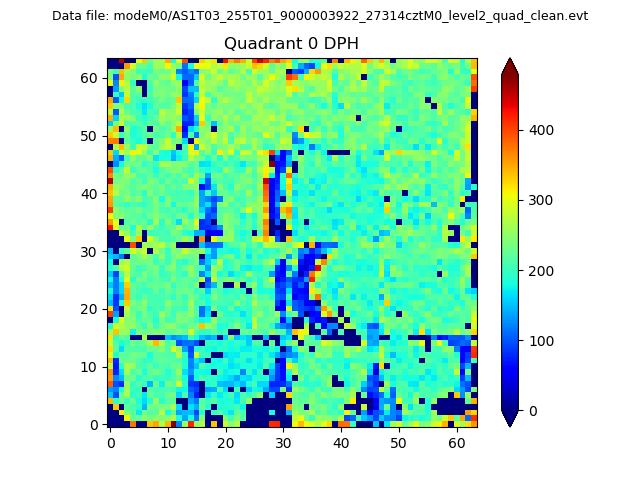 |
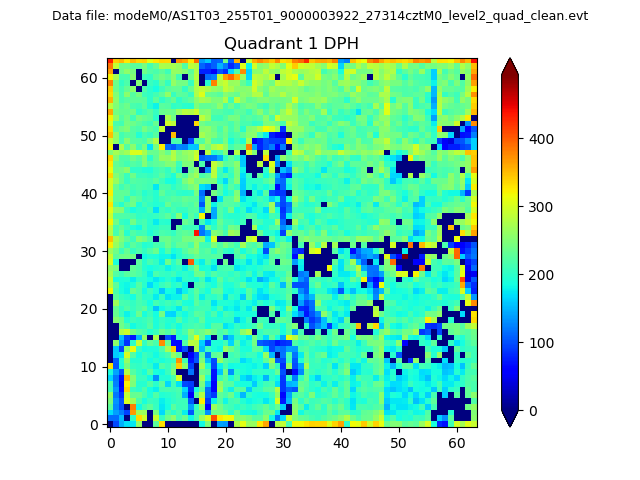 |
Quadrant B |
|---|---|---|---|
| Quadrant D | 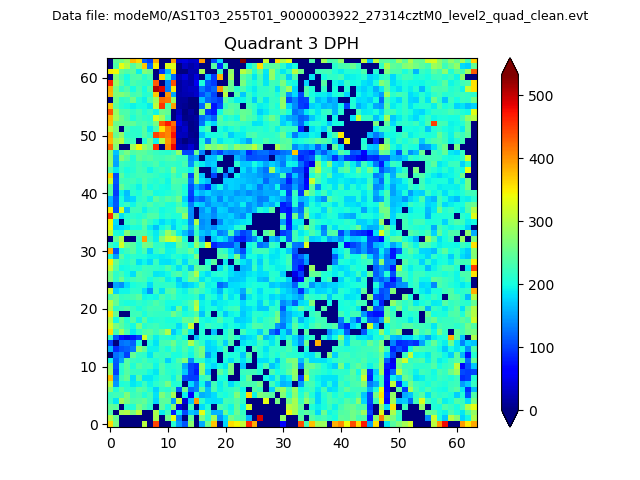 |
 |
Quadrant C |
| Plot type | Count rate plots | Images |
|---|---|---|
| Comparison with Poisson distribution Blue bars denote a histogram of data divided into 1 sec bins. Red curve is a Poisson curve with rate = median count rate of data. |
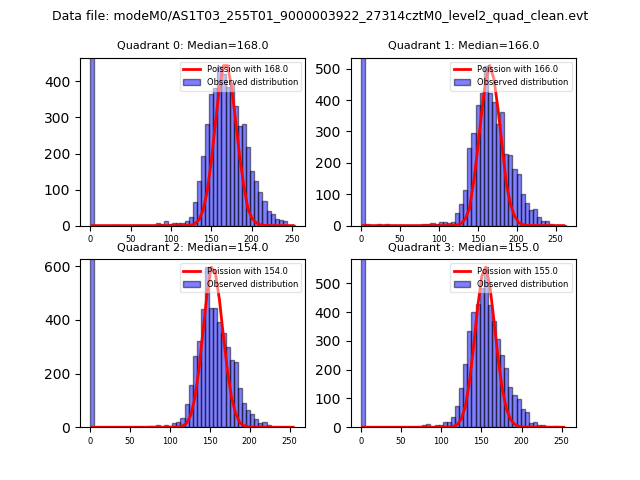 |
 |
| Quadrant-wise count rates Data is divided into 100 sec bins |
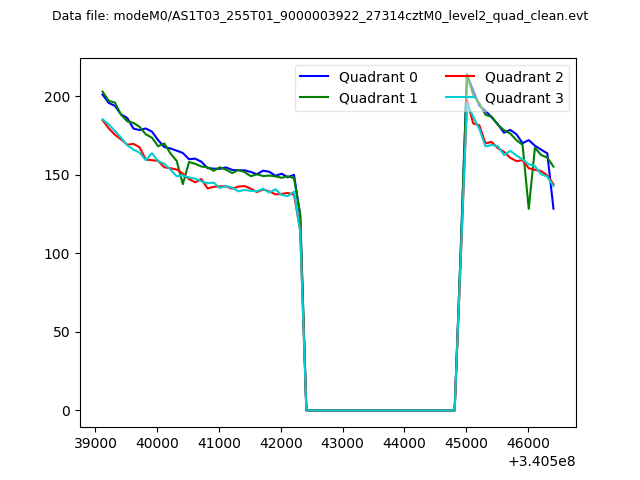 |
|
| Module-wise count rates for Quadrant A Data is divided into 100 sec bins |
 |
 |
| Module-wise count rates for Quadrant B Data is divided into 100 sec bins |
 |
 |
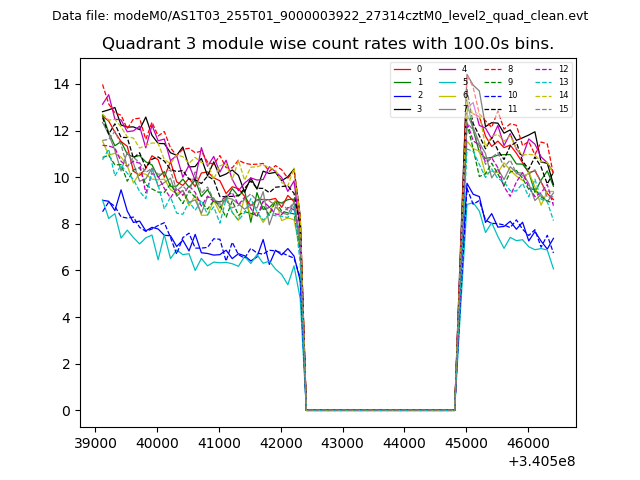
| Module-wise count rates for Quadrant C Data is divided into 100 sec bins |
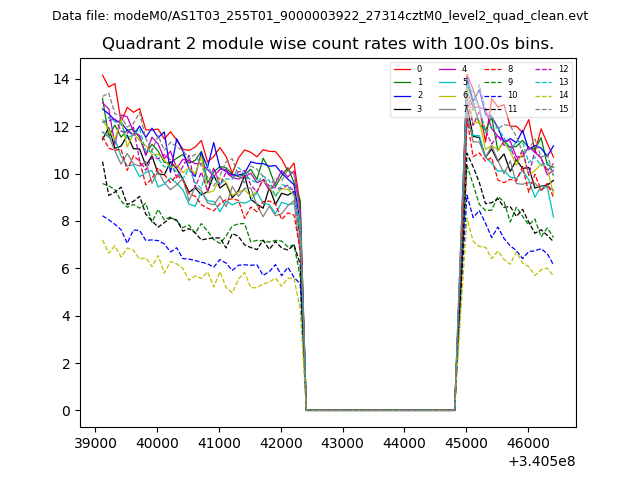 |
 |
| Module-wise count rates for Quadrant D Data is divided into 100 sec bins |
 |
 |
| Parameter | Plot |
|---|---|
| CZT HV Monitor | 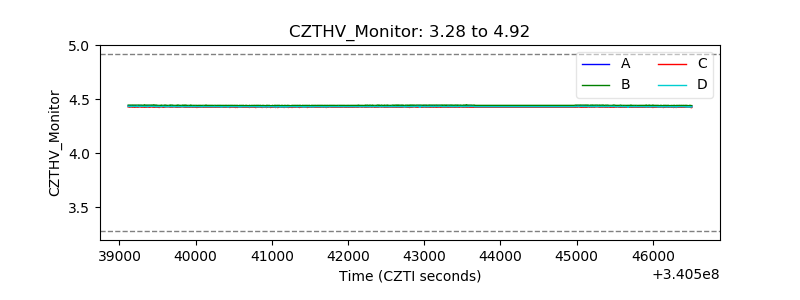 |
| D_VDD | 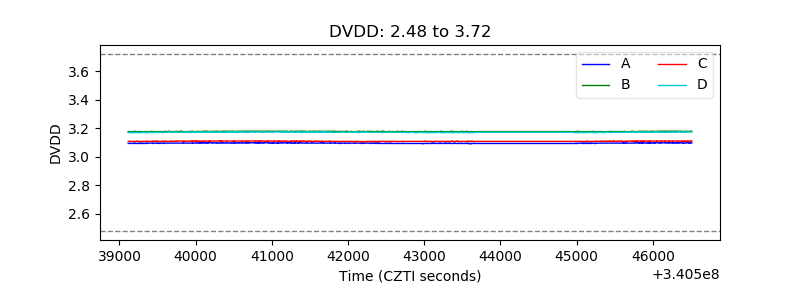 |
| Temperature 1 | 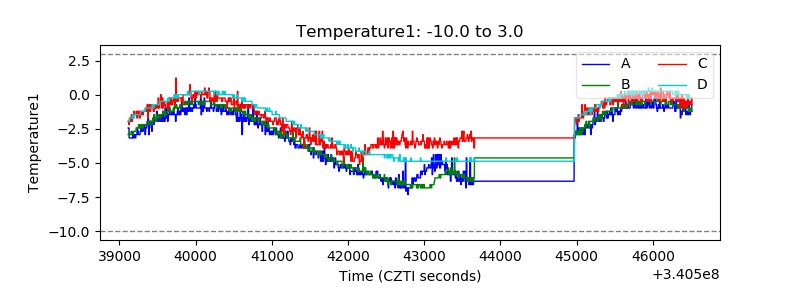 |
| Veto HV Monitor | 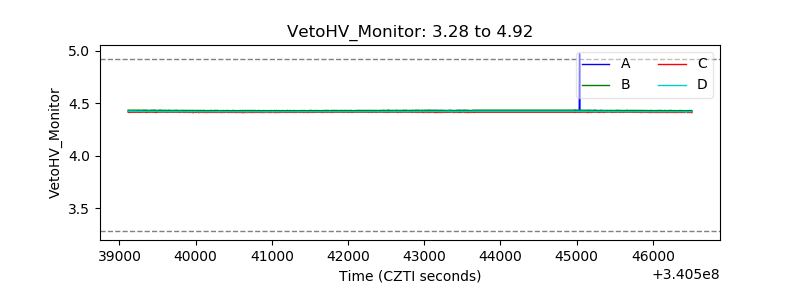 |
| Veto LLD |  |
| Alpha Counter | 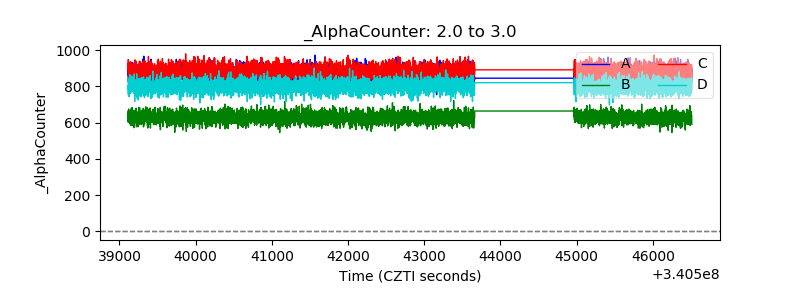 |
| _CPM_Rate | 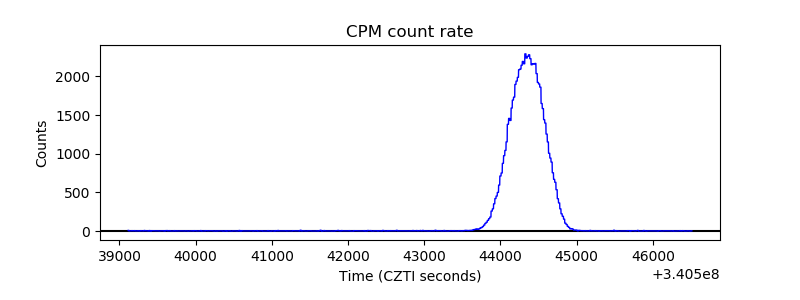 |
| CZT Counter | 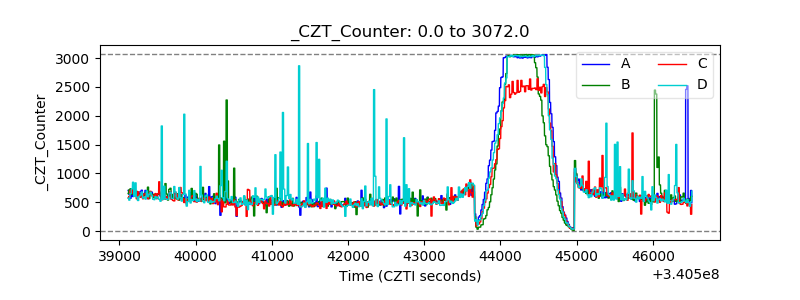 |
| +2.5 Volts monitor |  |
| +5 Volts monitor |  |
| _ROLL_ROT |  |
| _Roll_DEC | 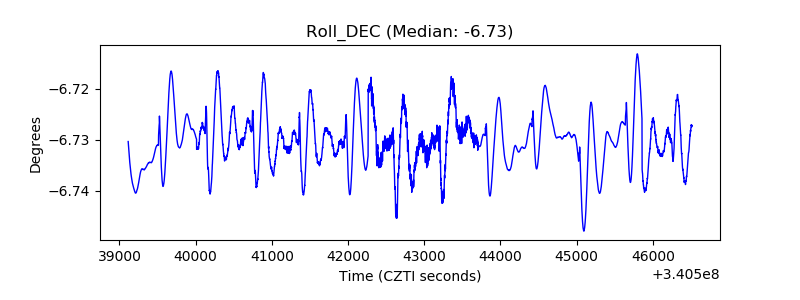 |
| _Roll_RA | 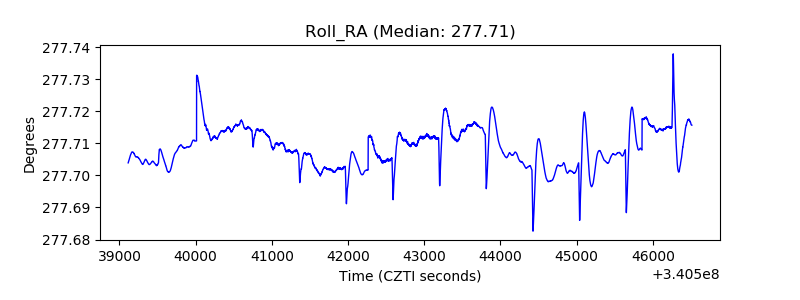 |
| Veto Counter |  |