| Param | Original file | Final file |
|---|---|---|
| Filename | modeM0/AS1T03_255T01_9000003922_27316cztM0_level2.evt | modeM0/AS1T03_255T01_9000003922_27316cztM0_level2_quad_clean.evt |
| Size (bytes) | 459,267,840 | 90,717,120 |
| Size | 438.0 MB | 86.5 MB |
| Events in quadrant A | 3,235,053 | 599,628 |
| Events in quadrant B | 3,488,010 | 599,330 |
| Events in quadrant C | 3,227,599 | 558,828 |
| Events in quadrant D | 3,531,207 | 550,485 |
| Mode M9 | |||
|---|---|---|---|
| Quadrant | BADHDUFLAG | Total packets | Discarded packets |
| A | 0 | 11 | 0 |
| B | 0 | 11 | 0 |
| C | 0 | 11 | 0 |
| D | 0 | 11 | 0 |
| Mode M0 | |||
|---|---|---|---|
| Quadrant | BADHDUFLAG | Total packets | Discarded packets |
| A | 0 | 13507 | 0 |
| B | 0 | 14359 | 0 |
| C | 0 | 13437 | 0 |
| D | 0 | 14615 | 0 |
| Quadrant | Total seconds | Saturated seconds | Saturation percentage |
|---|---|---|---|
| A | 6288 | 78 | 1.240458% |
| B | 6288 | 103 | 1.638041% |
| C | 6289 | 104 | 1.653681% |
| D | 6289 | 74 | 1.176658% |
Noise dominated data is calculated using 1-second bins in cleaned event files. If a bin has >2000 counts, and if more than 50% of those come from <1% of pixels, then it is considered to be noise-dominated and hence unusable.
| Quadrant | # 1 sec bins | Bins with >0 counts | Bins with >2000 counts | High rate bins dominated by noise | Noise dominated (total time) | Noise dominated (detector-on time) | Marked lightcurve |
|---|---|---|---|---|---|---|---|
| A | 7398 | 6289 | 4 | 4 | 0.05% | 0.06% | 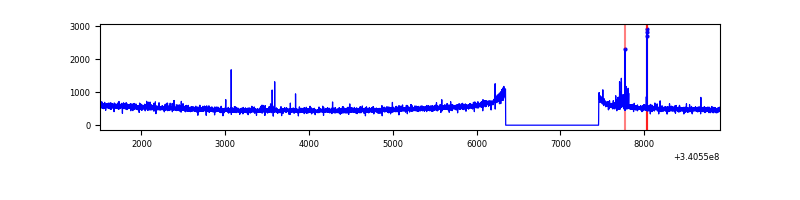 |
| B | 7398 | 6289 | 13 | 13 | 0.18% | 0.21% | 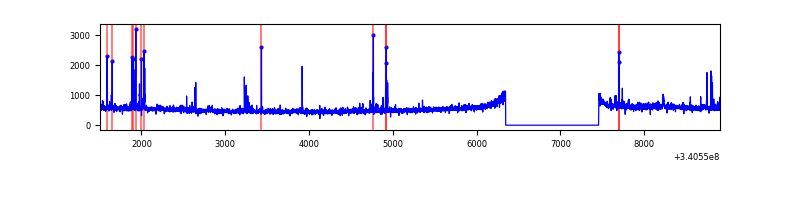 |
| C | 7399 | 6290 | 6 | 6 | 0.08% | 0.10% | 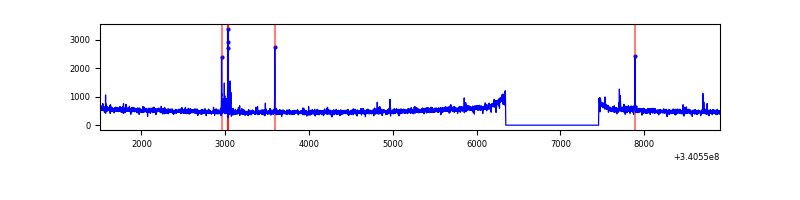 |
| D | 7399 | 6290 | 30 | 30 | 0.41% | 0.48% | 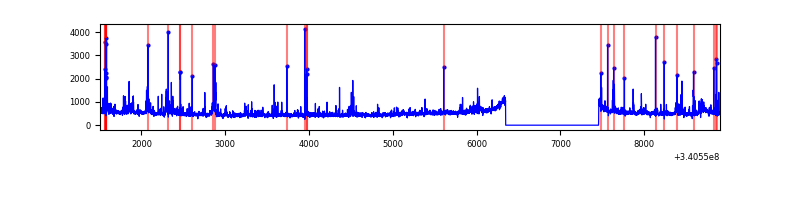 |
Top three noisy pixels from each quadrant. If the there are fewer than three noisy pixels in the level2.evt file, extra rows are filled as -1
| Pixel properties | Quadrant properties | ||||||
|---|---|---|---|---|---|---|---|
| Quadrant | DetID | PixID | Counts | Sigma | Mean | Median | Sigma |
| A | 13 | 248 | 42957 | 251.81 | 827 | 812 | 167.4 |
| A | 13 | 254 | 10749 | 59.37 | 827 | 812 | 167.4 |
| A | 3 | 137 | 7298 | 38.75 | 827 | 812 | 167.4 |
| B | 7 | 205 | 123803 | 796.82 | 817 | 797 | 154.4 |
| B | 10 | 245 | 58515 | 373.89 | 817 | 797 | 154.4 |
| B | 5 | 172 | 51952 | 331.38 | 817 | 797 | 154.4 |
| C | 14 | 238 | 124343 | 678.87 | 775 | 781 | 182.0 |
| C | 15 | 208 | 48744 | 263.52 | 775 | 781 | 182.0 |
| C | 2 | 16 | 31851 | 170.7 | 775 | 781 | 182.0 |
| D | 1 | 52 | 177497 | 886.99 | 784 | 768 | 199.2 |
| D | 2 | 250 | 153154 | 764.81 | 784 | 768 | 199.2 |
| D | 12 | 233 | 89284 | 444.25 | 784 | 768 | 199.2 |
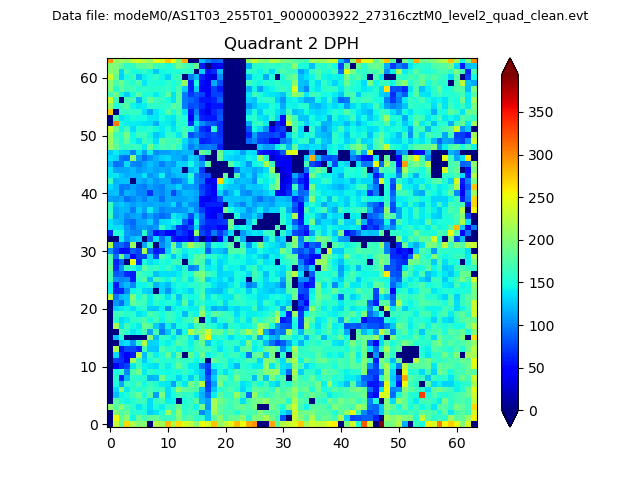
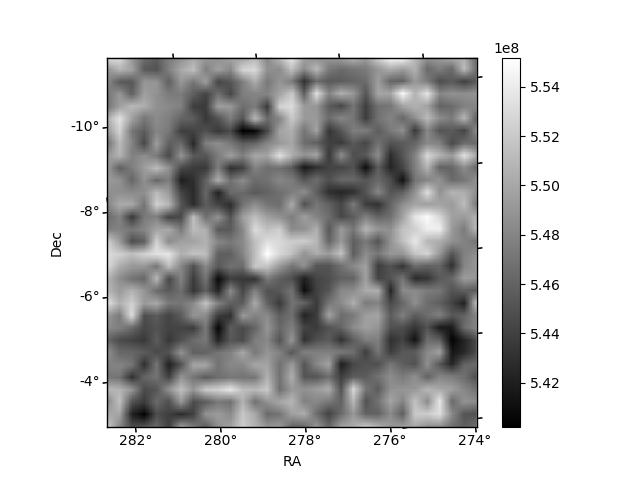
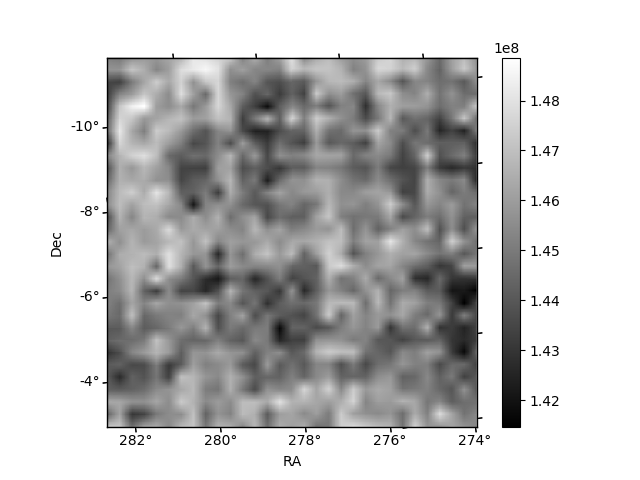
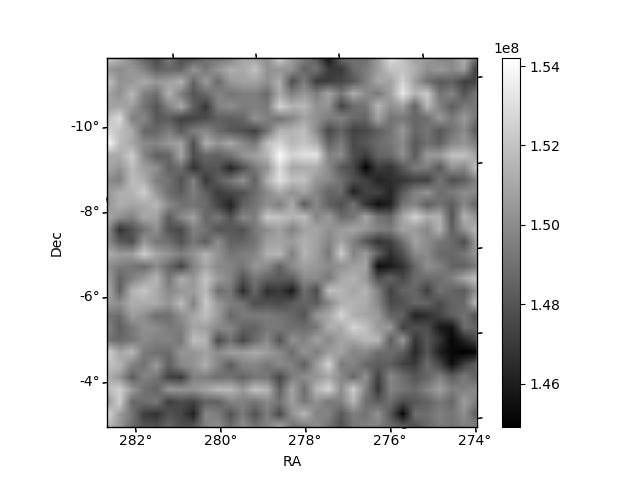
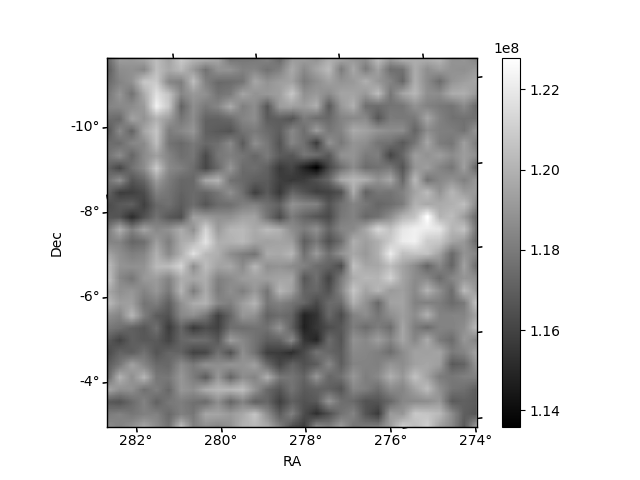
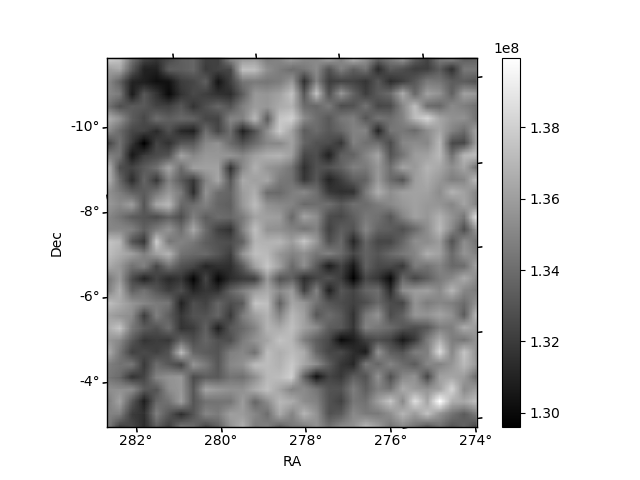
Histogram calculated using DETX and DETY for each event in the final _common_clean file
| Quadrant A | 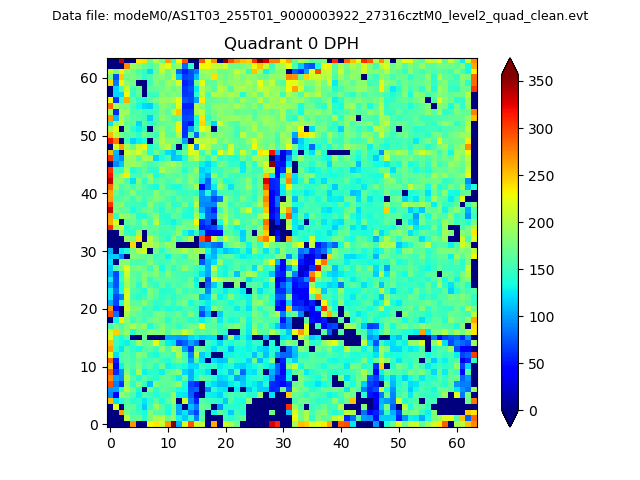 |
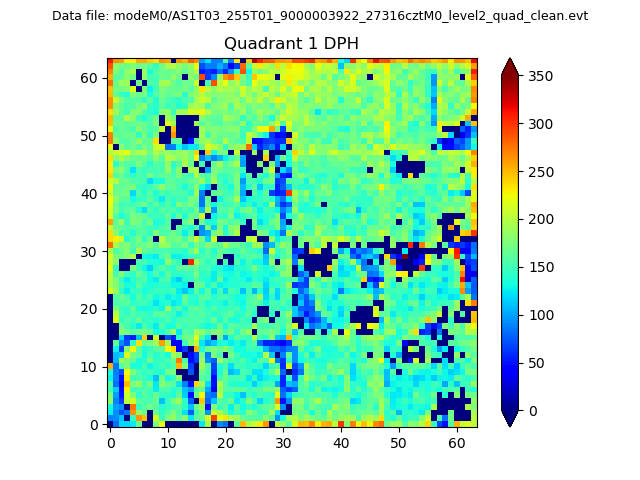 |
Quadrant B |
|---|---|---|---|
| Quadrant D | 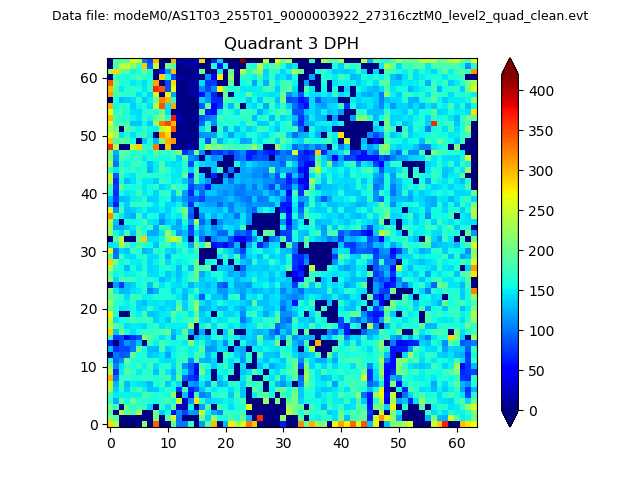 |
 |
Quadrant C |
| Plot type | Count rate plots | Images |
|---|---|---|
| Comparison with Poisson distribution Blue bars denote a histogram of data divided into 1 sec bins. Red curve is a Poisson curve with rate = median count rate of data. |
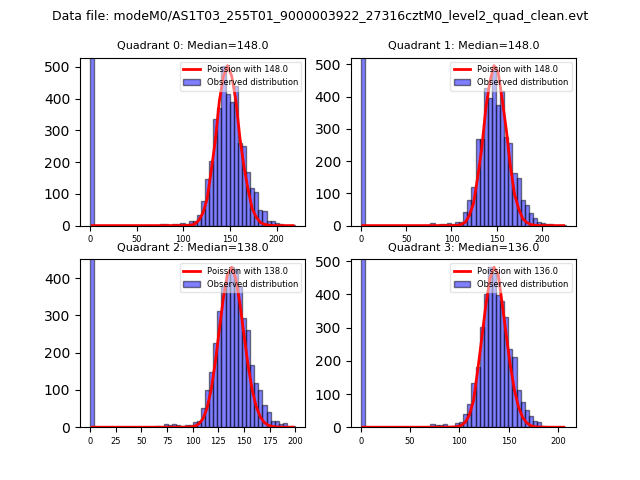 |
 |
| Quadrant-wise count rates Data is divided into 100 sec bins |
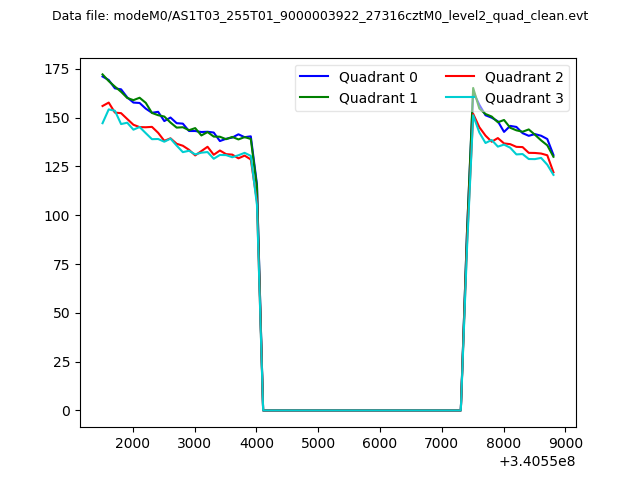 |
|
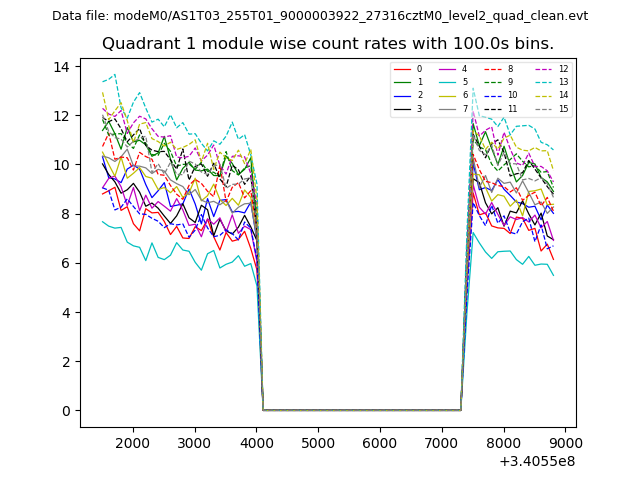
| Module-wise count rates for Quadrant A Data is divided into 100 sec bins |
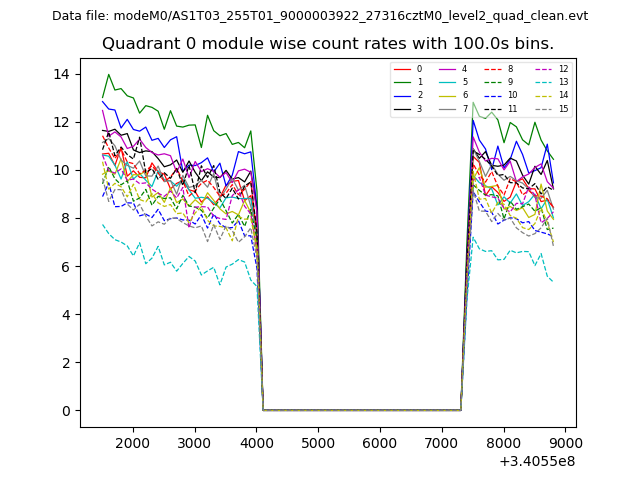 |
 |
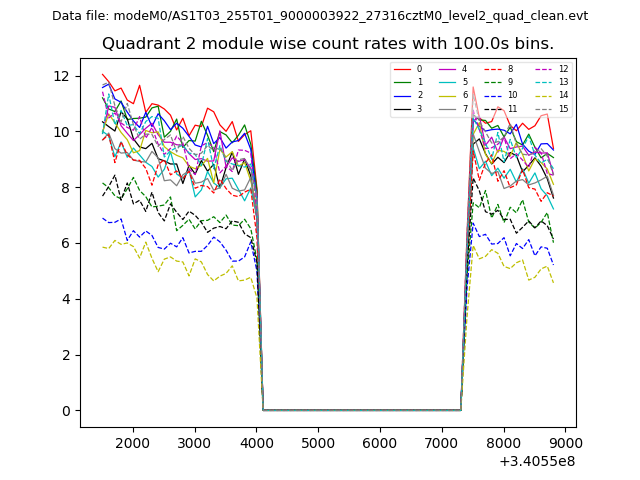
| Module-wise count rates for Quadrant B Data is divided into 100 sec bins |
 |
 |
| Module-wise count rates for Quadrant C Data is divided into 100 sec bins |
 |
 |
| Module-wise count rates for Quadrant D Data is divided into 100 sec bins |
 |
 |
| Parameter | Plot |
|---|---|
| CZT HV Monitor | 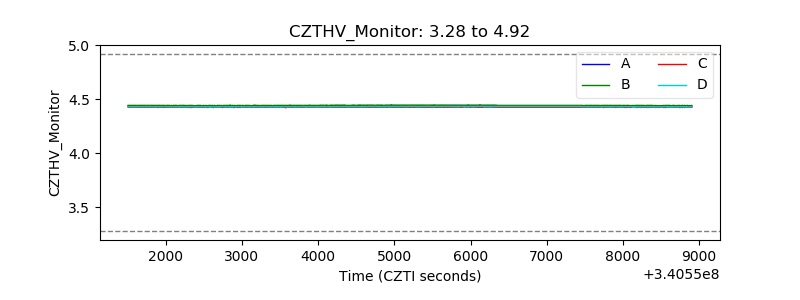 |
| D_VDD | 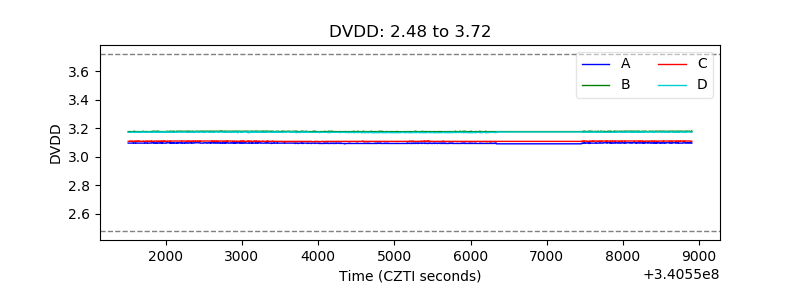 |
| Temperature 1 | 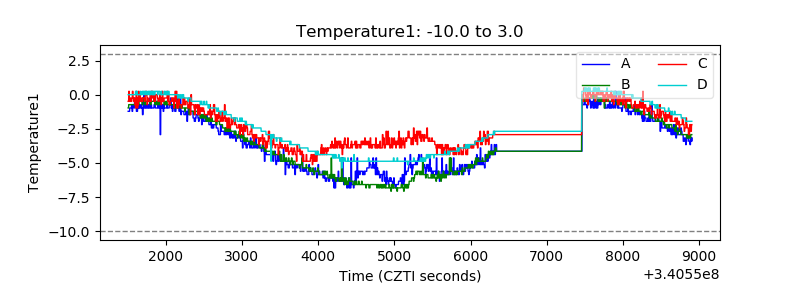 |
| Veto HV Monitor | 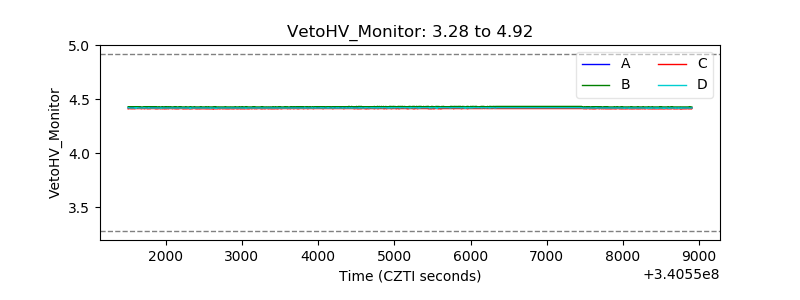 |
| Veto LLD | 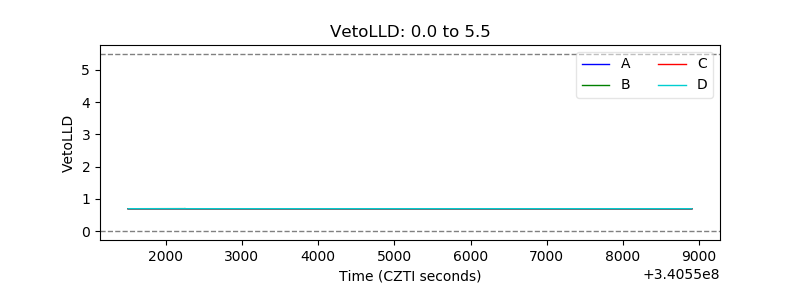 |
| Alpha Counter | 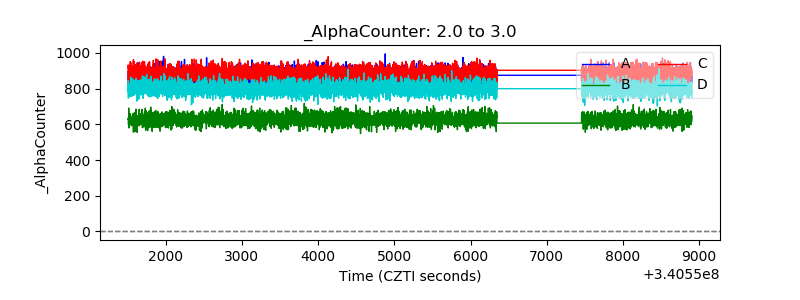 |
| _CPM_Rate | 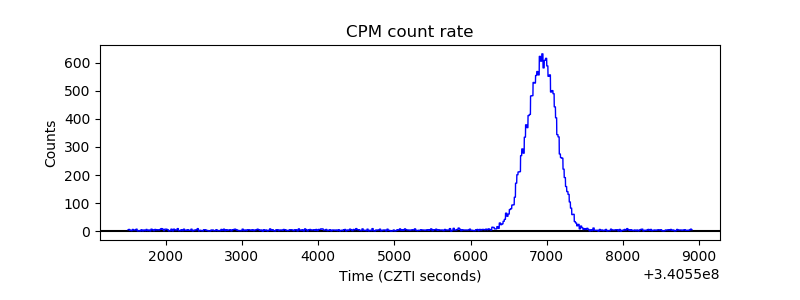 |
| CZT Counter | 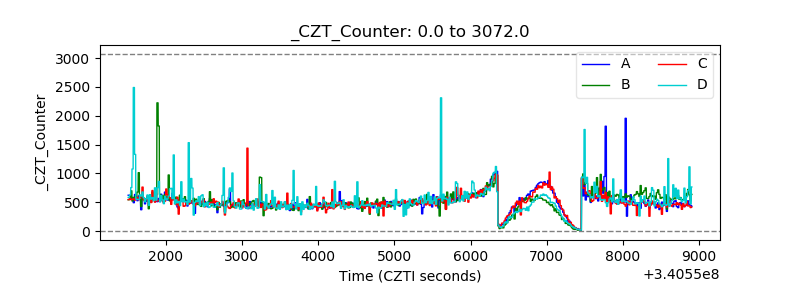 |
| +2.5 Volts monitor |  |
| +5 Volts monitor |  |
| _ROLL_ROT | 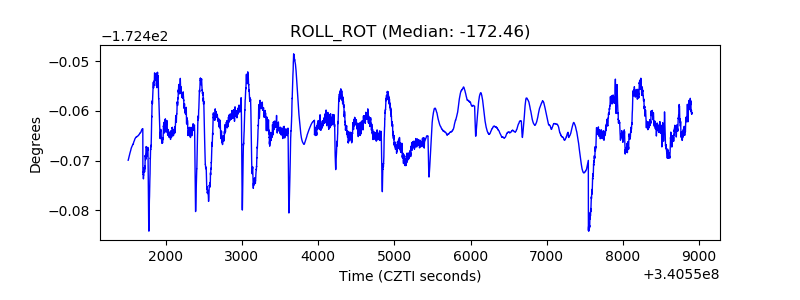 |
| _Roll_DEC | 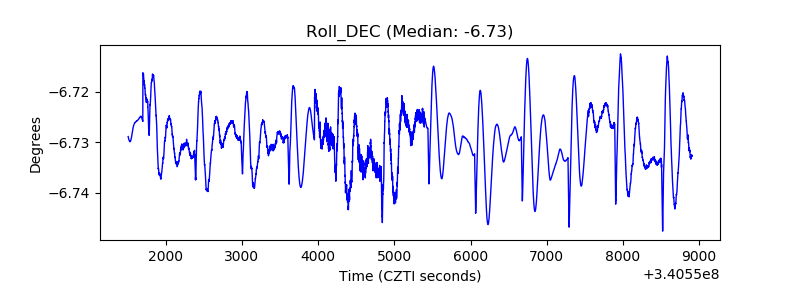 |
| _Roll_RA | 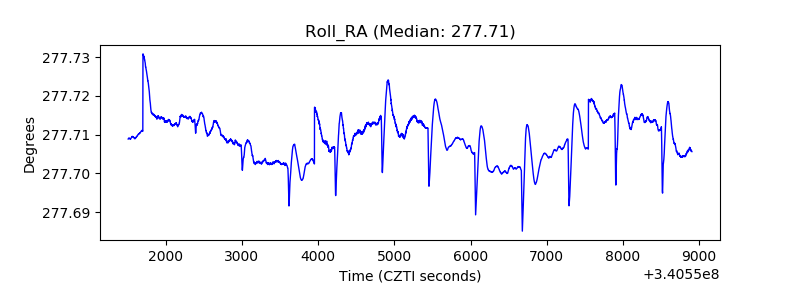 |
| Veto Counter | 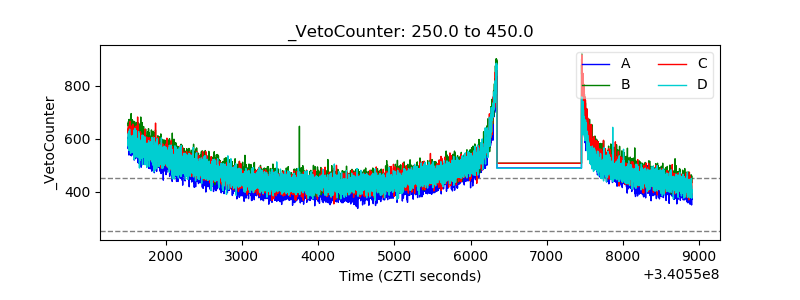 |