| Param | Original file | Final file |
|---|---|---|
| Filename | modeM0/AS1T03_255T01_9000003922_27317cztM0_level2.evt | modeM0/AS1T03_255T01_9000003922_27317cztM0_level2_quad_clean.evt |
| Size (bytes) | 501,393,600 | 97,499,520 |
| Size | 478.2 MB | 93.0 MB |
| Events in quadrant A | 3,397,860 | 639,822 |
| Events in quadrant B | 3,888,853 | 640,755 |
| Events in quadrant C | 3,377,508 | 604,658 |
| Events in quadrant D | 4,058,780 | 593,133 |
| Mode M9 | |||
|---|---|---|---|
| Quadrant | BADHDUFLAG | Total packets | Discarded packets |
| A | 0 | 8 | 0 |
| B | 0 | 8 | 0 |
| C | 0 | 8 | 0 |
| D | 0 | 8 | 0 |
| Mode M0 | |||
|---|---|---|---|
| Quadrant | BADHDUFLAG | Total packets | Discarded packets |
| A | 0 | 14421 | 0 |
| B | 0 | 15810 | 0 |
| C | 0 | 14314 | 0 |
| D | 0 | 16545 | 0 |
| Quadrant | Total seconds | Saturated seconds | Saturation percentage |
|---|---|---|---|
| A | 6807 | 43 | 0.631703% |
| B | 6808 | 83 | 1.219154% |
| C | 6808 | 77 | 1.131022% |
| D | 6807 | 92 | 1.351550% |
Noise dominated data is calculated using 1-second bins in cleaned event files. If a bin has >2000 counts, and if more than 50% of those come from <1% of pixels, then it is considered to be noise-dominated and hence unusable.
| Quadrant | # 1 sec bins | Bins with >0 counts | Bins with >2000 counts | High rate bins dominated by noise | Noise dominated (total time) | Noise dominated (detector-on time) | Marked lightcurve |
|---|---|---|---|---|---|---|---|
| A | 7587 | 6808 | 4 | 4 | 0.05% | 0.06% | 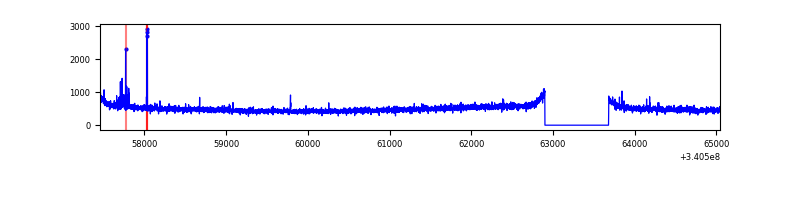 |
| B | 7588 | 6809 | 9 | 9 | 0.12% | 0.13% | 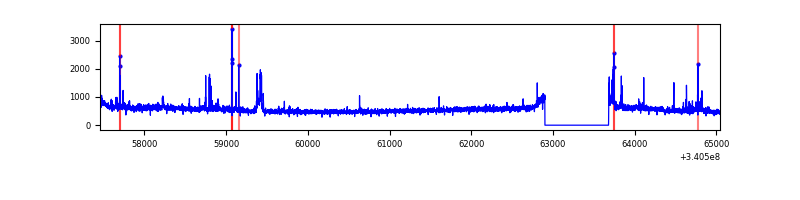 |
| C | 7588 | 6809 | 1 | 1 | 0.01% | 0.01% | 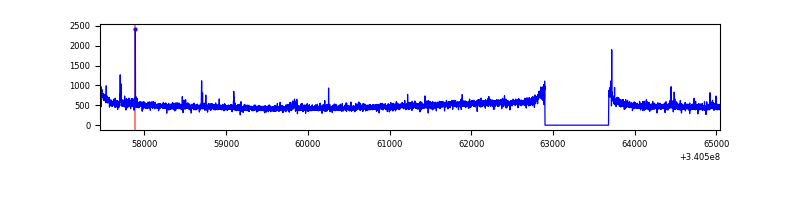 |
| D | 7587 | 6808 | 80 | 80 | 1.05% | 1.18% | 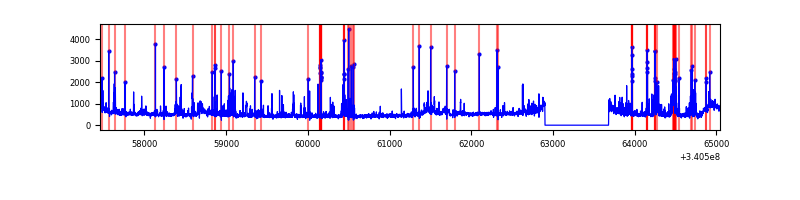 |
Top three noisy pixels from each quadrant. If the there are fewer than three noisy pixels in the level2.evt file, extra rows are filled as -1
| Pixel properties | Quadrant properties | ||||||
|---|---|---|---|---|---|---|---|
| Quadrant | DetID | PixID | Counts | Sigma | Mean | Median | Sigma |
| A | 13 | 248 | 39584 | 221.35 | 869 | 852 | 175.0 |
| A | 13 | 254 | 12288 | 65.36 | 869 | 852 | 175.0 |
| A | 3 | 137 | 7856 | 40.03 | 869 | 852 | 175.0 |
| B | 7 | 205 | 318104 | 1956.46 | 861 | 841 | 162.2 |
| B | 10 | 245 | 69546 | 423.68 | 861 | 841 | 162.2 |
| B | 5 | 172 | 57455 | 349.12 | 861 | 841 | 162.2 |
| C | 14 | 238 | 130317 | 670.08 | 819 | 825 | 193.2 |
| C | 2 | 16 | 29949 | 150.71 | 819 | 825 | 193.2 |
| C | 15 | 208 | 20177 | 100.14 | 819 | 825 | 193.2 |
| D | 1 | 52 | 440138 | 2099.47 | 824 | 806 | 209.3 |
| D | 2 | 250 | 206751 | 984.16 | 824 | 806 | 209.3 |
| D | 12 | 233 | 125652 | 596.61 | 824 | 806 | 209.3 |
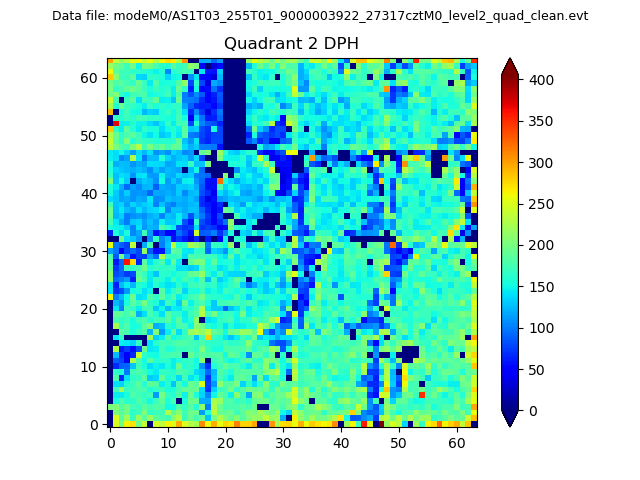
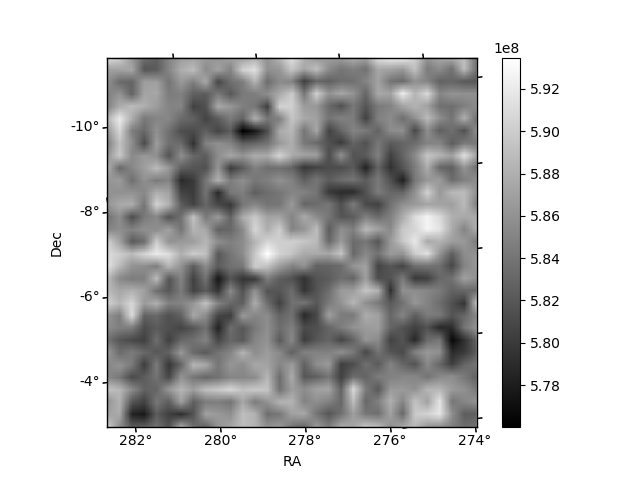
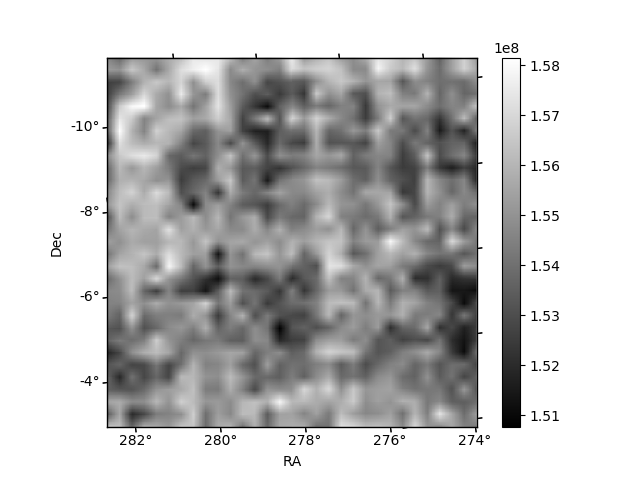
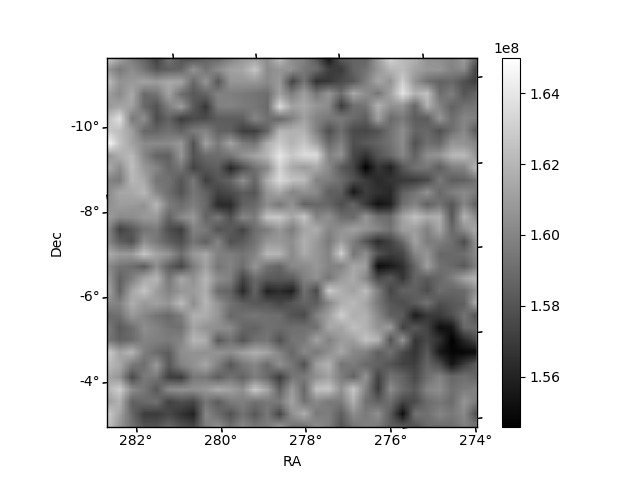
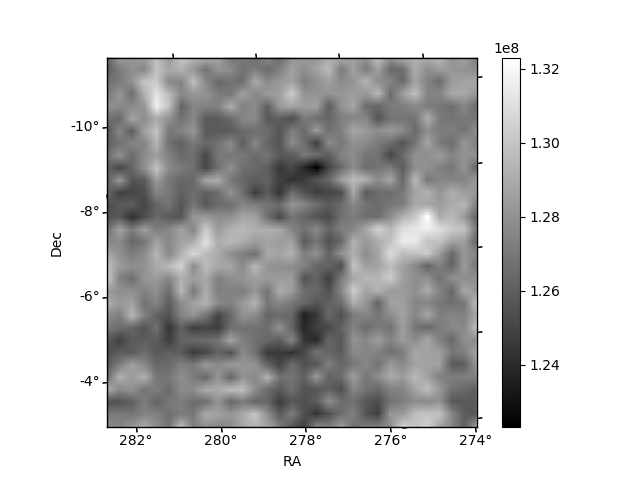
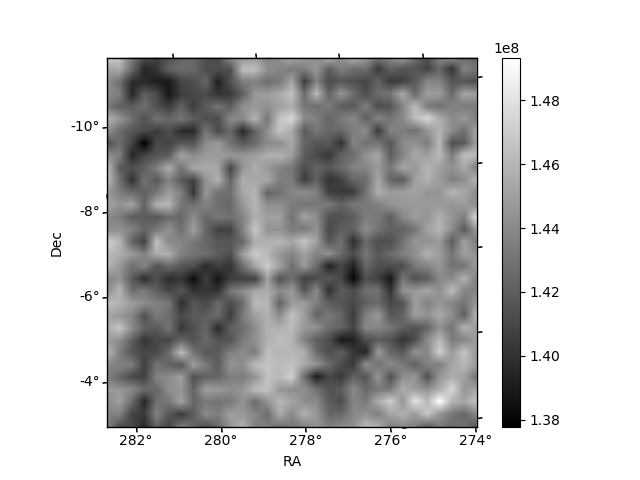
Histogram calculated using DETX and DETY for each event in the final _common_clean file
| Quadrant A | 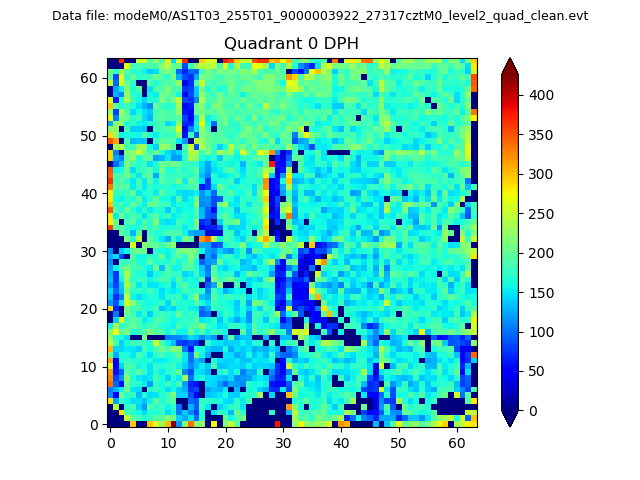 |
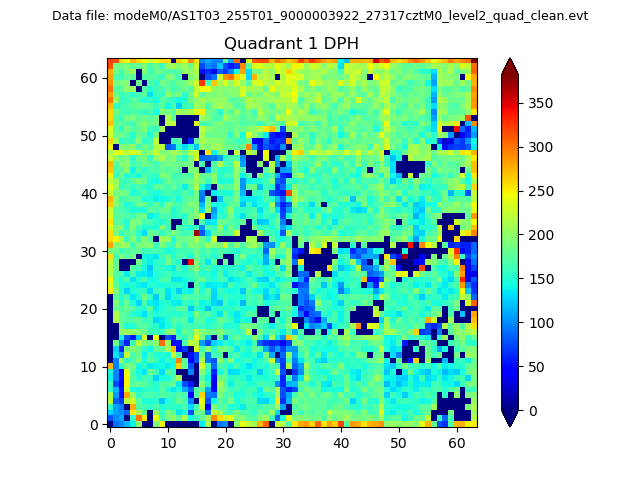 |
Quadrant B |
|---|---|---|---|
| Quadrant D | 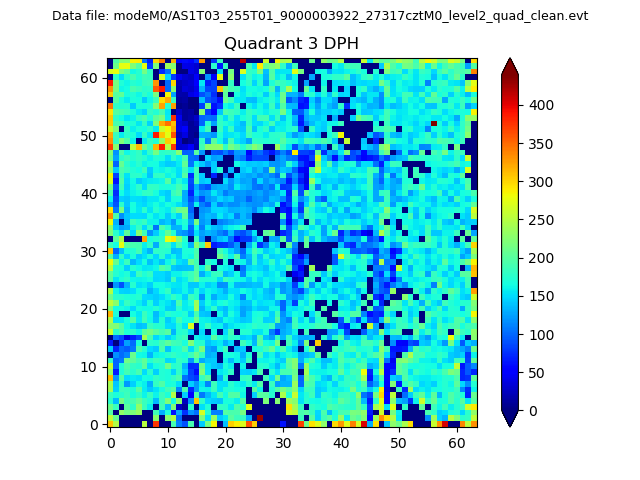 |
 |
Quadrant C |
| Plot type | Count rate plots | Images |
|---|---|---|
| Comparison with Poisson distribution Blue bars denote a histogram of data divided into 1 sec bins. Red curve is a Poisson curve with rate = median count rate of data. |
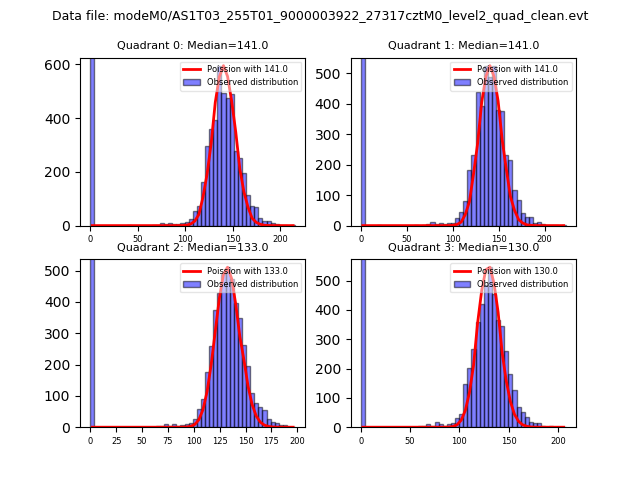 |
 |
| Quadrant-wise count rates Data is divided into 100 sec bins |
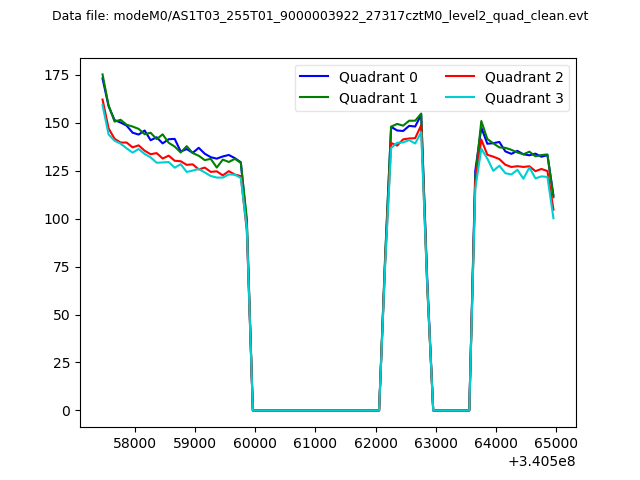 |
|
| Module-wise count rates for Quadrant A Data is divided into 100 sec bins |
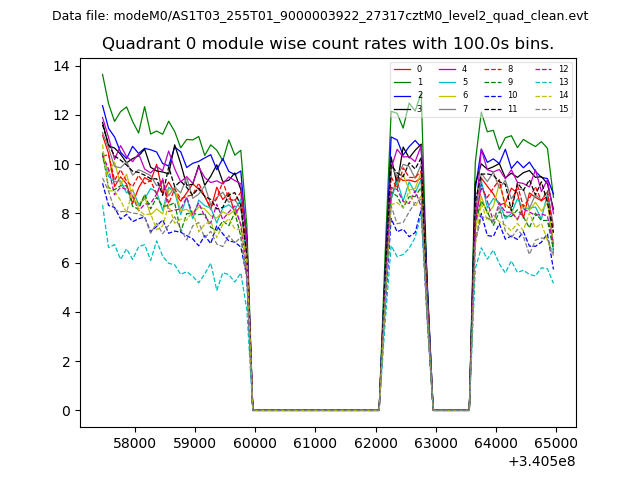 |
 |
| Module-wise count rates for Quadrant B Data is divided into 100 sec bins |
 |
 |
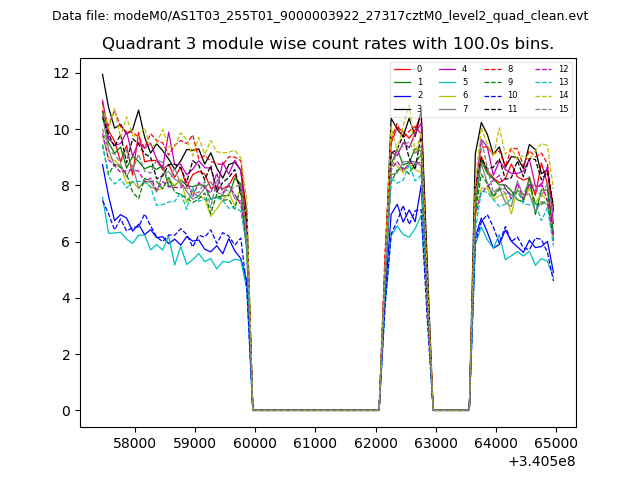
| Module-wise count rates for Quadrant C Data is divided into 100 sec bins |
 |
 |
| Module-wise count rates for Quadrant D Data is divided into 100 sec bins |
 |
 |
| Parameter | Plot |
|---|---|
| CZT HV Monitor |  |
| D_VDD | 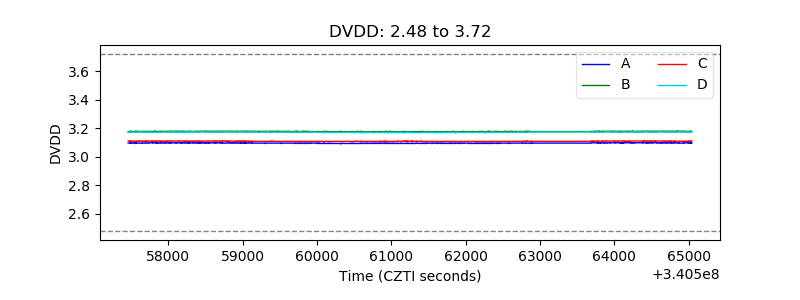 |
| Temperature 1 | 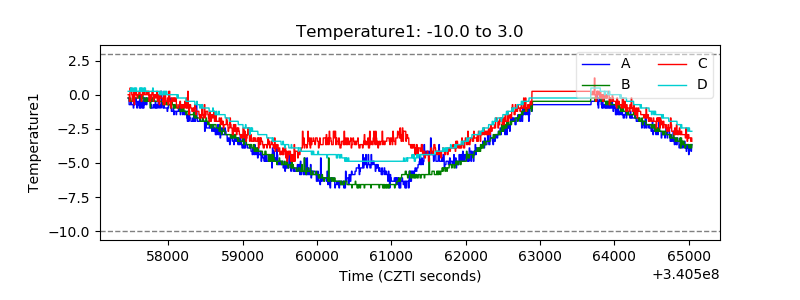 |
| Veto HV Monitor | 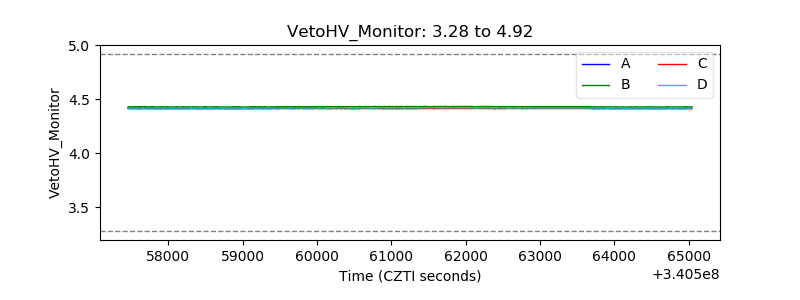 |
| Veto LLD | 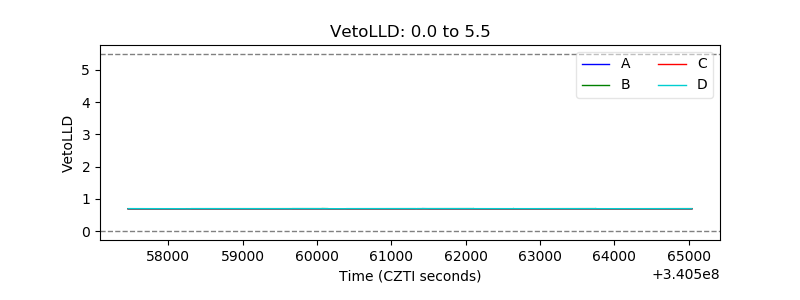 |
| Alpha Counter | 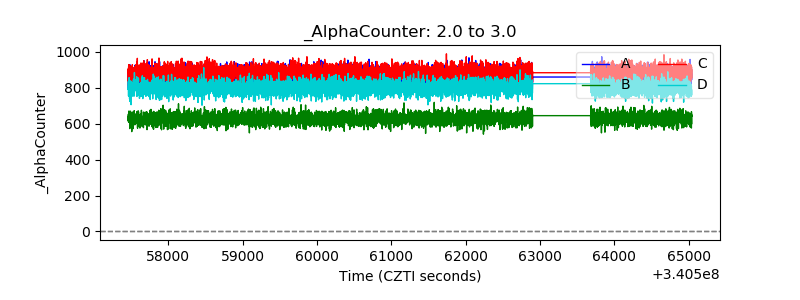 |
| _CPM_Rate | 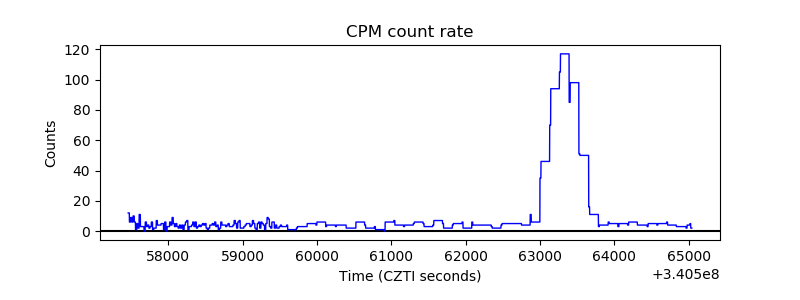 |
| CZT Counter |  |
| +2.5 Volts monitor |  |
| +5 Volts monitor | 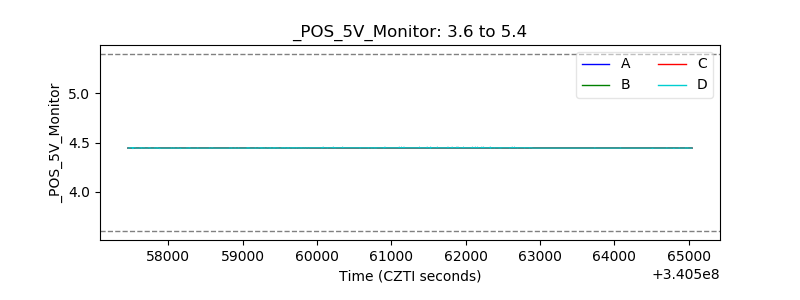 |
| _ROLL_ROT | 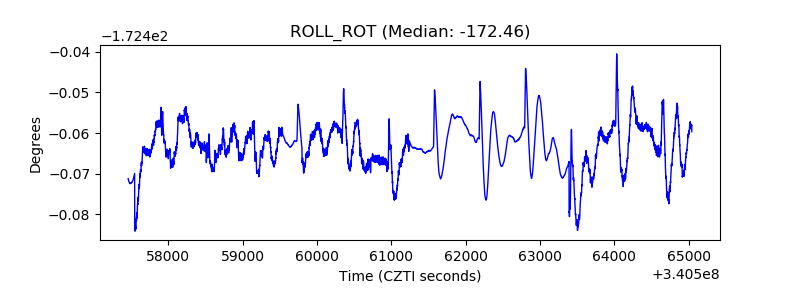 |
| _Roll_DEC | 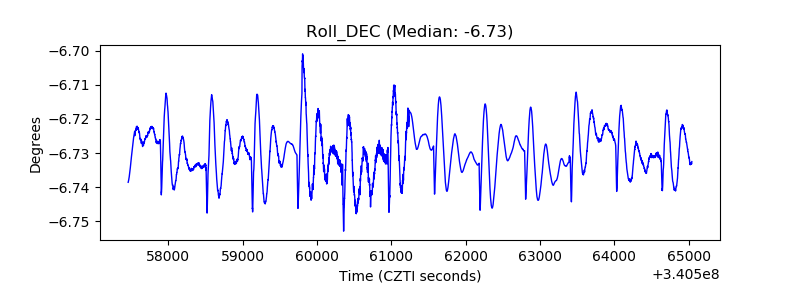 |
| _Roll_RA | 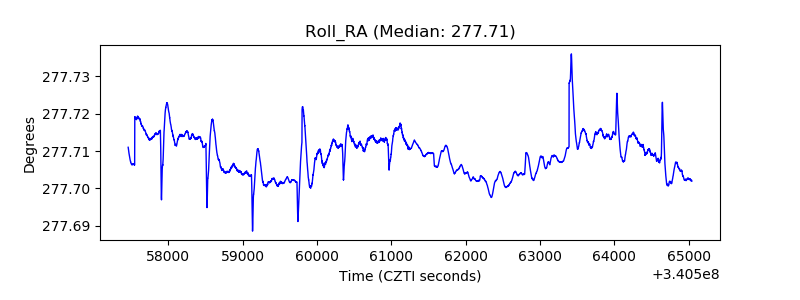 |
| Veto Counter | 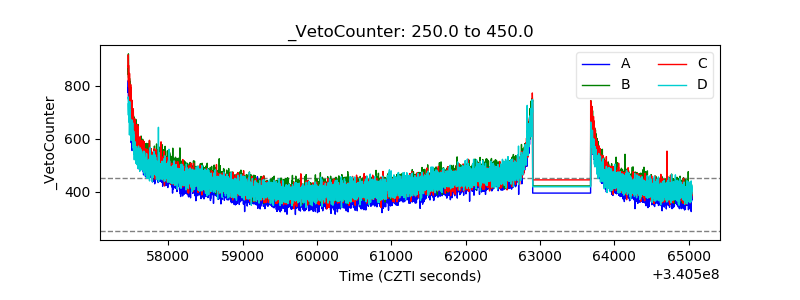 |