| Param | Original file | Final file |
|---|---|---|
| Filename | modeM0/AS1T03_255T01_9000003922_27318cztM0_level2.evt | modeM0/AS1T03_255T01_9000003922_27318cztM0_level2_quad_clean.evt |
| Size (bytes) | 539,242,560 | 105,209,280 |
| Size | 514.3 MB | 100.3 MB |
| Events in quadrant A | 3,580,253 | 691,708 |
| Events in quadrant B | 4,184,415 | 688,794 |
| Events in quadrant C | 3,622,789 | 655,008 |
| Events in quadrant D | 4,445,539 | 639,719 |
| Mode M9 | |||
|---|---|---|---|
| Quadrant | BADHDUFLAG | Total packets | Discarded packets |
| A | 0 | 12 | 0 |
| B | 0 | 12 | 0 |
| C | 0 | 12 | 0 |
| D | 0 | 12 | 0 |
| Mode M0 | |||
|---|---|---|---|
| Quadrant | BADHDUFLAG | Total packets | Discarded packets |
| A | 0 | 15326 | 0 |
| B | 0 | 17062 | 0 |
| C | 0 | 15395 | 0 |
| D | 0 | 18170 | 0 |
| Quadrant | Total seconds | Saturated seconds | Saturation percentage |
|---|---|---|---|
| A | 7349 | 58 | 0.789223% |
| B | 7350 | 193 | 2.625850% |
| C | 7350 | 107 | 1.455782% |
| D | 7350 | 102 | 1.387755% |
Noise dominated data is calculated using 1-second bins in cleaned event files. If a bin has >2000 counts, and if more than 50% of those come from <1% of pixels, then it is considered to be noise-dominated and hence unusable.
| Quadrant | # 1 sec bins | Bins with >0 counts | Bins with >2000 counts | High rate bins dominated by noise | Noise dominated (total time) | Noise dominated (detector-on time) | Marked lightcurve |
|---|---|---|---|---|---|---|---|
| A | 8469 | 7351 | 0 | 0 | 0.00% | 0.00% | 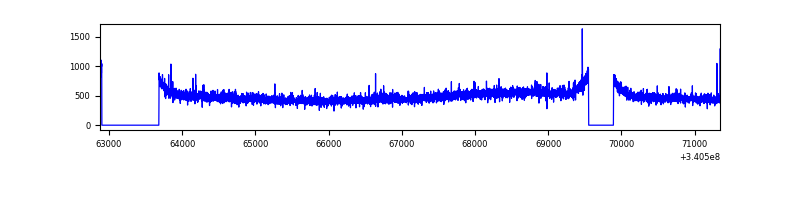 |
| B | 8470 | 7352 | 63 | 63 | 0.74% | 0.86% | 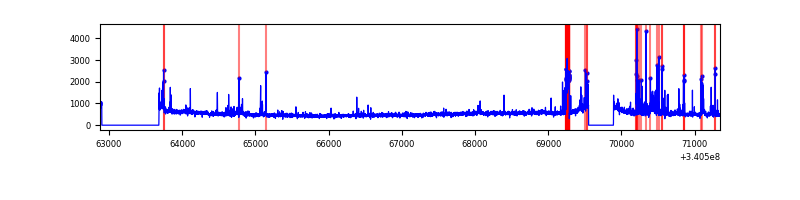 |
| C | 8470 | 7352 | 2 | 2 | 0.02% | 0.03% | 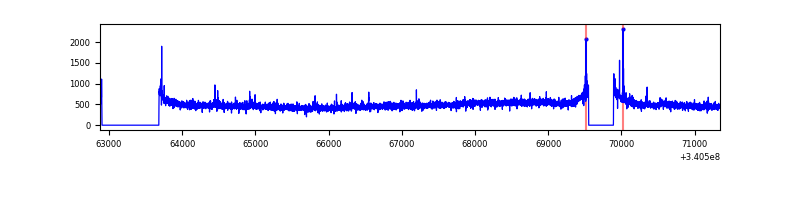 |
| D | 8470 | 7352 | 66 | 66 | 0.78% | 0.90% | 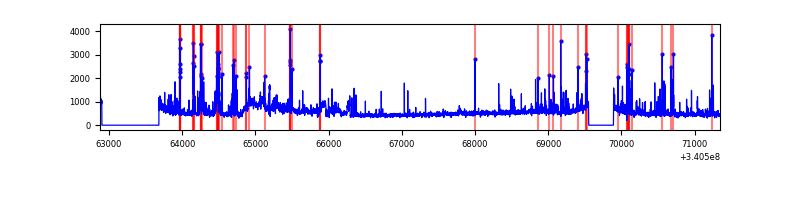 |
Top three noisy pixels from each quadrant. If the there are fewer than three noisy pixels in the level2.evt file, extra rows are filled as -1
| Pixel properties | Quadrant properties | ||||||
|---|---|---|---|---|---|---|---|
| Quadrant | DetID | PixID | Counts | Sigma | Mean | Median | Sigma |
| A | 13 | 254 | 13988 | 69.83 | 924 | 902 | 187.4 |
| A | 3 | 137 | 8481 | 40.44 | 924 | 902 | 187.4 |
| A | 0 | 226 | 8073 | 38.26 | 924 | 902 | 187.4 |
| B | 5 | 172 | 199541 | 1135.83 | 911 | 889 | 174.9 |
| B | 3 | 64 | 155195 | 882.27 | 911 | 889 | 174.9 |
| B | 7 | 205 | 147714 | 839.5 | 911 | 889 | 174.9 |
| C | 14 | 238 | 136887 | 653.92 | 873 | 876 | 208.0 |
| C | 8 | 208 | 28694 | 133.74 | 873 | 876 | 208.0 |
| C | 0 | 207 | 23483 | 108.69 | 873 | 876 | 208.0 |
| D | 1 | 52 | 523760 | 2223.51 | 874 | 860 | 235.2 |
| D | 2 | 250 | 326650 | 1385.34 | 874 | 860 | 235.2 |
| D | 10 | 103 | 71934 | 302.23 | 874 | 860 | 235.2 |
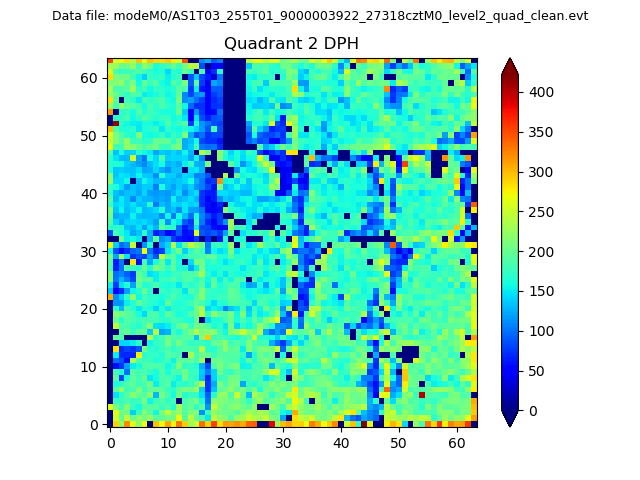
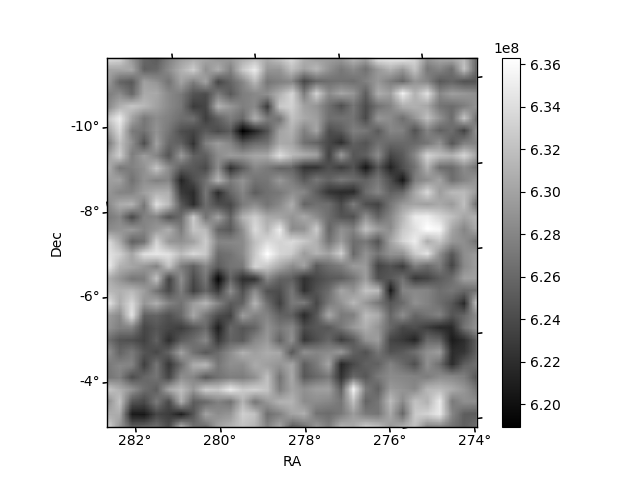
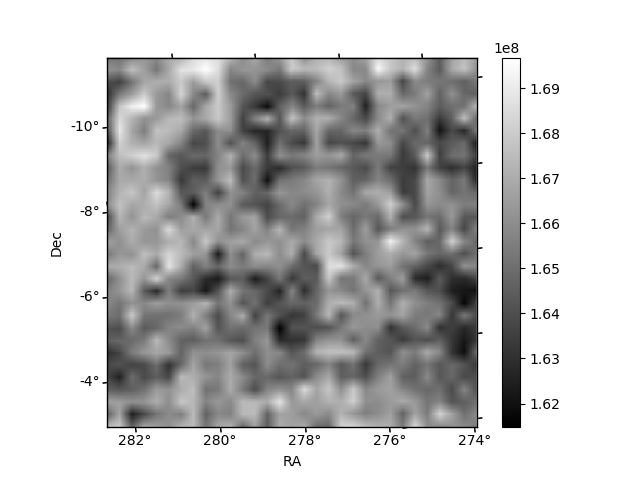
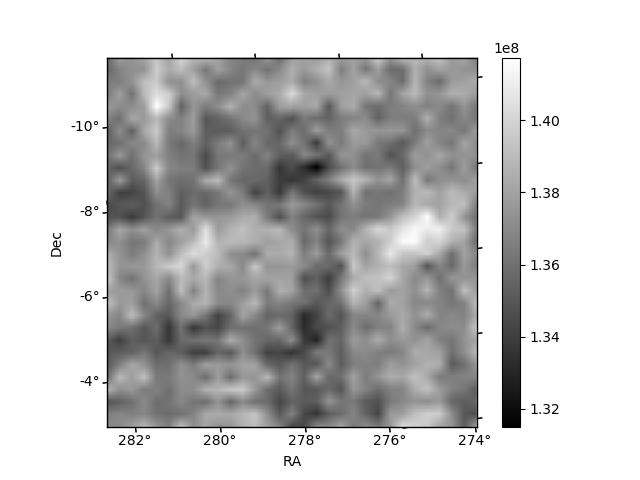
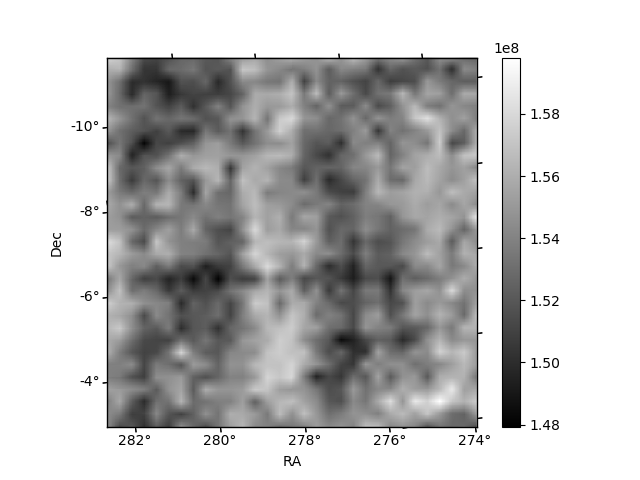
Histogram calculated using DETX and DETY for each event in the final _common_clean file
| Quadrant A | 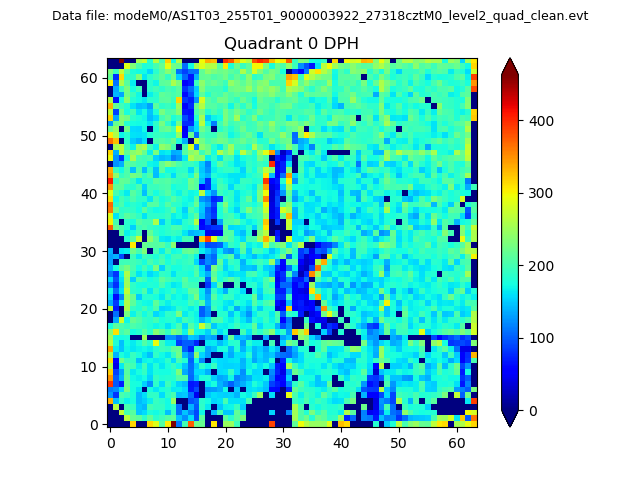 |
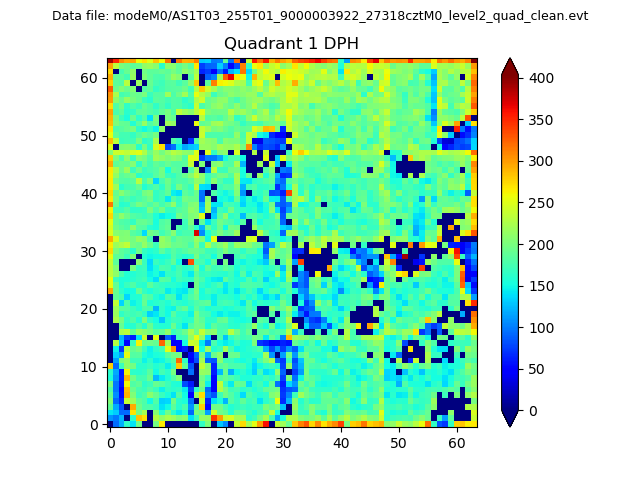 |
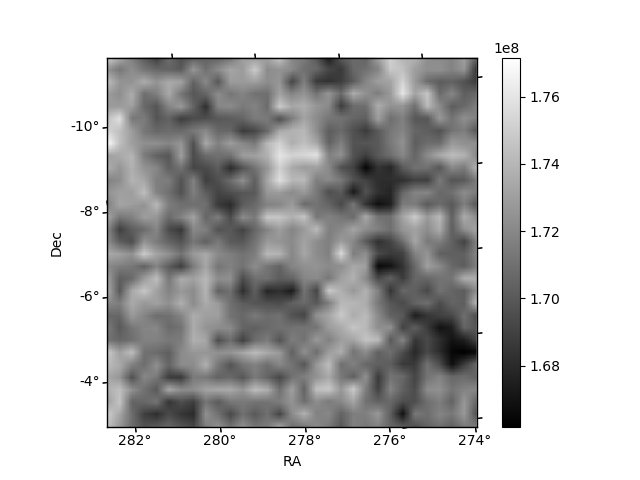
Quadrant B |
|---|---|---|---|
| Quadrant D | 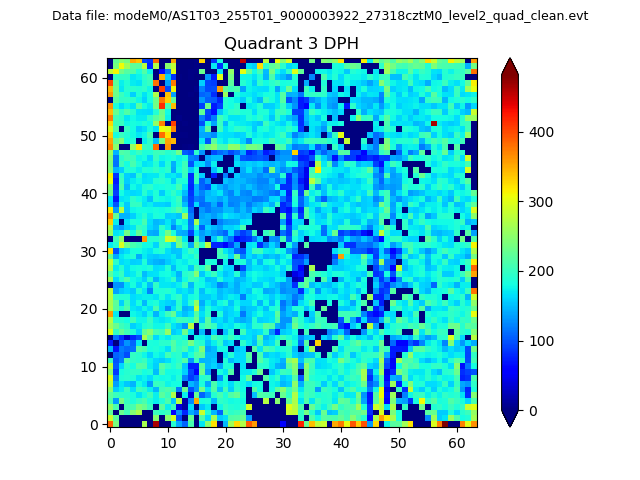 |
 |
Quadrant C |
| Plot type | Count rate plots | Images |
|---|---|---|
| Comparison with Poisson distribution Blue bars denote a histogram of data divided into 1 sec bins. Red curve is a Poisson curve with rate = median count rate of data. |
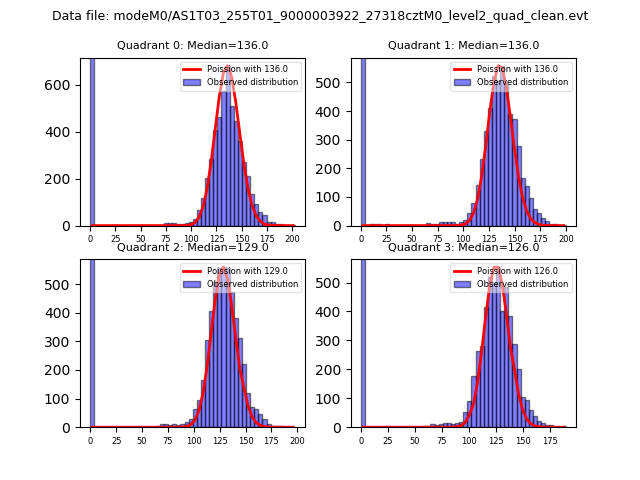 |
 |
| Quadrant-wise count rates Data is divided into 100 sec bins |
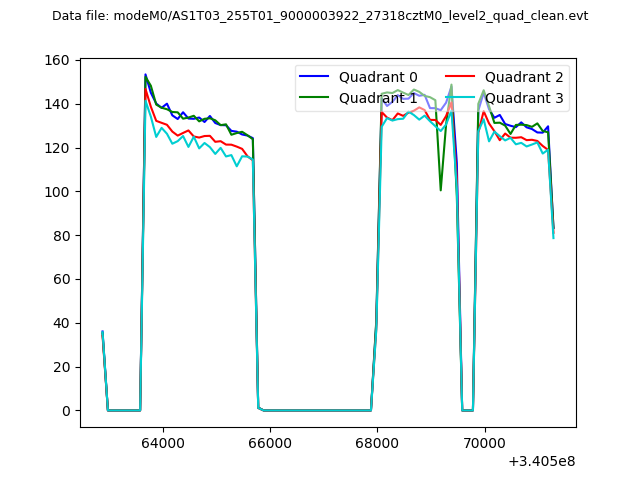 |
|
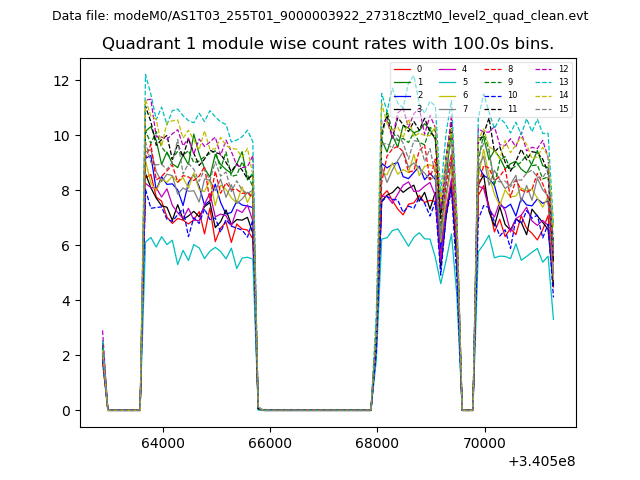
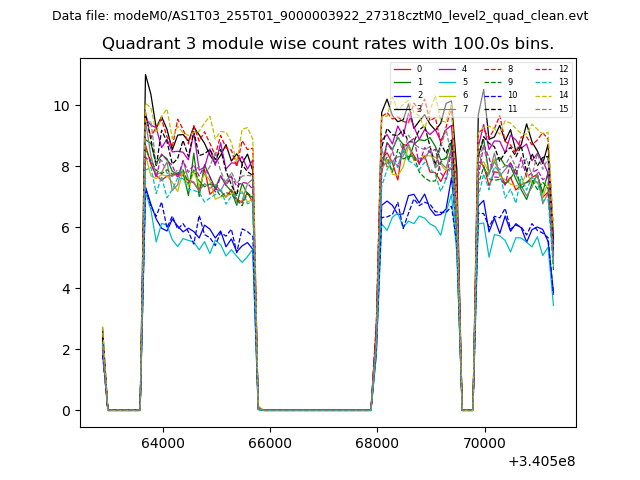
| Module-wise count rates for Quadrant A Data is divided into 100 sec bins |
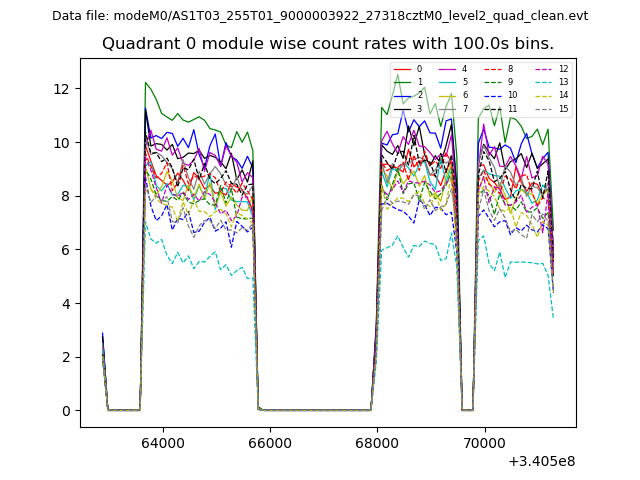 |
 |
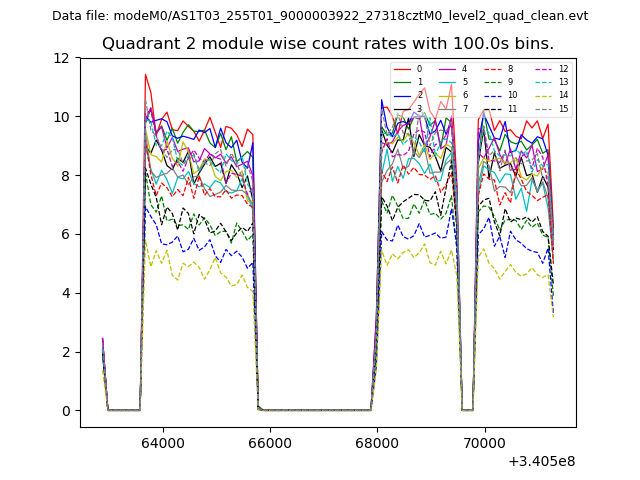
| Module-wise count rates for Quadrant B Data is divided into 100 sec bins |
 |
 |
| Module-wise count rates for Quadrant C Data is divided into 100 sec bins |
 |
 |
| Module-wise count rates for Quadrant D Data is divided into 100 sec bins |
 |
 |
| Parameter | Plot |
|---|---|
| CZT HV Monitor | 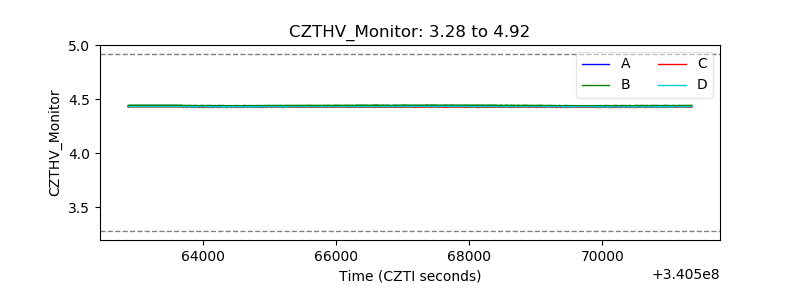 |
| D_VDD | 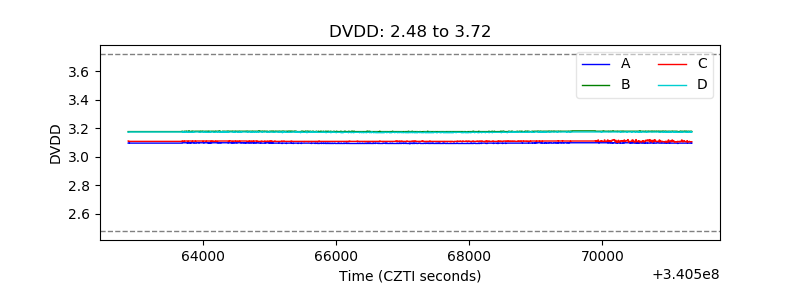 |
| Temperature 1 | 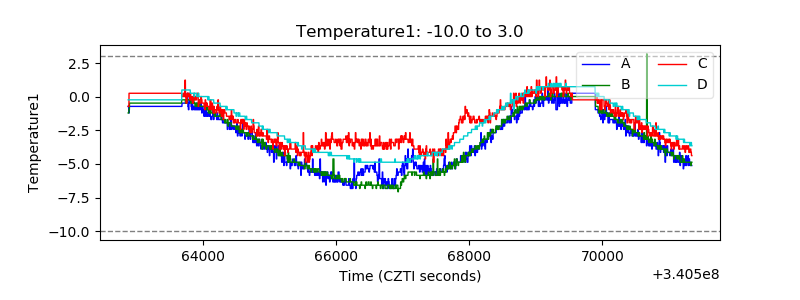 |
| Veto HV Monitor |  |
| Veto LLD | 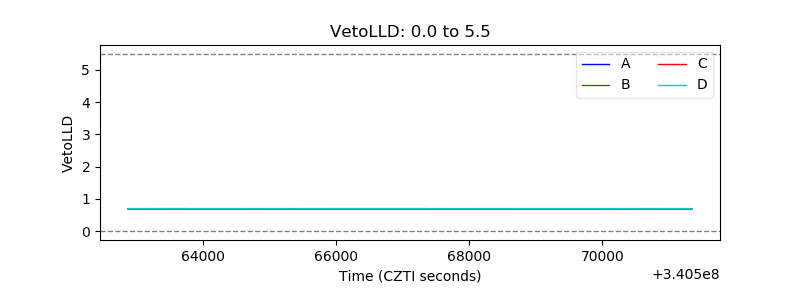 |
| Alpha Counter | 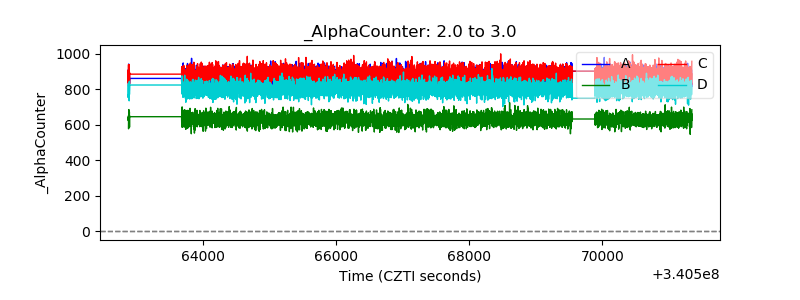 |
| _CPM_Rate | 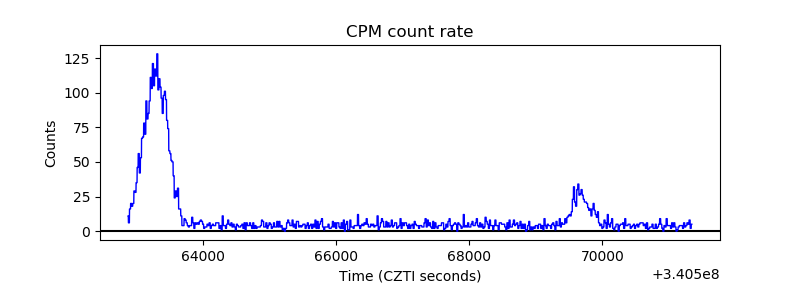 |
| CZT Counter | 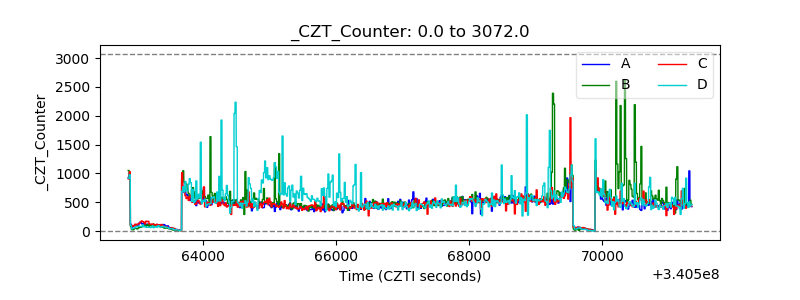 |
| +2.5 Volts monitor |  |
| +5 Volts monitor | 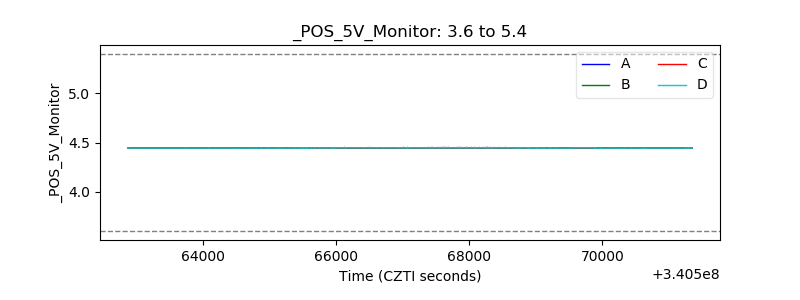 |
| _ROLL_ROT | 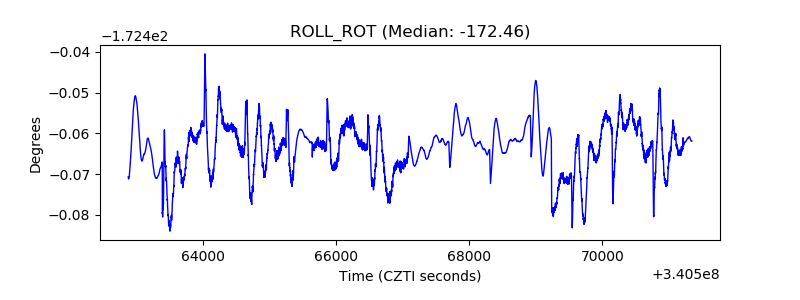 |
| _Roll_DEC | 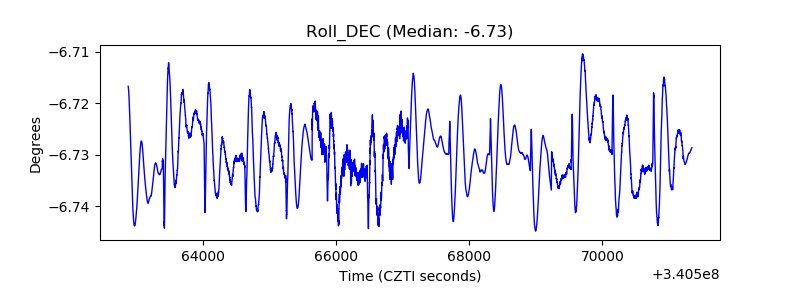 |
| _Roll_RA | 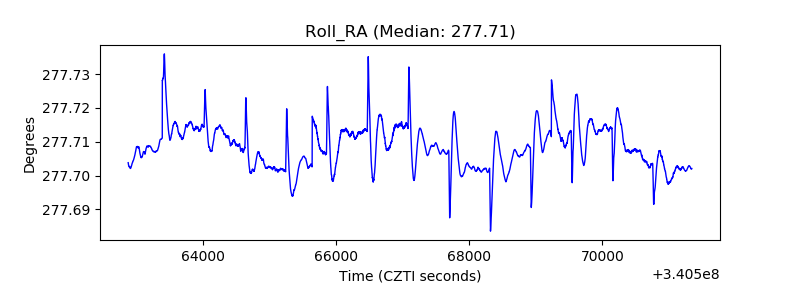 |
| Veto Counter | 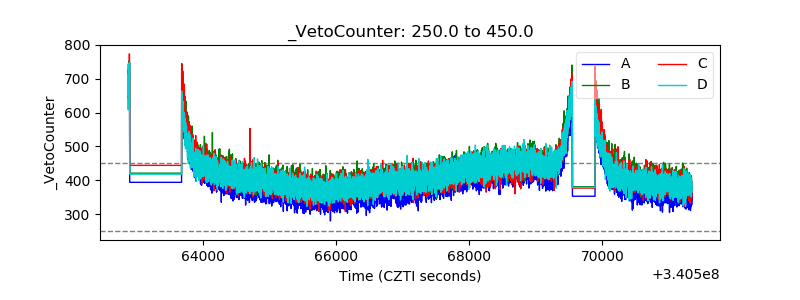 |