| Param | Original file | Final file |
|---|---|---|
| Filename | modeM0/AS1T03_255T01_9000003922_27319cztM0_level2.evt | modeM0/AS1T03_255T01_9000003922_27319cztM0_level2_quad_clean.evt |
| Size (bytes) | 574,678,080 | 109,877,760 |
| Size | 548.1 MB | 104.8 MB |
| Events in quadrant A | 3,835,789 | 718,882 |
| Events in quadrant B | 4,496,559 | 716,345 |
| Events in quadrant C | 4,144,454 | 679,144 |
| Events in quadrant D | 4,396,325 | 668,655 |
| Mode M9 | |||
|---|---|---|---|
| Quadrant | BADHDUFLAG | Total packets | Discarded packets |
| A | 0 | 6 | 0 |
| B | 0 | 6 | 0 |
| C | 0 | 6 | 0 |
| D | 0 | 6 | 0 |
| Mode M0 | |||
|---|---|---|---|
| Quadrant | BADHDUFLAG | Total packets | Discarded packets |
| A | 0 | 16467 | 0 |
| B | 0 | 18239 | 0 |
| C | 0 | 17335 | 0 |
| D | 0 | 18506 | 0 |
| Quadrant | Total seconds | Saturated seconds | Saturation percentage |
|---|---|---|---|
| A | 7832 | 60 | 0.766088% |
| B | 7833 | 177 | 2.259671% |
| C | 7833 | 178 | 2.272437% |
| D | 7833 | 130 | 1.659645% |
Noise dominated data is calculated using 1-second bins in cleaned event files. If a bin has >2000 counts, and if more than 50% of those come from <1% of pixels, then it is considered to be noise-dominated and hence unusable.
| Quadrant | # 1 sec bins | Bins with >0 counts | Bins with >2000 counts | High rate bins dominated by noise | Noise dominated (total time) | Noise dominated (detector-on time) | Marked lightcurve |
|---|---|---|---|---|---|---|---|
| A | 8442 | 7834 | 3 | 3 | 0.04% | 0.04% | 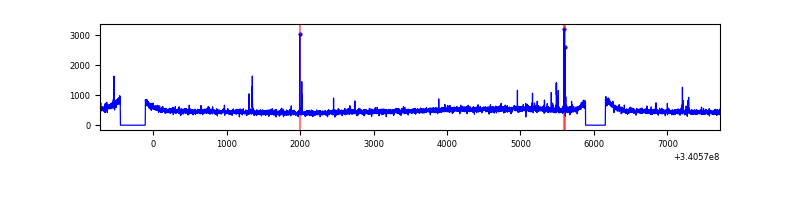 |
| B | 8443 | 7835 | 50 | 50 | 0.59% | 0.64% | 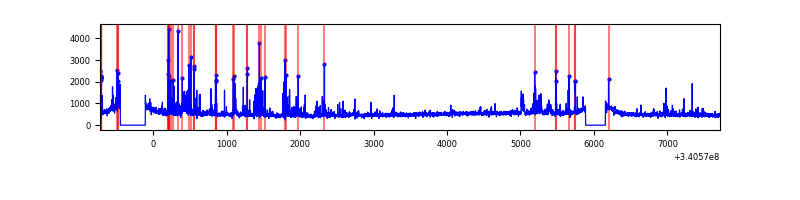 |
| C | 8443 | 7835 | 28 | 28 | 0.33% | 0.36% | 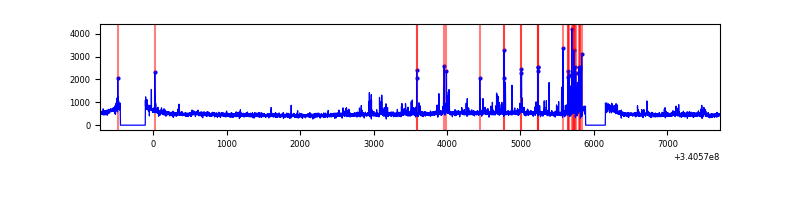 |
| D | 8443 | 7835 | 56 | 56 | 0.66% | 0.71% | 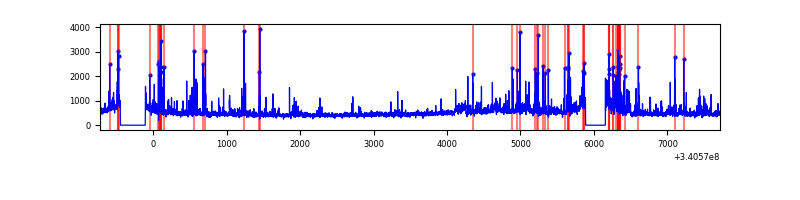 |
Top three noisy pixels from each quadrant. If the there are fewer than three noisy pixels in the level2.evt file, extra rows are filled as -1
| Pixel properties | Quadrant properties | ||||||
|---|---|---|---|---|---|---|---|
| Quadrant | DetID | PixID | Counts | Sigma | Mean | Median | Sigma |
| A | 14 | 235 | 30093 | 146.49 | 980 | 960 | 198.9 |
| A | 13 | 248 | 22533 | 108.47 | 980 | 960 | 198.9 |
| A | 13 | 254 | 14451 | 67.84 | 980 | 960 | 198.9 |
| B | 3 | 64 | 283688 | 1532.17 | 969 | 946 | 184.5 |
| B | 5 | 172 | 138669 | 746.32 | 969 | 946 | 184.5 |
| B | 7 | 205 | 108976 | 585.41 | 969 | 946 | 184.5 |
| C | 2 | 16 | 199823 | 906.94 | 926 | 929 | 219.3 |
| C | 14 | 238 | 146076 | 661.86 | 926 | 929 | 219.3 |
| C | 0 | 207 | 116570 | 527.31 | 926 | 929 | 219.3 |
| D | 2 | 250 | 260859 | 1157.86 | 935 | 911 | 224.5 |
| D | 1 | 52 | 230053 | 1020.64 | 935 | 911 | 224.5 |
| D | 10 | 103 | 125163 | 553.44 | 935 | 911 | 224.5 |
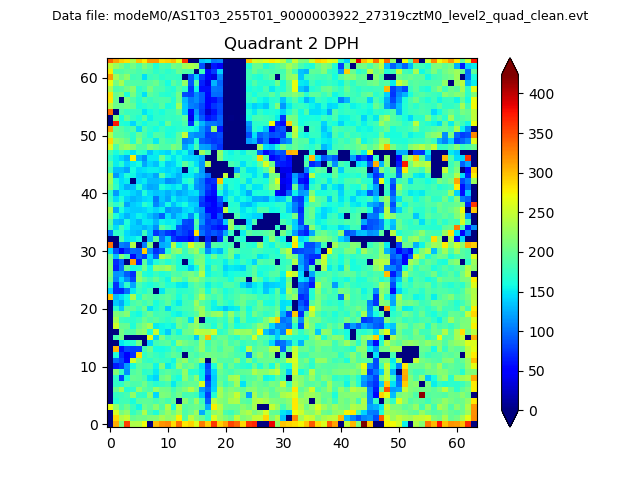
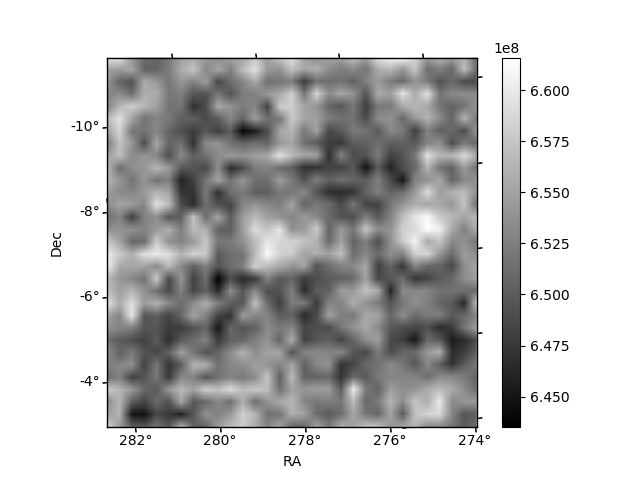
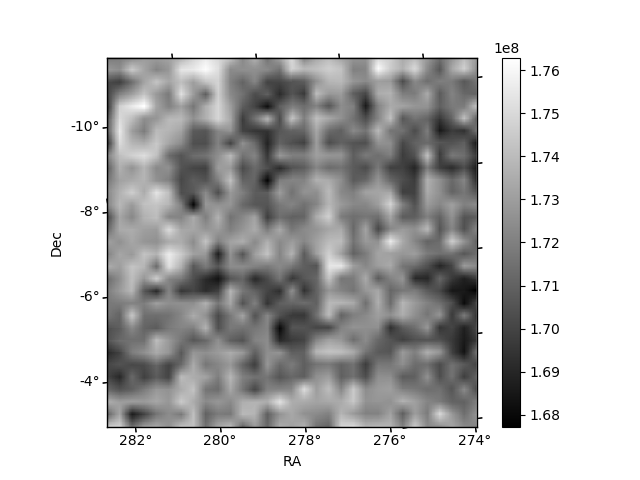
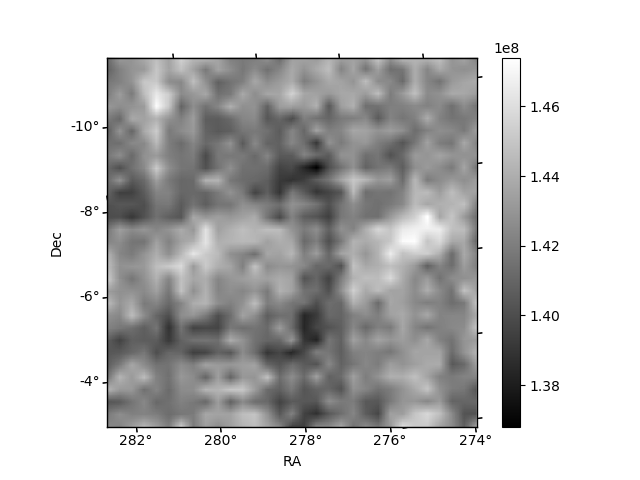
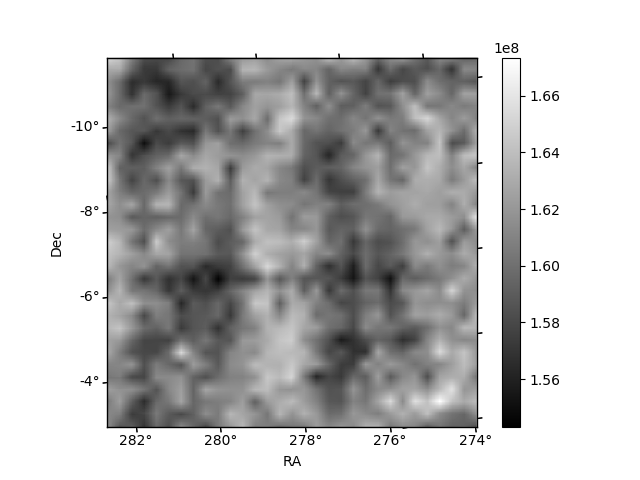
Histogram calculated using DETX and DETY for each event in the final _common_clean file
| Quadrant A | 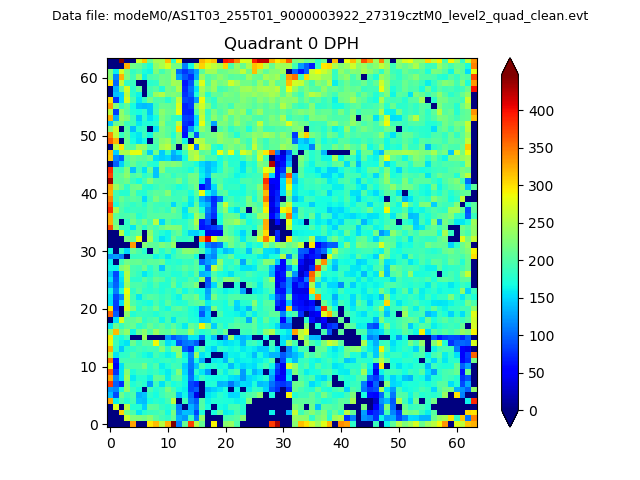 |
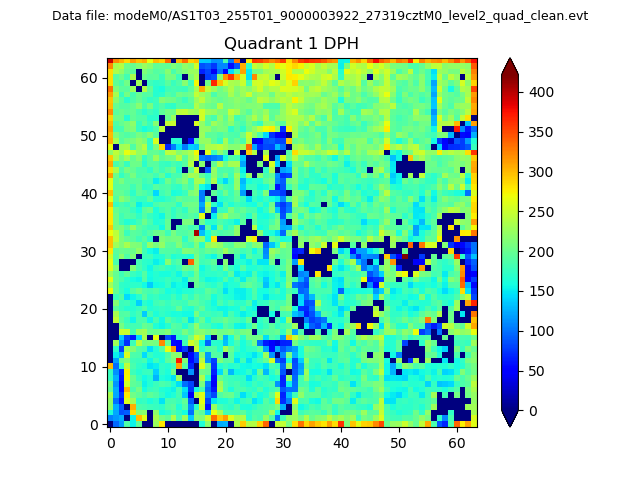 |
Quadrant B |
|---|---|---|---|
| Quadrant D | 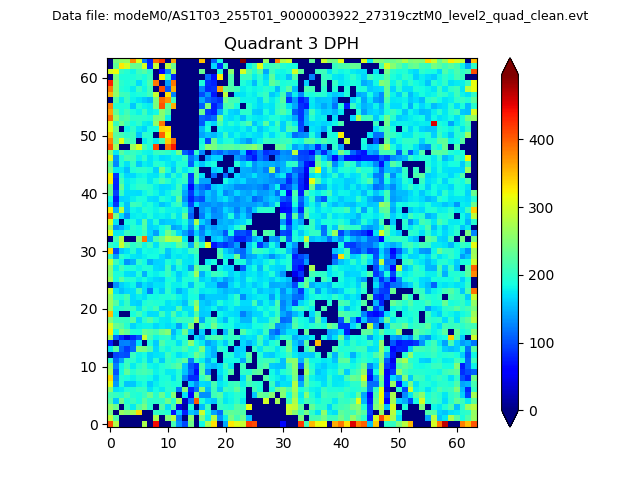 |
 |
Quadrant C |
| Plot type | Count rate plots | Images |
|---|---|---|
| Comparison with Poisson distribution Blue bars denote a histogram of data divided into 1 sec bins. Red curve is a Poisson curve with rate = median count rate of data. |
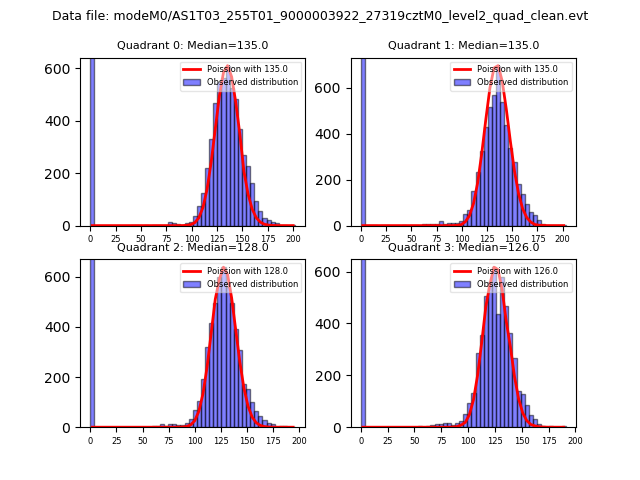 |
 |
| Quadrant-wise count rates Data is divided into 100 sec bins |
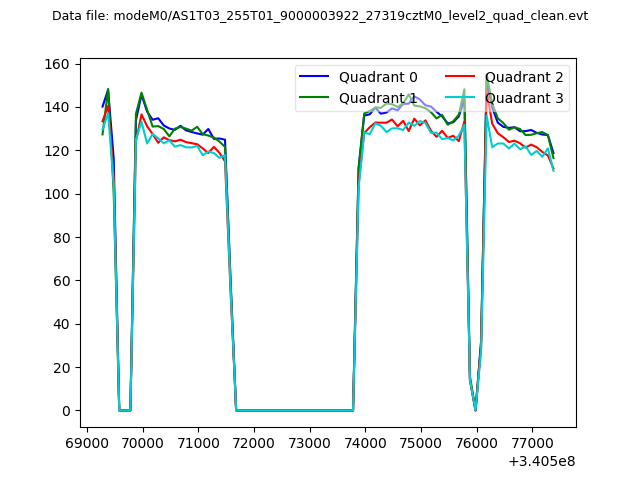 |
|
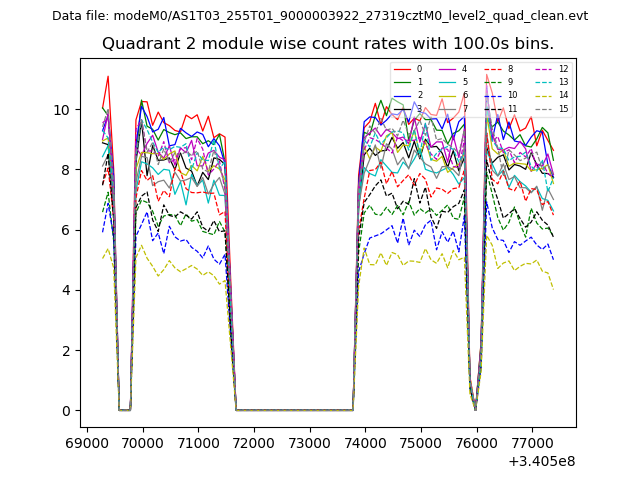
| Module-wise count rates for Quadrant A Data is divided into 100 sec bins |
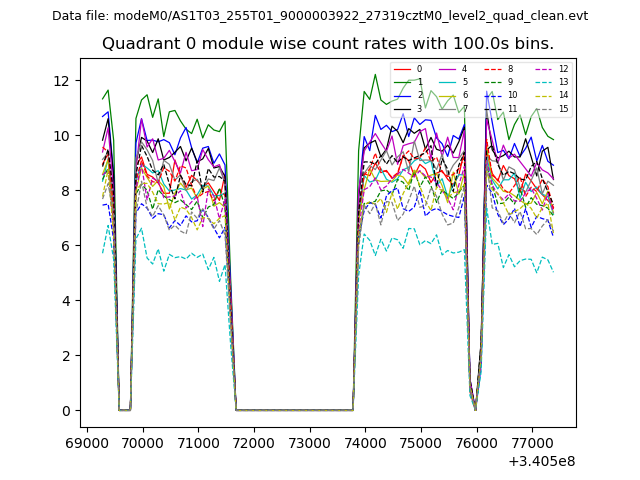 |
 |
| Module-wise count rates for Quadrant B Data is divided into 100 sec bins |
 |
 |
| Module-wise count rates for Quadrant C Data is divided into 100 sec bins |
 |
 |
| Module-wise count rates for Quadrant D Data is divided into 100 sec bins |
 |
 |
| Parameter | Plot |
|---|---|
| CZT HV Monitor |  |
| D_VDD | 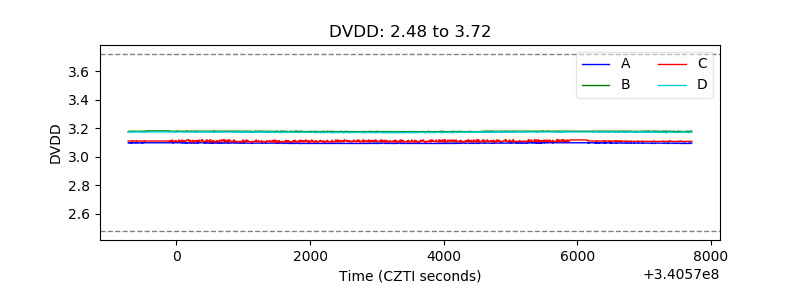 |
| Temperature 1 | 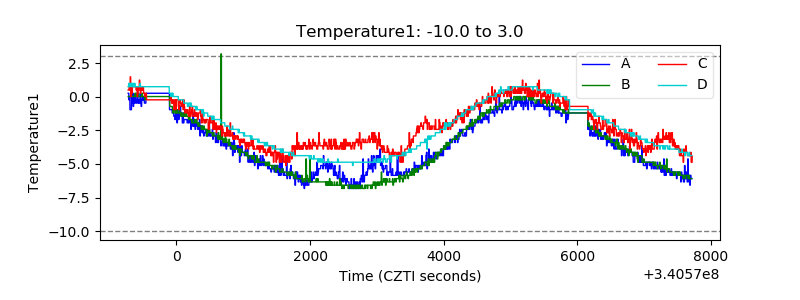 |
| Veto HV Monitor | 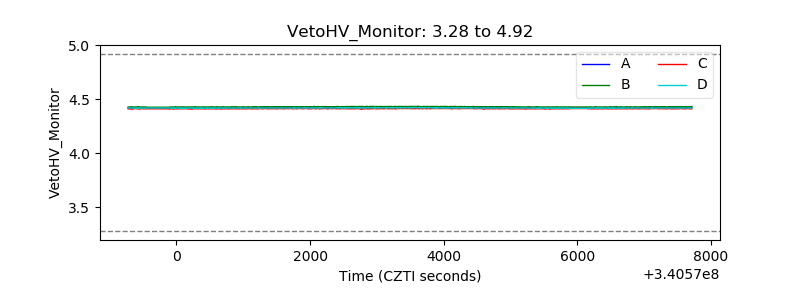 |
| Veto LLD |  |
| Alpha Counter | 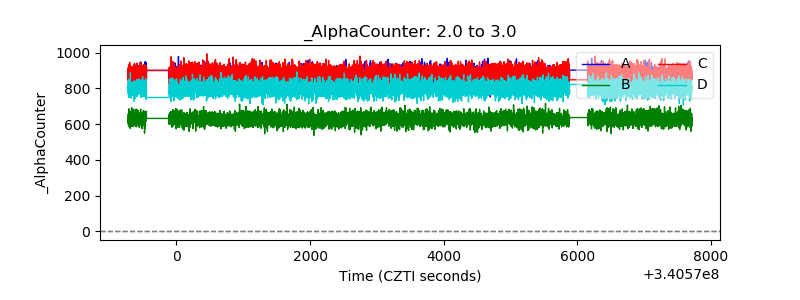 |
| _CPM_Rate | 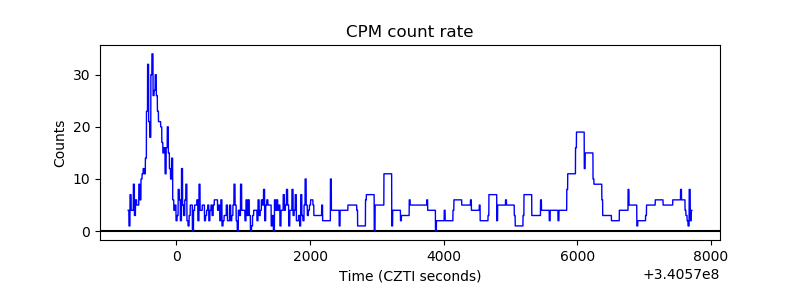 |
| CZT Counter | 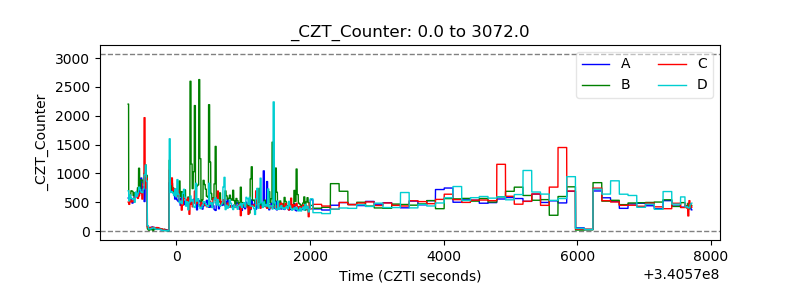 |
| +2.5 Volts monitor |  |
| +5 Volts monitor |  |
| _ROLL_ROT | 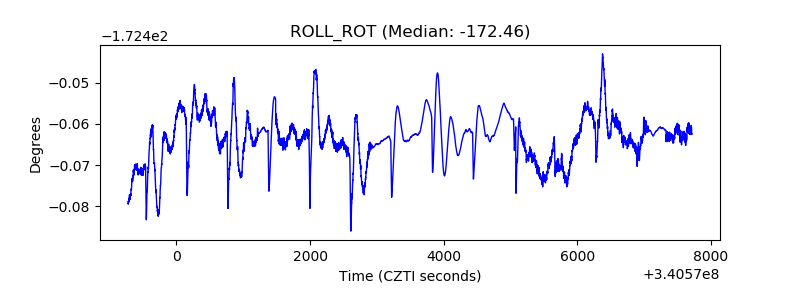 |
| _Roll_DEC |  |
| _Roll_RA | 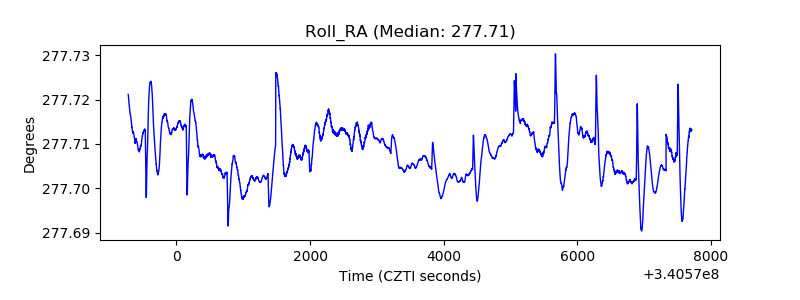 |
| Veto Counter | 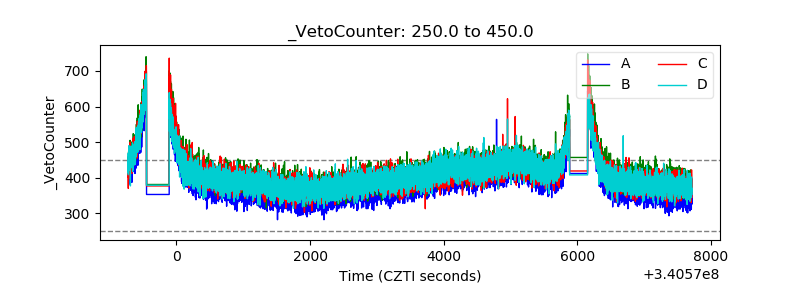 |