| Param | Original file | Final file |
|---|---|---|
| Filename | modeM0/AS1T03_255T01_9000003922_27322cztM0_level2.evt | modeM0/AS1T03_255T01_9000003922_27322cztM0_level2_quad_clean.evt |
| Size (bytes) | 1,377,794,880 | 228,778,560 |
| Size | 1.3 GB | 218.2 MB |
| Events in quadrant A | 9,501,841 | 1,439,691 |
| Events in quadrant B | 10,004,432 | 1,449,107 |
| Events in quadrant C | 9,487,840 | 1,378,101 |
| Events in quadrant D | 11,437,106 | 1,341,070 |
| Mode M9 | |||
|---|---|---|---|
| Quadrant | BADHDUFLAG | Total packets | Discarded packets |
| A | 0 | 19 | 0 |
| B | 0 | 19 | 0 |
| C | 0 | 19 | 0 |
| D | 0 | 19 | 0 |
| Mode M0 | |||
|---|---|---|---|
| Quadrant | BADHDUFLAG | Total packets | Discarded packets |
| A | 0 | 40324 | 0 |
| B | 0 | 41266 | 0 |
| C | 0 | 40127 | 0 |
| D | 0 | 46676 | 0 |
| Quadrant | Total seconds | Saturated seconds | Saturation percentage |
|---|---|---|---|
| A | 19171 | 183 | 0.954567% |
| B | 19171 | 248 | 1.293621% |
| C | 19172 | 259 | 1.350928% |
| D | 19172 | 352 | 1.836011% |
Noise dominated data is calculated using 1-second bins in cleaned event files. If a bin has >2000 counts, and if more than 50% of those come from <1% of pixels, then it is considered to be noise-dominated and hence unusable.
| Quadrant | # 1 sec bins | Bins with >0 counts | Bins with >2000 counts | High rate bins dominated by noise | Noise dominated (total time) | Noise dominated (detector-on time) | Marked lightcurve |
|---|---|---|---|---|---|---|---|
| A | 21146 | 19175 | 48 | 48 | 0.23% | 0.25% | 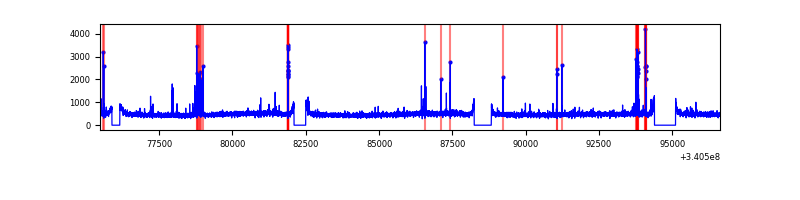 |
| B | 21146 | 19175 | 50 | 50 | 0.24% | 0.26% | 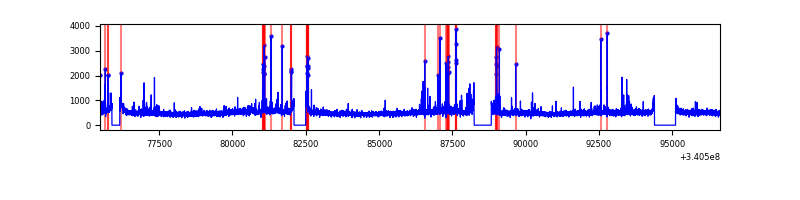 |
| C | 21147 | 19176 | 16 | 16 | 0.08% | 0.08% | 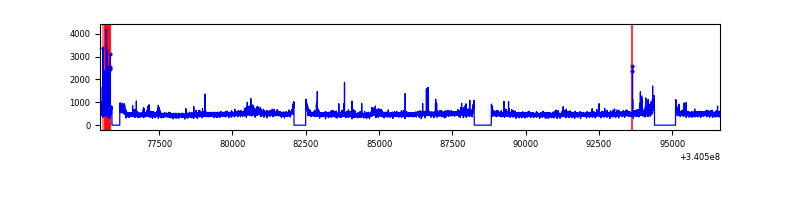 |
| D | 21147 | 19176 | 188 | 188 | 0.89% | 0.98% | 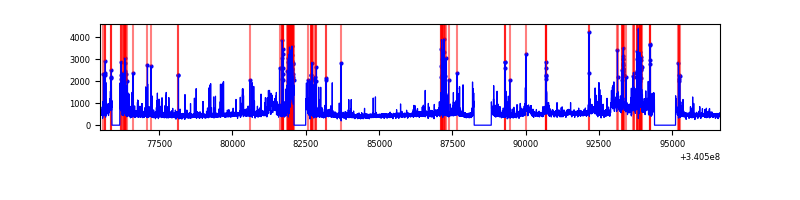 |
Top three noisy pixels from each quadrant. If the there are fewer than three noisy pixels in the level2.evt file, extra rows are filled as -1
| Pixel properties | Quadrant properties | ||||||
|---|---|---|---|---|---|---|---|
| Quadrant | DetID | PixID | Counts | Sigma | Mean | Median | Sigma |
| A | 14 | 235 | 185285 | 386.18 | 2363 | 2313 | 473.8 |
| A | 13 | 248 | 141706 | 294.2 | 2363 | 2313 | 473.8 |
| A | 15 | 174 | 43787 | 87.53 | 2363 | 2313 | 473.8 |
| B | 7 | 205 | 238078 | 530.24 | 2351 | 2294 | 444.7 |
| B | 3 | 64 | 212393 | 472.48 | 2351 | 2294 | 444.7 |
| B | 5 | 172 | 135041 | 298.53 | 2351 | 2294 | 444.7 |
| C | 14 | 238 | 355725 | 669.16 | 2246 | 2255 | 528.2 |
| C | 2 | 16 | 118293 | 219.67 | 2246 | 2255 | 528.2 |
| C | 0 | 207 | 99869 | 184.8 | 2246 | 2255 | 528.2 |
| D | 1 | 52 | 1458124 | 2589.59 | 2254 | 2205 | 562.2 |
| D | 2 | 250 | 474749 | 840.5 | 2254 | 2205 | 562.2 |
| D | 12 | 227 | 355998 | 629.28 | 2254 | 2205 | 562.2 |
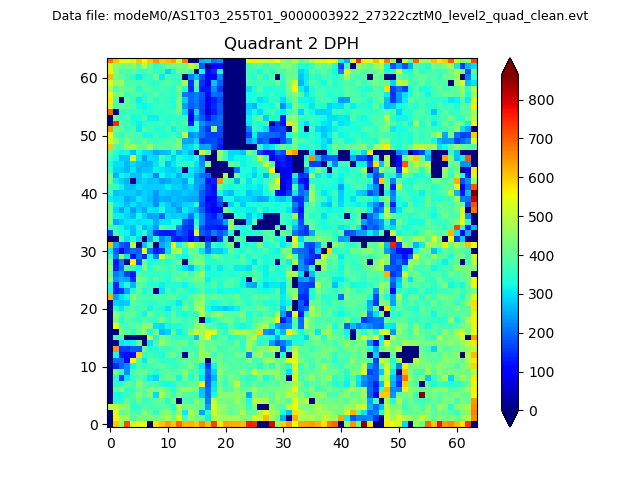
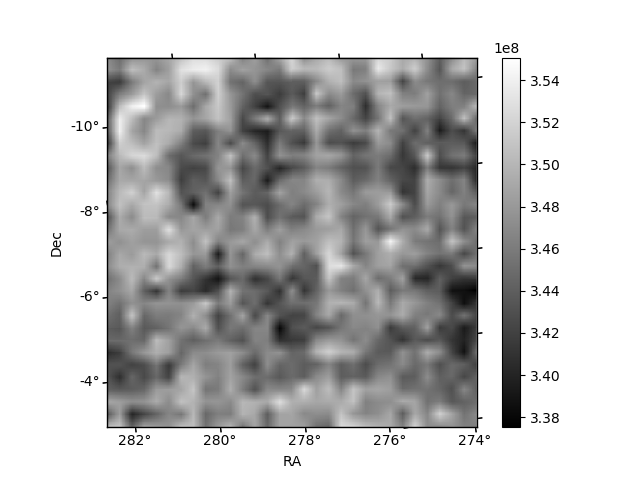
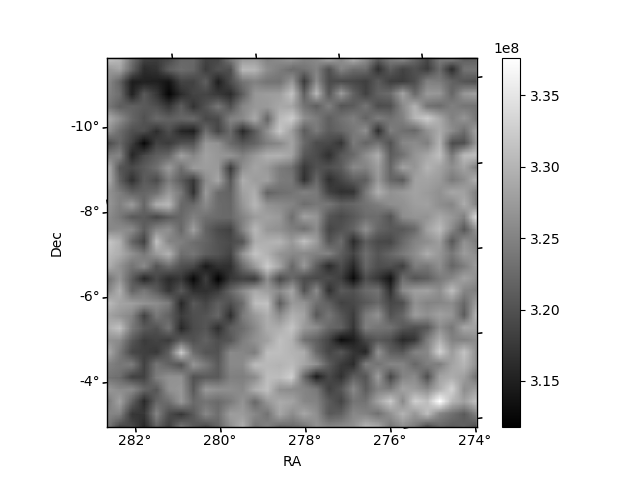
Histogram calculated using DETX and DETY for each event in the final _common_clean file
| Quadrant A | 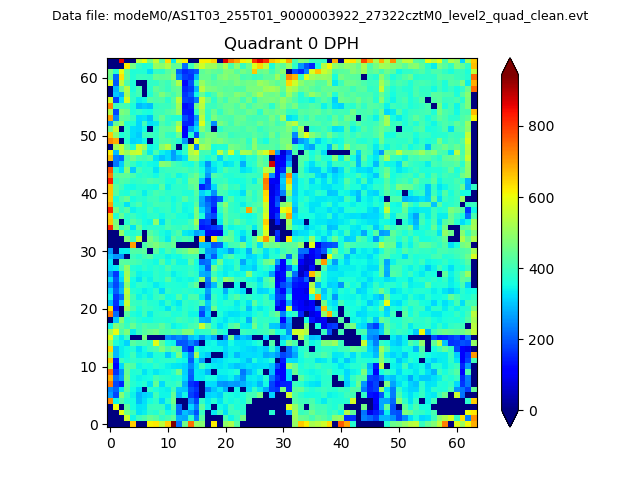 |
 |
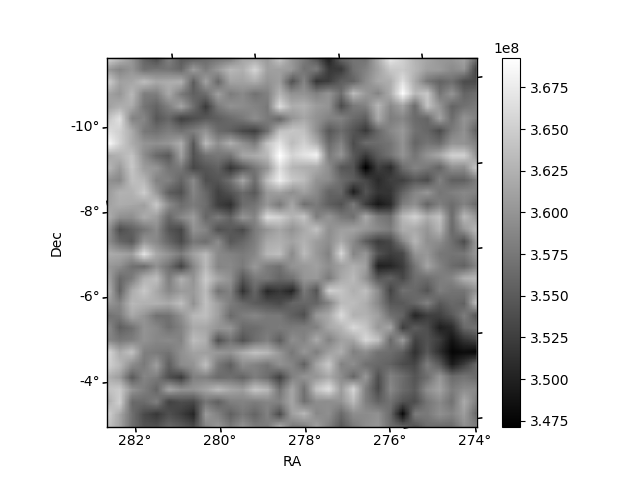
Quadrant B |
|---|---|---|---|
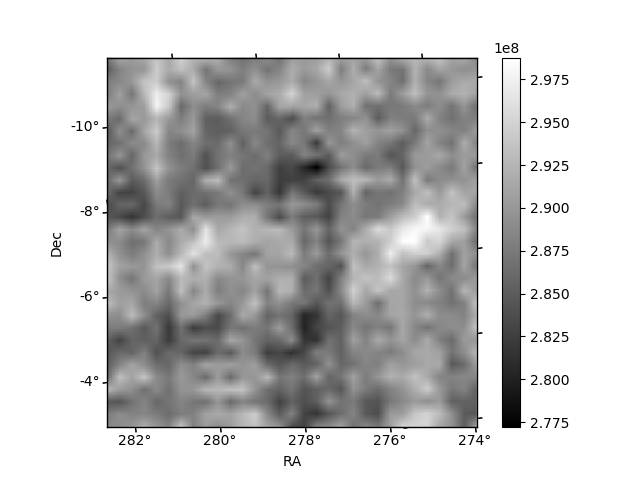
| Quadrant D |  |
 |
Quadrant C |
| Plot type | Count rate plots | Images |
|---|---|---|
| Comparison with Poisson distribution Blue bars denote a histogram of data divided into 1 sec bins. Red curve is a Poisson curve with rate = median count rate of data. |
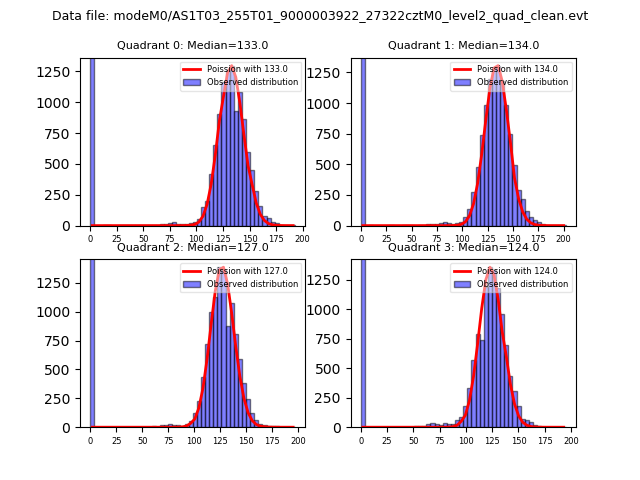 |
 |
| Quadrant-wise count rates Data is divided into 100 sec bins |
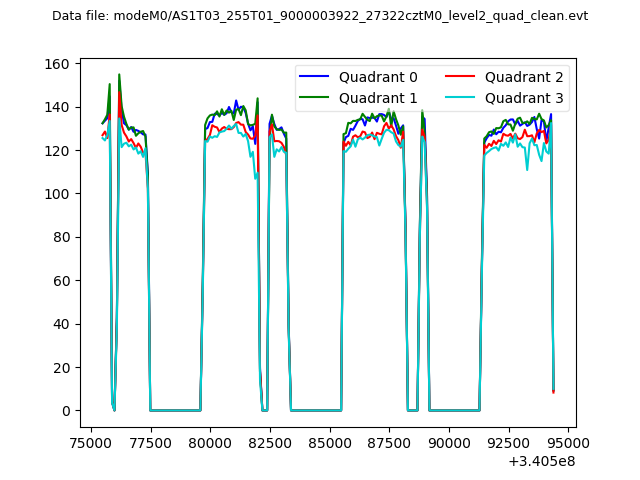 |
|
| Module-wise count rates for Quadrant A Data is divided into 100 sec bins |
 |
 |
| Module-wise count rates for Quadrant B Data is divided into 100 sec bins |
 |
 |
| Module-wise count rates for Quadrant C Data is divided into 100 sec bins |
 |
 |
| Module-wise count rates for Quadrant D Data is divided into 100 sec bins |
 |
 |
| Parameter | Plot |
|---|---|
| CZT HV Monitor |  |
| D_VDD | 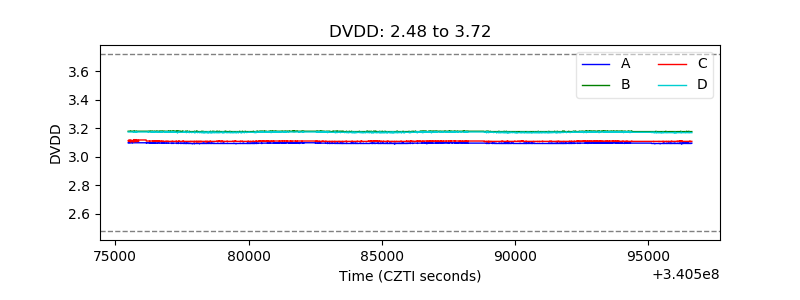 |
| Temperature 1 | 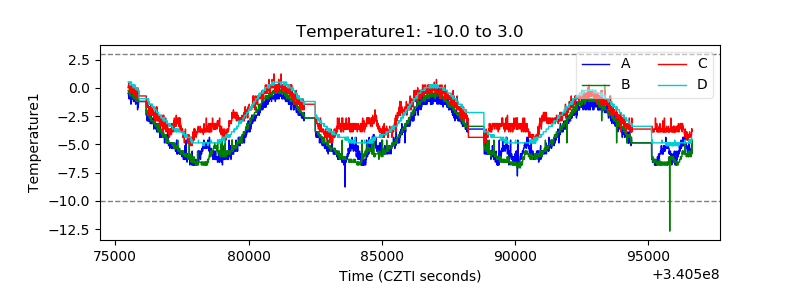 |
| Veto HV Monitor | 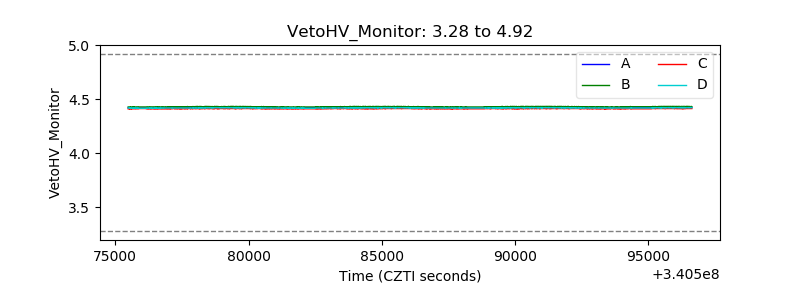 |
| Veto LLD | 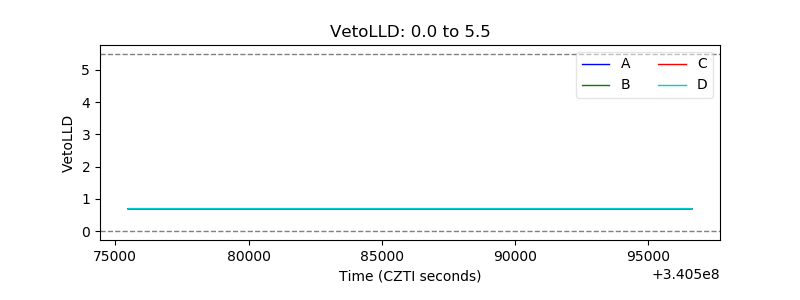 |
| Alpha Counter | 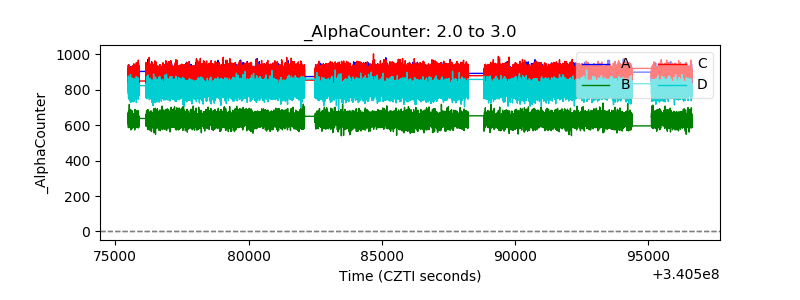 |
| _CPM_Rate | 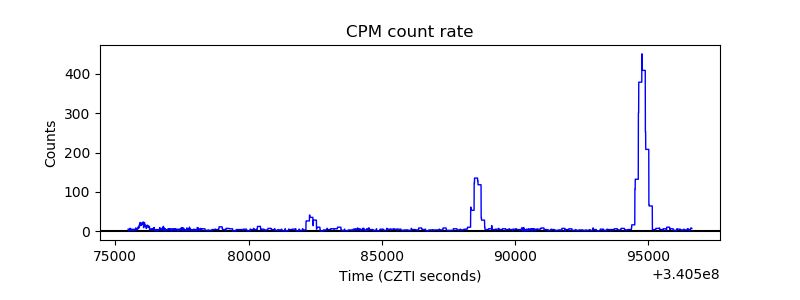 |
| CZT Counter | 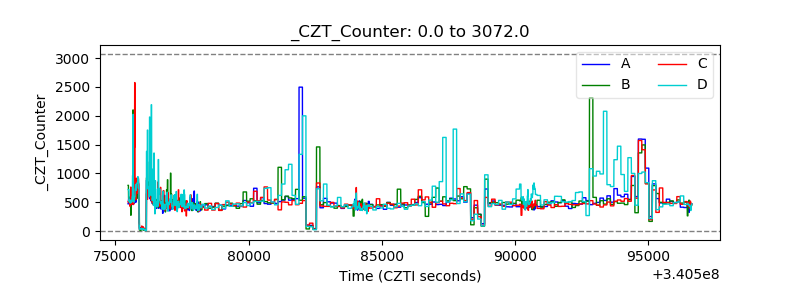 |
| +2.5 Volts monitor |  |
| +5 Volts monitor |  |
| _ROLL_ROT | 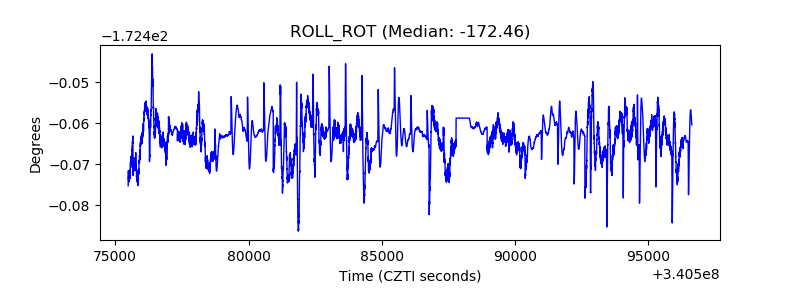 |
| _Roll_DEC | 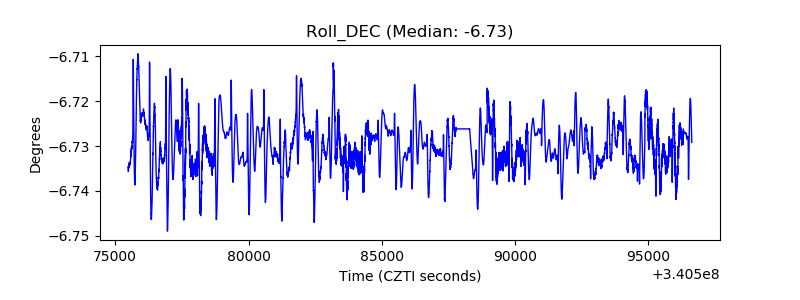 |
| _Roll_RA | 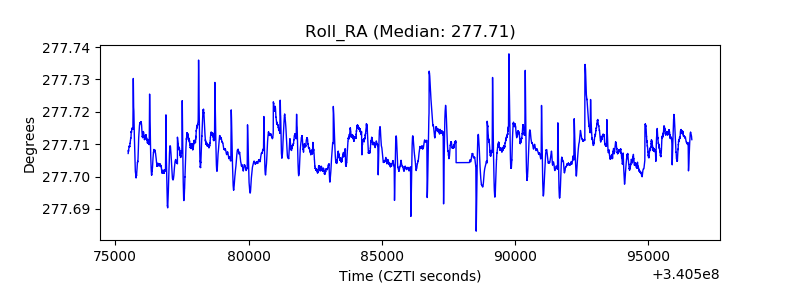 |
| Veto Counter | 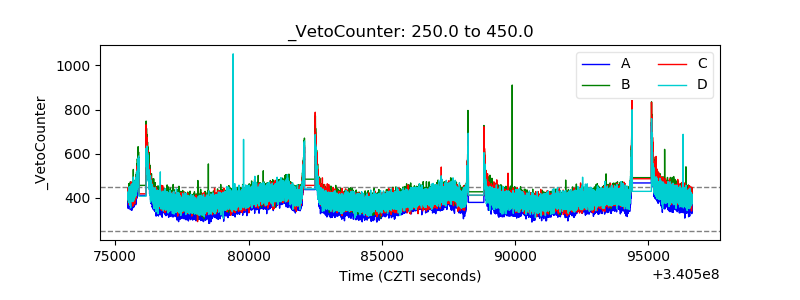 |