| Param | Original file | Final file |
|---|---|---|
| Filename | modeM0/AS1T03_255T01_9000003922_27323cztM0_level2.evt | modeM0/AS1T03_255T01_9000003922_27323cztM0_level2_quad_clean.evt |
| Size (bytes) | 481,858,560 | 70,058,880 |
| Size | 459.5 MB | 66.8 MB |
| Events in quadrant A | 3,327,540 | 423,848 |
| Events in quadrant B | 3,459,234 | 426,728 |
| Events in quadrant C | 3,381,730 | 405,799 |
| Events in quadrant D | 3,963,869 | 391,943 |
| Mode M9 | |||
|---|---|---|---|
| Quadrant | BADHDUFLAG | Total packets | Discarded packets |
| A | 0 | 11 | 0 |
| B | 0 | 12 | 0 |
| C | 0 | 12 | 0 |
| D | 0 | 12 | 0 |
| Mode M0 | |||
|---|---|---|---|
| Quadrant | BADHDUFLAG | Total packets | Discarded packets |
| A | 0 | 13972 | 0 |
| B | 0 | 14153 | 0 |
| C | 0 | 14129 | 0 |
| D | 0 | 16151 | 0 |
| Quadrant | Total seconds | Saturated seconds | Saturation percentage |
|---|---|---|---|
| A | 6784 | 41 | 0.604363% |
| B | 6784 | 54 | 0.795991% |
| C | 6783 | 96 | 1.415303% |
| D | 6783 | 183 | 2.697921% |
Noise dominated data is calculated using 1-second bins in cleaned event files. If a bin has >2000 counts, and if more than 50% of those come from <1% of pixels, then it is considered to be noise-dominated and hence unusable.
| Quadrant | # 1 sec bins | Bins with >0 counts | Bins with >2000 counts | High rate bins dominated by noise | Noise dominated (total time) | Noise dominated (detector-on time) | Marked lightcurve |
|---|---|---|---|---|---|---|---|
| A | 7689 | 6785 | 0 | 0 | 0.00% | 0.00% | 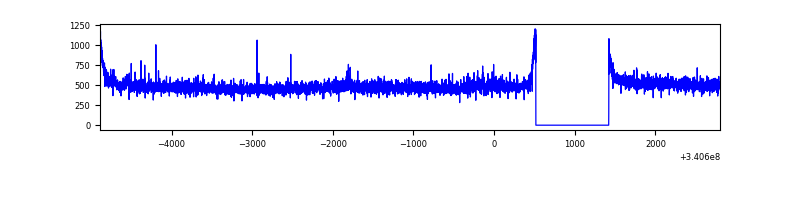 |
| B | 7689 | 6784 | 1 | 1 | 0.01% | 0.01% | 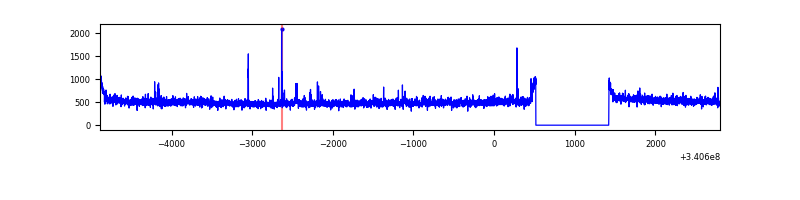 |
| C | 7688 | 6784 | 11 | 11 | 0.14% | 0.16% | 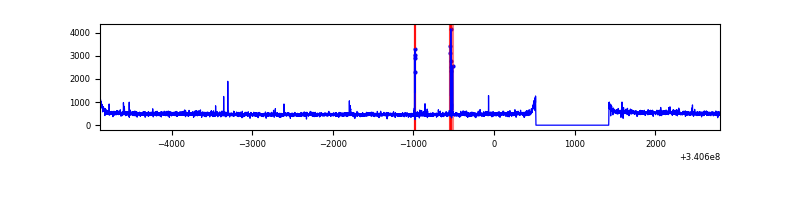 |
| D | 7688 | 6784 | 131 | 131 | 1.70% | 1.93% | 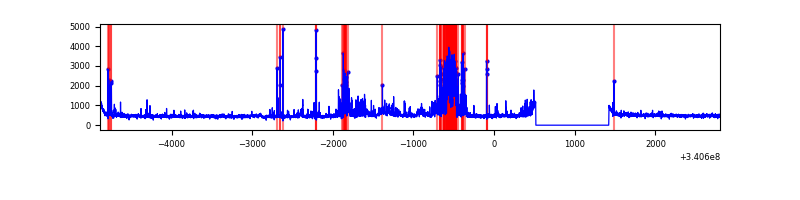 |
Top three noisy pixels from each quadrant. If the there are fewer than three noisy pixels in the level2.evt file, extra rows are filled as -1
| Pixel properties | Quadrant properties | ||||||
|---|---|---|---|---|---|---|---|
| Quadrant | DetID | PixID | Counts | Sigma | Mean | Median | Sigma |
| A | 12 | 189 | 17045 | 93.71 | 854 | 838 | 173.0 |
| A | 13 | 254 | 11450 | 61.36 | 854 | 838 | 173.0 |
| A | 14 | 239 | 10087 | 53.48 | 854 | 838 | 173.0 |
| B | 7 | 205 | 62330 | 378.5 | 850 | 828 | 162.5 |
| B | 12 | 111 | 20207 | 119.26 | 850 | 828 | 162.5 |
| B | 0 | 219 | 19320 | 113.8 | 850 | 828 | 162.5 |
| C | 14 | 238 | 128931 | 670.0 | 812 | 816 | 191.2 |
| C | 15 | 208 | 58122 | 299.69 | 812 | 816 | 191.2 |
| C | 2 | 16 | 23509 | 118.67 | 812 | 816 | 191.2 |
| D | 2 | 250 | 481905 | 2440.55 | 811 | 793 | 197.1 |
| D | 1 | 52 | 147814 | 745.8 | 811 | 793 | 197.1 |
| D | 12 | 227 | 119249 | 600.89 | 811 | 793 | 197.1 |
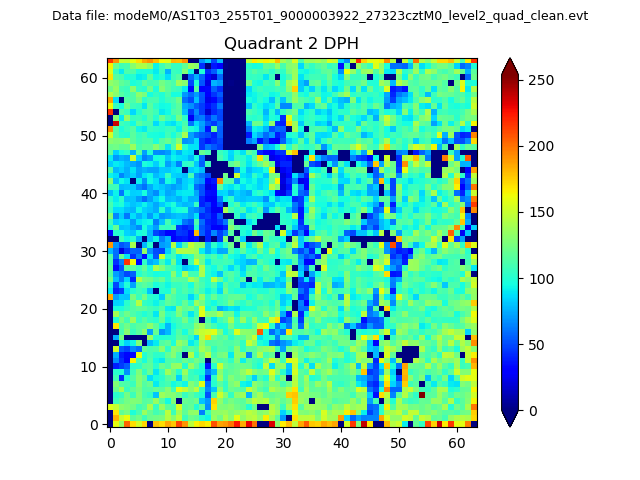
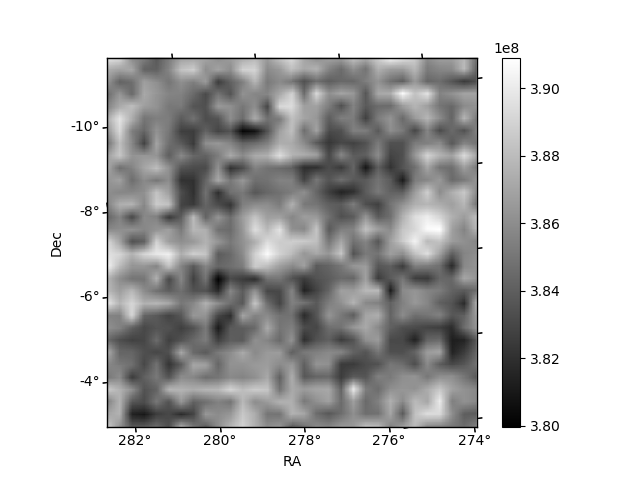
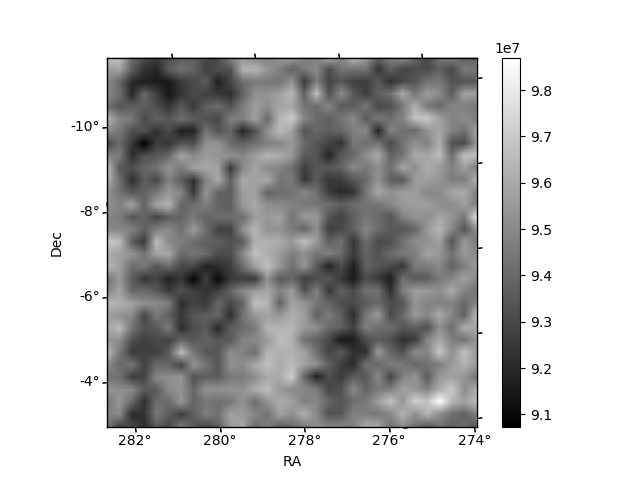
Histogram calculated using DETX and DETY for each event in the final _common_clean file
| Quadrant A | 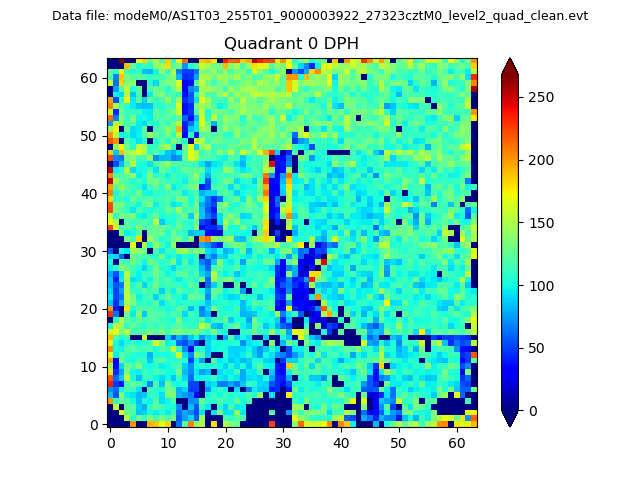 |
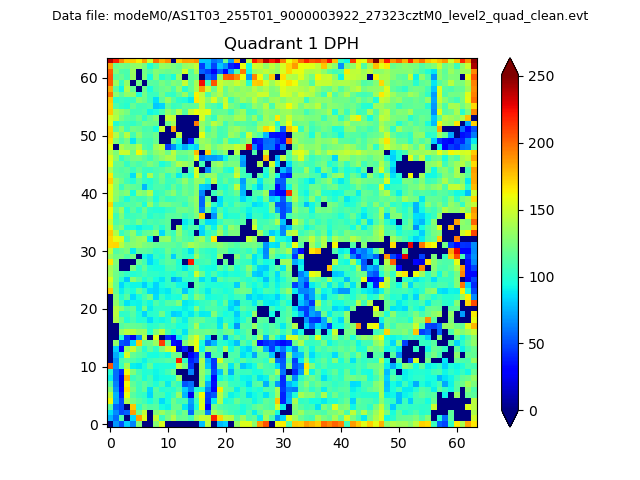 |
Quadrant B |
|---|---|---|---|
| Quadrant D | 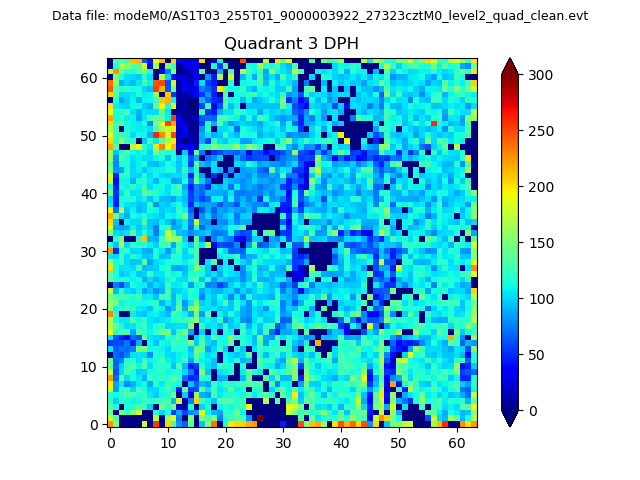 |
 |
Quadrant C |
| Plot type | Count rate plots | Images |
|---|---|---|
| Comparison with Poisson distribution Blue bars denote a histogram of data divided into 1 sec bins. Red curve is a Poisson curve with rate = median count rate of data. |
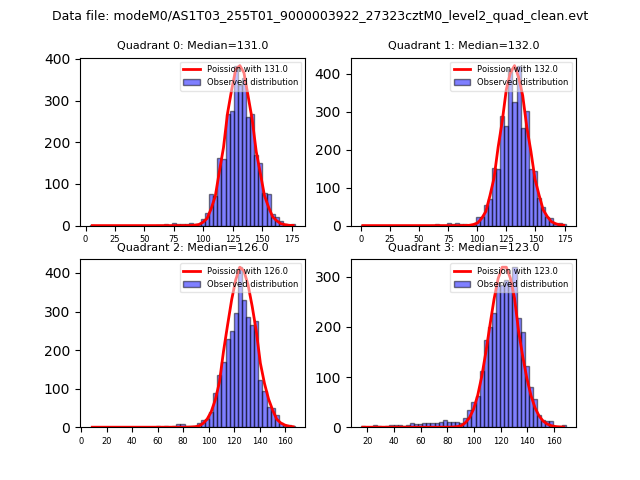 |
 |
| Quadrant-wise count rates Data is divided into 100 sec bins |
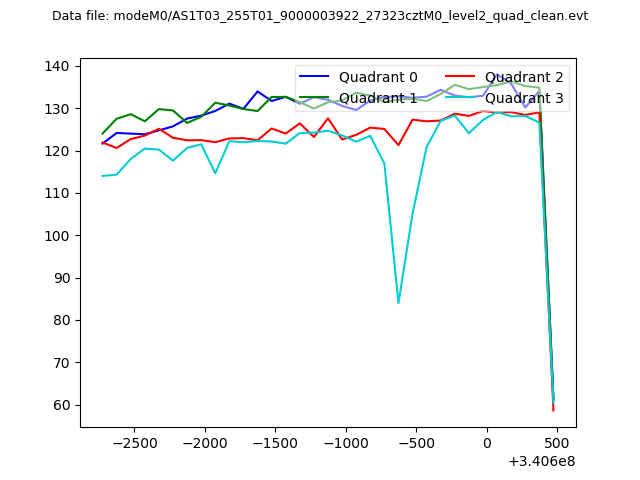 |
|
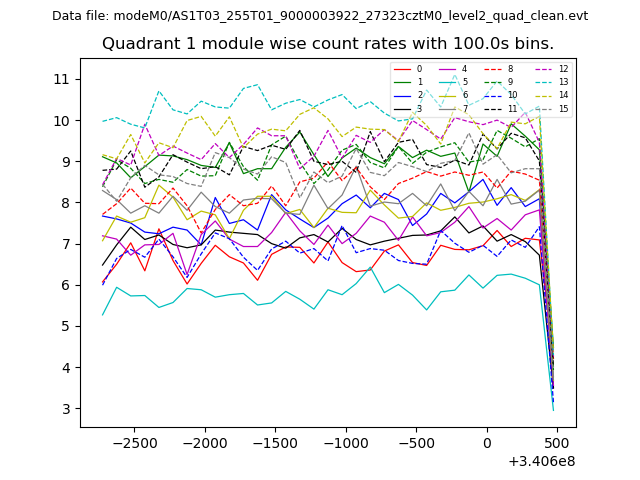
| Module-wise count rates for Quadrant A Data is divided into 100 sec bins |
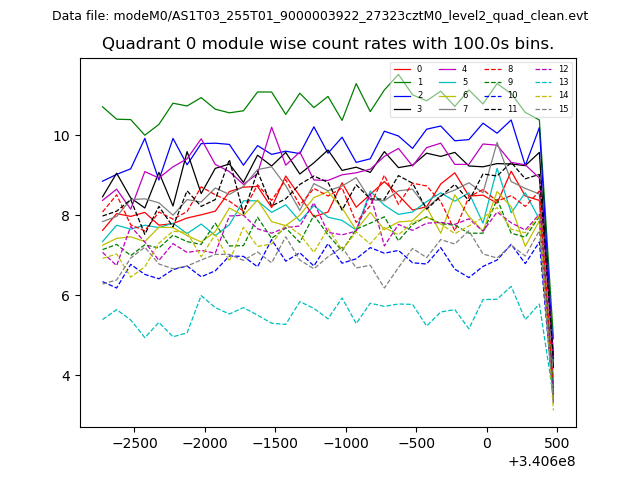 |
 |
| Module-wise count rates for Quadrant B Data is divided into 100 sec bins |
 |
 |
| Module-wise count rates for Quadrant C Data is divided into 100 sec bins |
 |
 |
| Module-wise count rates for Quadrant D Data is divided into 100 sec bins |
 |
 |
| Parameter | Plot |
|---|---|
| CZT HV Monitor | 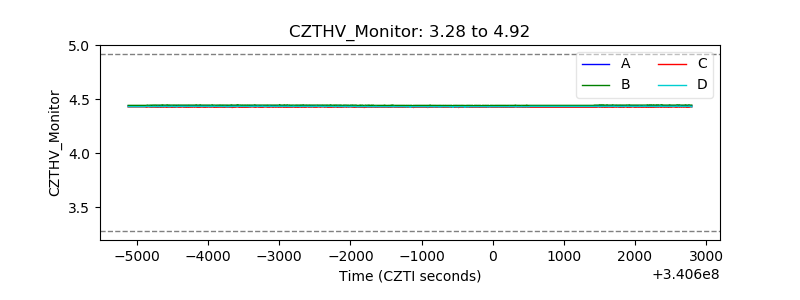 |
| D_VDD | 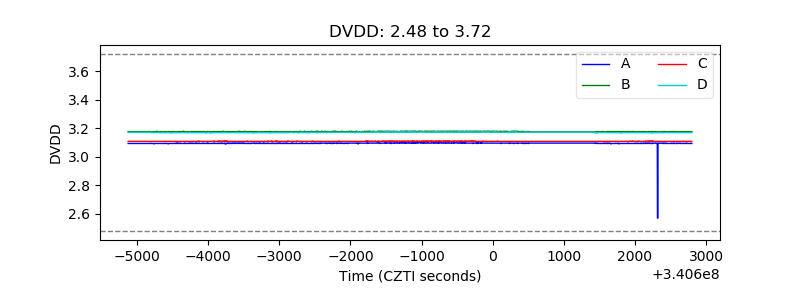 |
| Temperature 1 | 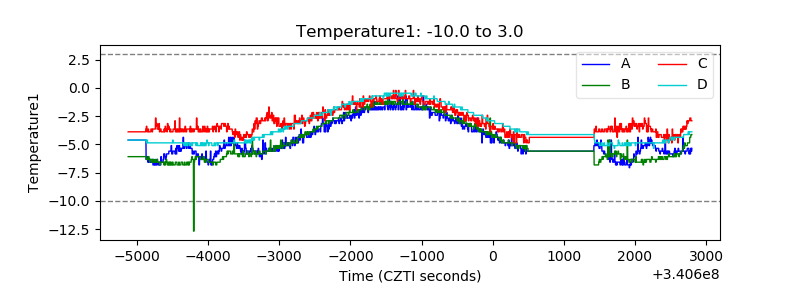 |
| Veto HV Monitor | 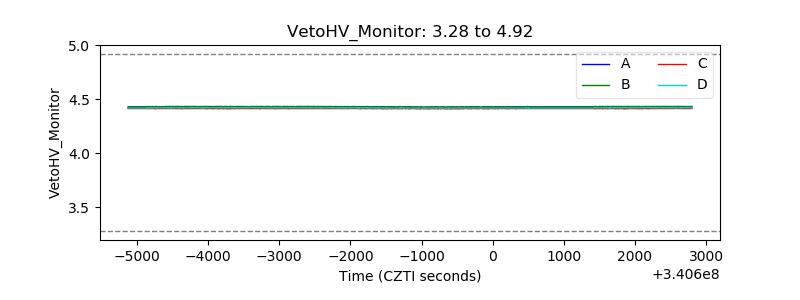 |
| Veto LLD |  |
| Alpha Counter | 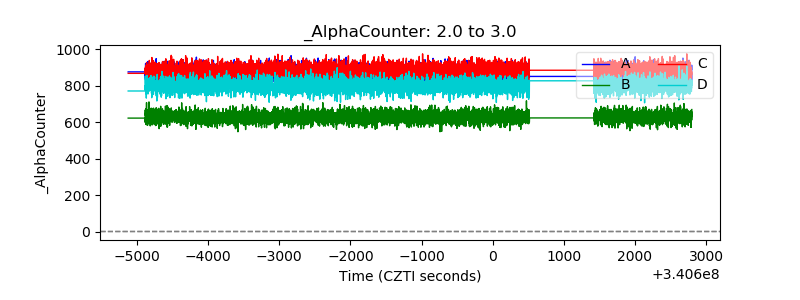 |
| _CPM_Rate | 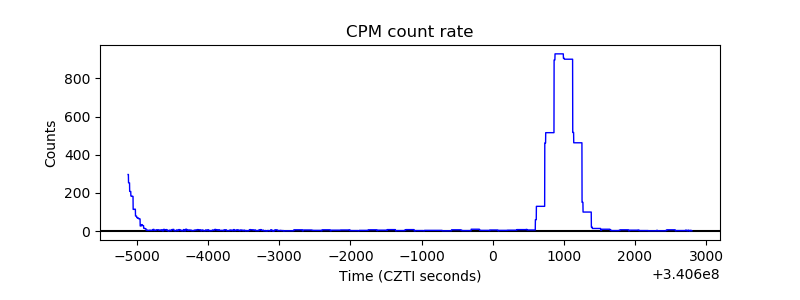 |
| CZT Counter | 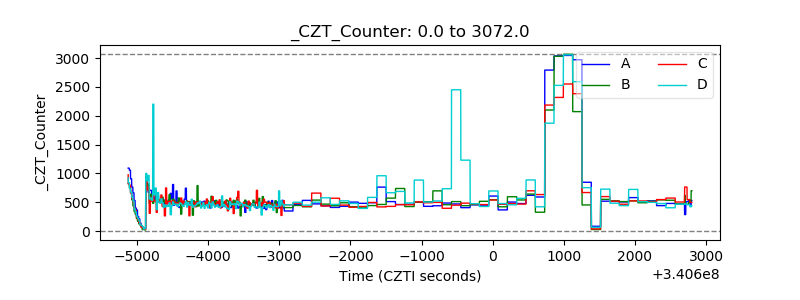 |
| +2.5 Volts monitor |  |
| +5 Volts monitor |  |
| _ROLL_ROT | 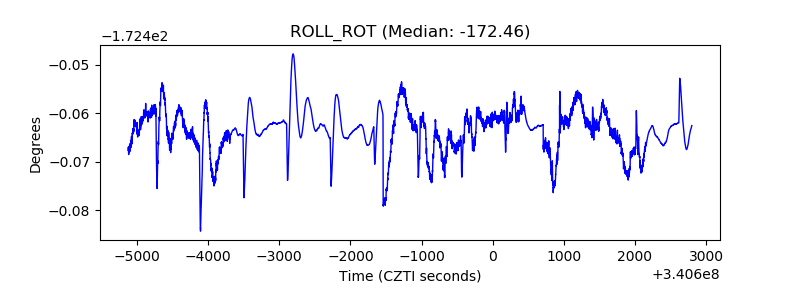 |
| _Roll_DEC | 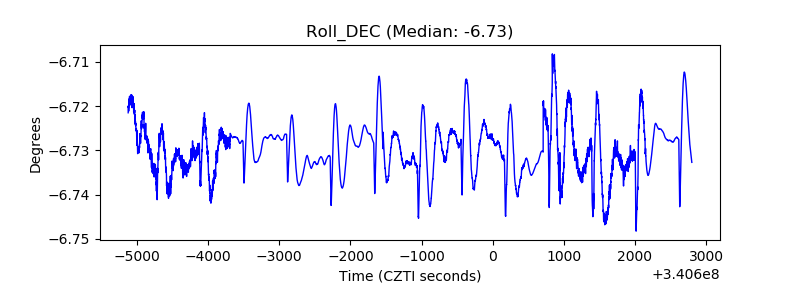 |
| _Roll_RA | 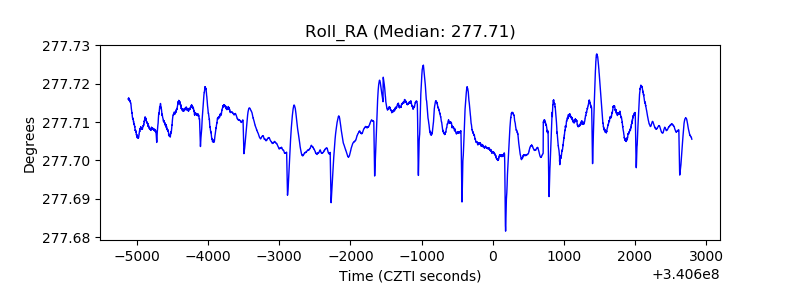 |
| Veto Counter | 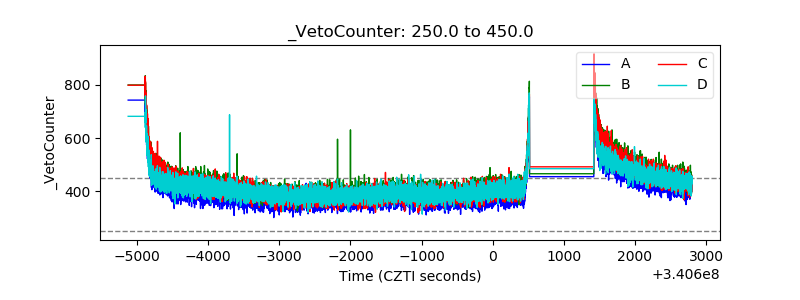 |