| Param | Original file | Final file |
|---|---|---|
| Filename | modeM0/AS1T03_255T01_9000003922_27324cztM0_level2.evt | modeM0/AS1T03_255T01_9000003922_27324cztM0_level2_quad_clean.evt |
| Size (bytes) | 470,871,360 | 77,814,720 |
| Size | 449.1 MB | 74.2 MB |
| Events in quadrant A | 3,348,373 | 485,307 |
| Events in quadrant B | 3,495,218 | 490,332 |
| Events in quadrant C | 3,341,700 | 465,125 |
| Events in quadrant D | 3,628,112 | 456,671 |
| Mode M9 | |||
|---|---|---|---|
| Quadrant | BADHDUFLAG | Total packets | Discarded packets |
| A | 0 | 12 | 0 |
| B | 0 | 13 | 0 |
| C | 0 | 13 | 0 |
| D | 0 | 13 | 0 |
| Mode M0 | |||
|---|---|---|---|
| Quadrant | BADHDUFLAG | Total packets | Discarded packets |
| A | 0 | 13924 | 0 |
| B | 0 | 14218 | 0 |
| C | 0 | 13961 | 0 |
| D | 0 | 14839 | 0 |
| Quadrant | Total seconds | Saturated seconds | Saturation percentage |
|---|---|---|---|
| A | 6579 | 60 | 0.911993% |
| B | 6579 | 88 | 1.337589% |
| C | 6579 | 118 | 1.793586% |
| D | 6579 | 108 | 1.641587% |
Noise dominated data is calculated using 1-second bins in cleaned event files. If a bin has >2000 counts, and if more than 50% of those come from <1% of pixels, then it is considered to be noise-dominated and hence unusable.
| Quadrant | # 1 sec bins | Bins with >0 counts | Bins with >2000 counts | High rate bins dominated by noise | Noise dominated (total time) | Noise dominated (detector-on time) | Marked lightcurve |
|---|---|---|---|---|---|---|---|
| A | 7619 | 6579 | 0 | 0 | 0.00% | 0.00% | 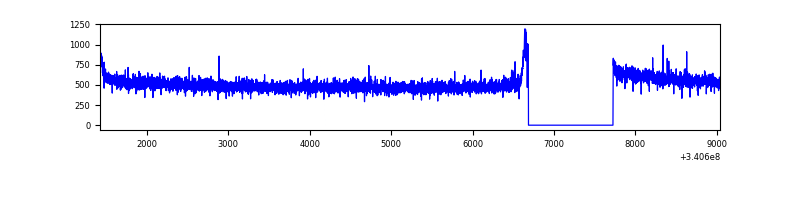 |
| B | 7619 | 6579 | 1 | 1 | 0.01% | 0.02% | 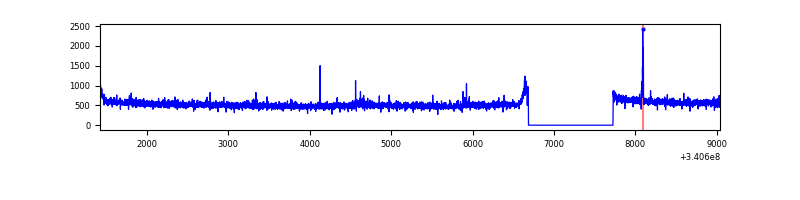 |
| C | 7619 | 6579 | 0 | 0 | 0.00% | 0.00% | 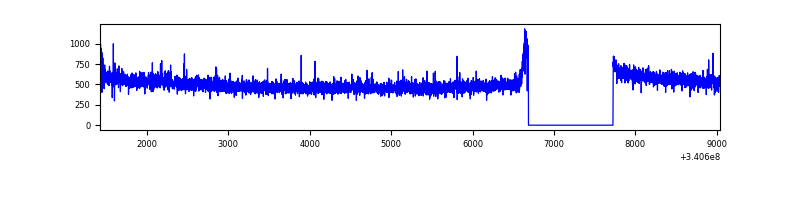 |
| D | 7619 | 6579 | 52 | 52 | 0.68% | 0.79% | 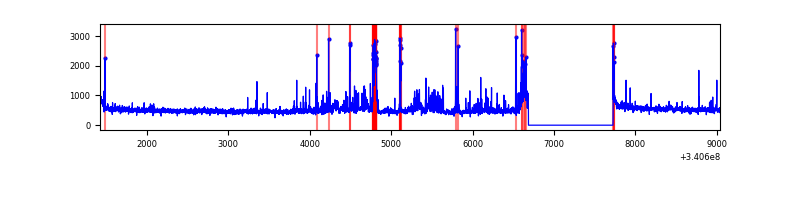 |
Top three noisy pixels from each quadrant. If the there are fewer than three noisy pixels in the level2.evt file, extra rows are filled as -1
| Pixel properties | Quadrant properties | ||||||
|---|---|---|---|---|---|---|---|
| Quadrant | DetID | PixID | Counts | Sigma | Mean | Median | Sigma |
| A | 12 | 189 | 12143 | 65.26 | 864 | 849 | 173.1 |
| A | 13 | 254 | 10771 | 57.33 | 864 | 849 | 173.1 |
| A | 3 | 137 | 7787 | 40.09 | 864 | 849 | 173.1 |
| B | 7 | 205 | 75019 | 454.16 | 857 | 835 | 163.3 |
| B | 0 | 219 | 35143 | 210.03 | 857 | 835 | 163.3 |
| B | 12 | 111 | 19797 | 116.09 | 857 | 835 | 163.3 |
| C | 14 | 238 | 131394 | 682.81 | 819 | 826 | 191.2 |
| C | 2 | 16 | 13981 | 68.79 | 819 | 826 | 191.2 |
| C | 13 | 61 | 5586 | 24.89 | 819 | 826 | 191.2 |
| D | 2 | 250 | 199654 | 998.21 | 824 | 806 | 199.2 |
| D | 12 | 227 | 109583 | 546.06 | 824 | 806 | 199.2 |
| D | 1 | 52 | 80390 | 399.51 | 824 | 806 | 199.2 |
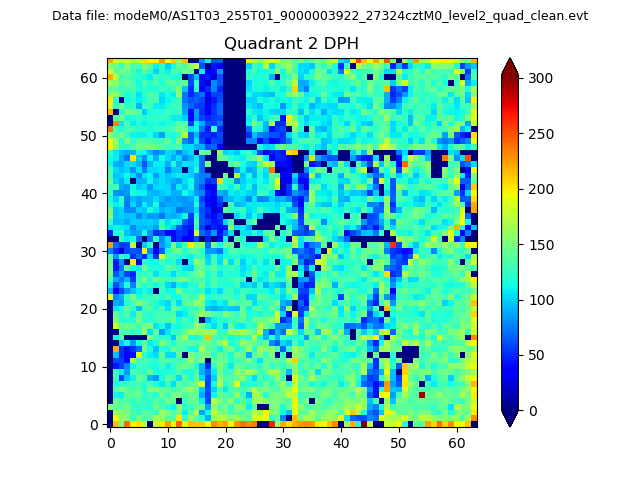
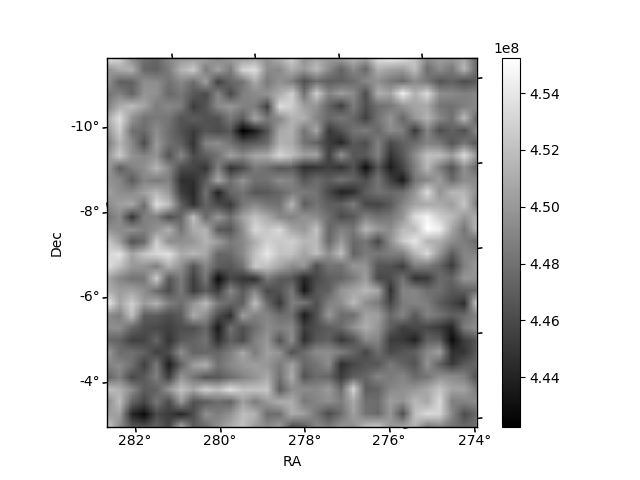
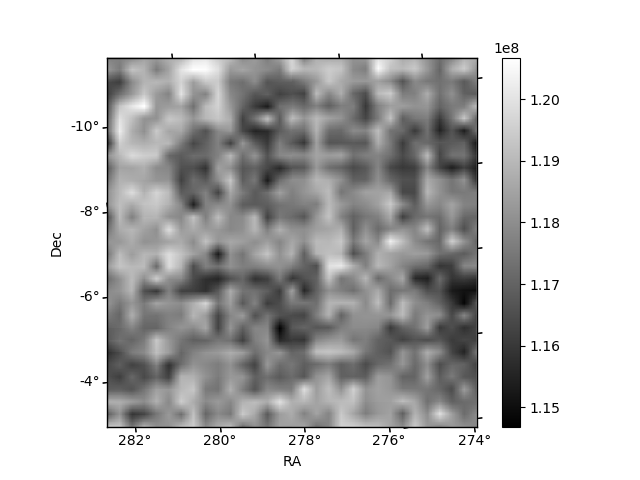
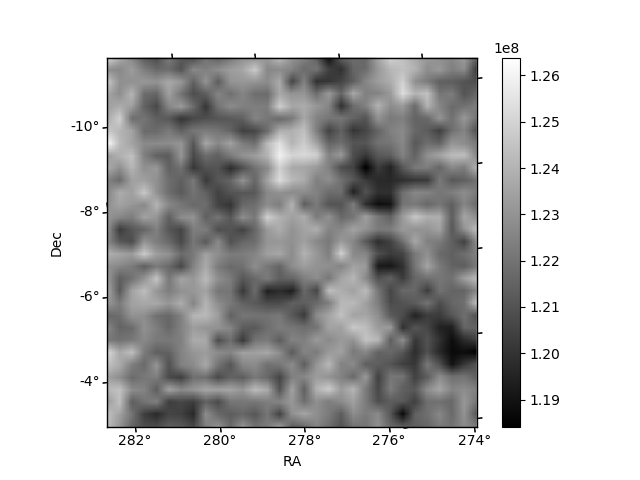
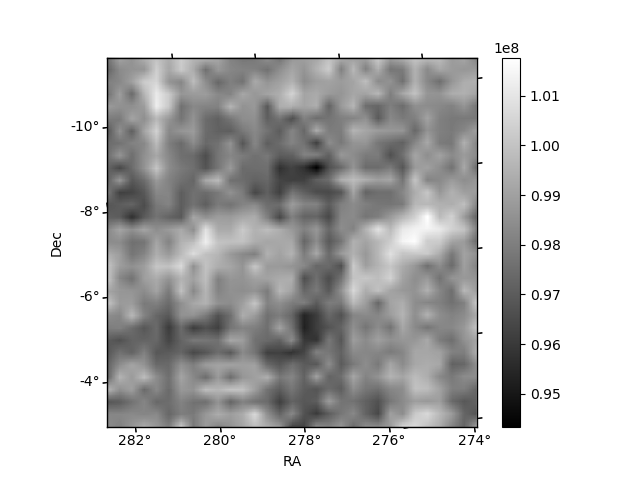
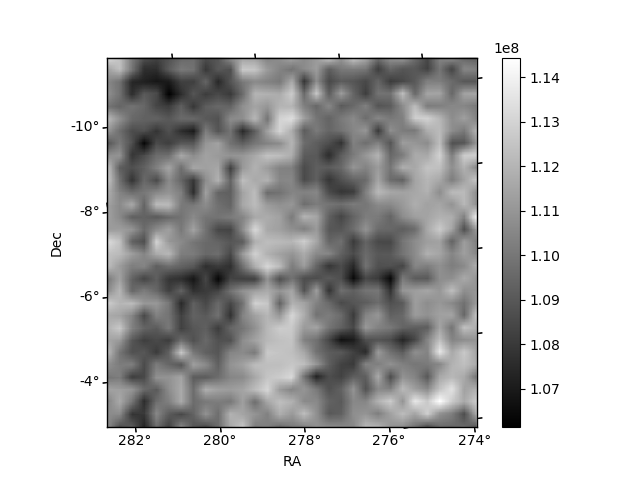
Histogram calculated using DETX and DETY for each event in the final _common_clean file
| Quadrant A | 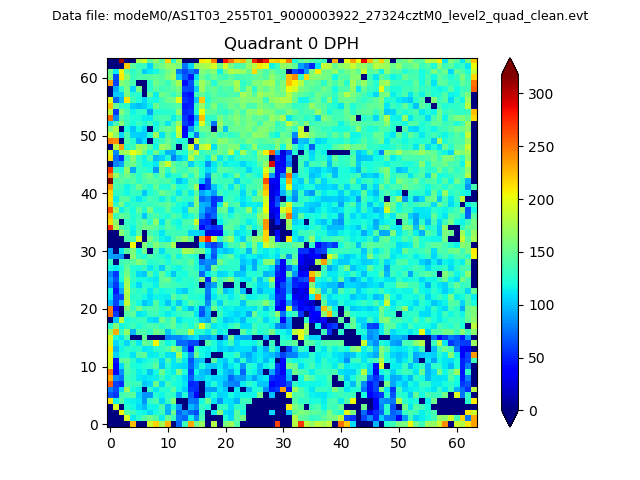 |
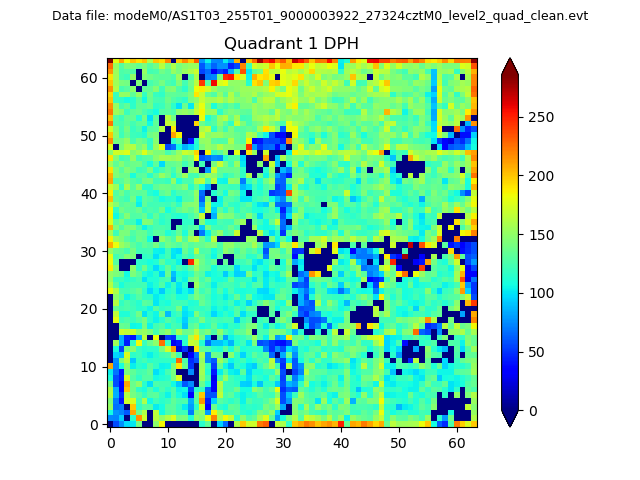 |
Quadrant B |
|---|---|---|---|
| Quadrant D | 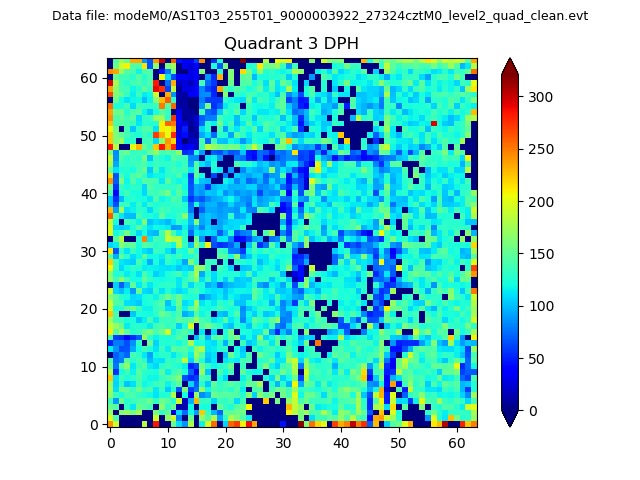 |
 |
Quadrant C |
| Plot type | Count rate plots | Images |
|---|---|---|
| Comparison with Poisson distribution Blue bars denote a histogram of data divided into 1 sec bins. Red curve is a Poisson curve with rate = median count rate of data. |
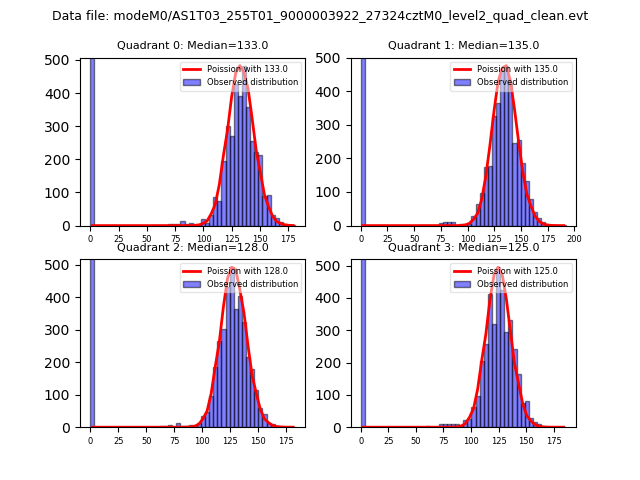 |
 |
| Quadrant-wise count rates Data is divided into 100 sec bins |
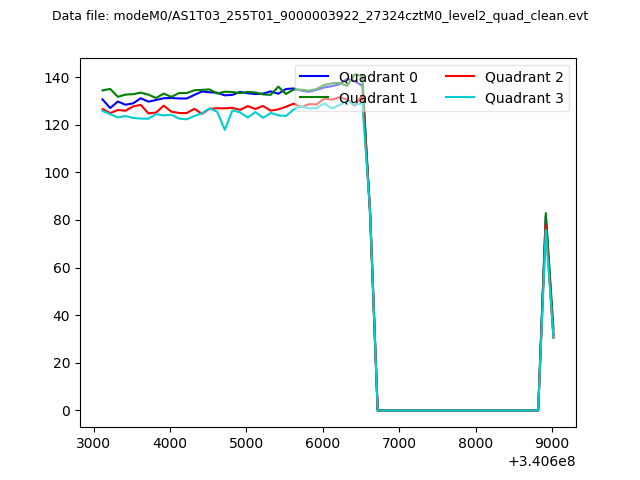 |
|
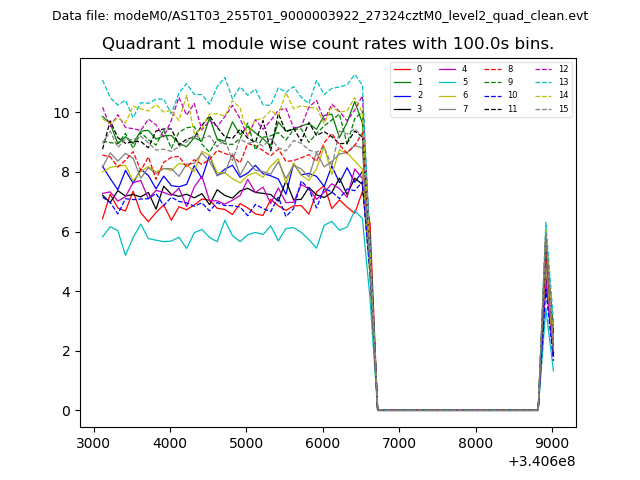
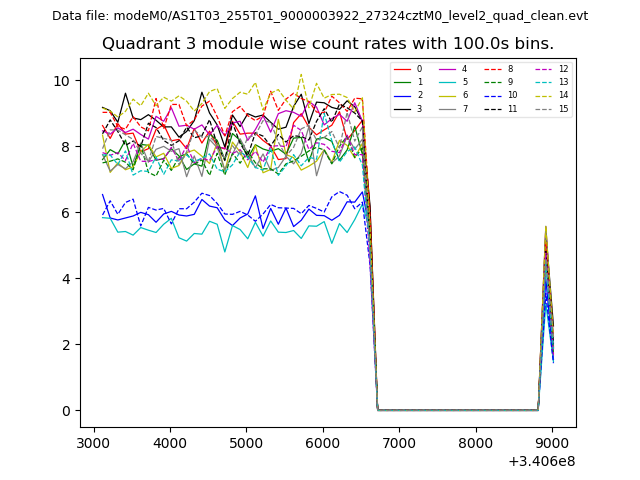
| Module-wise count rates for Quadrant A Data is divided into 100 sec bins |
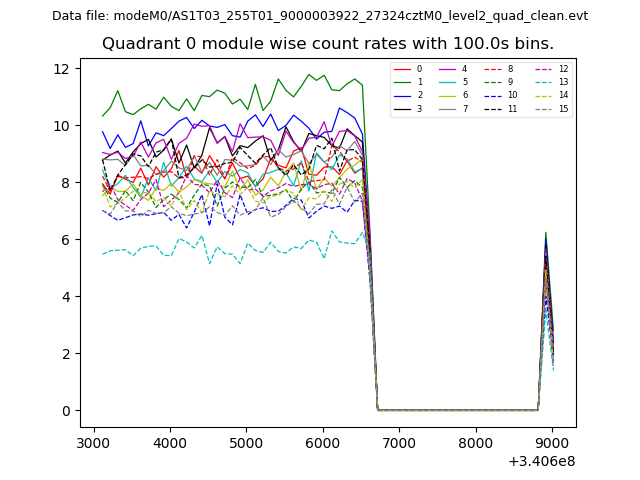 |
 |
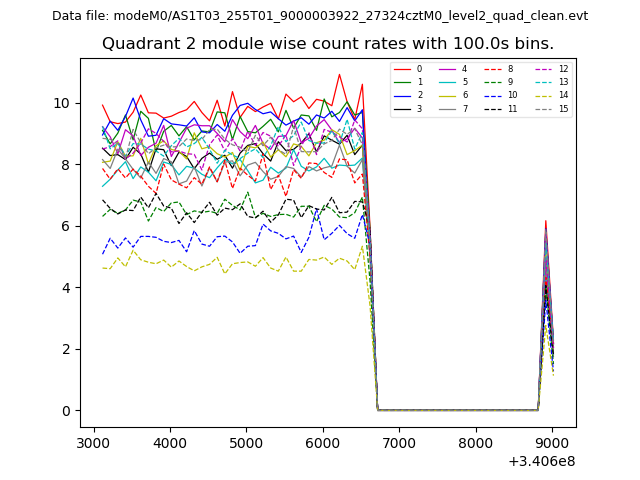
| Module-wise count rates for Quadrant B Data is divided into 100 sec bins |
 |
 |
| Module-wise count rates for Quadrant C Data is divided into 100 sec bins |
 |
 |
| Module-wise count rates for Quadrant D Data is divided into 100 sec bins |
 |
 |
| Parameter | Plot |
|---|---|
| CZT HV Monitor | 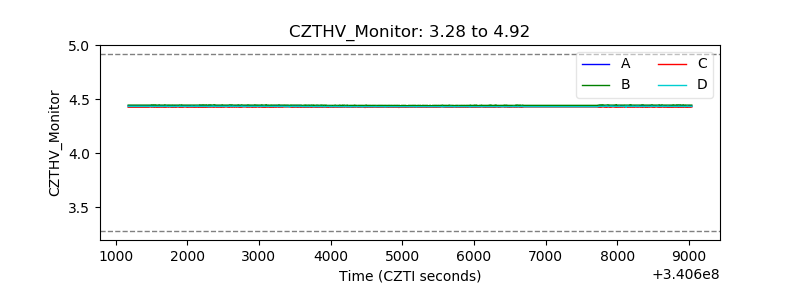 |
| D_VDD | 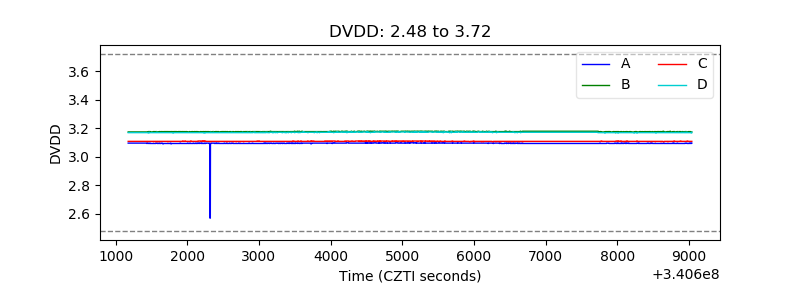 |
| Temperature 1 | 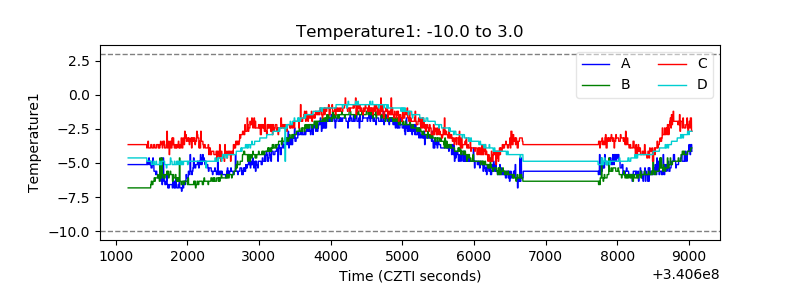 |
| Veto HV Monitor | 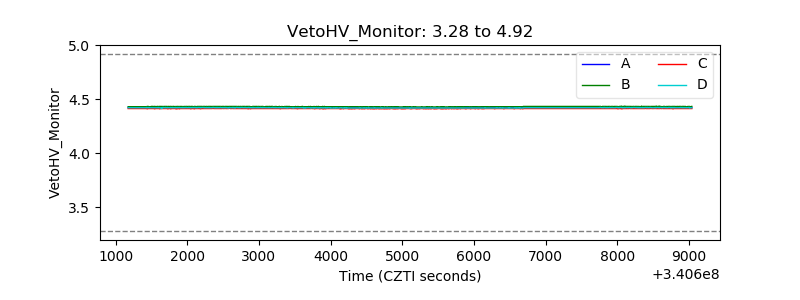 |
| Veto LLD | 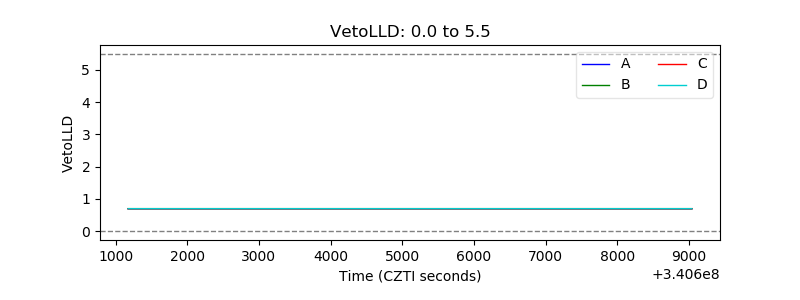 |
| Alpha Counter | 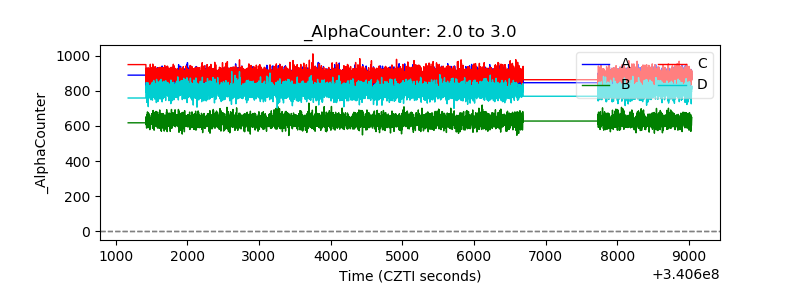 |
| _CPM_Rate | 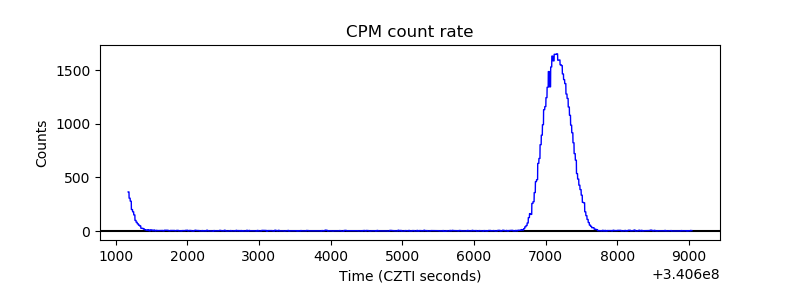 |
| CZT Counter | 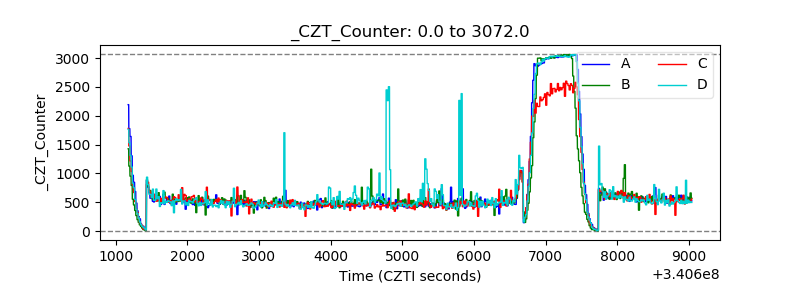 |
| +2.5 Volts monitor | 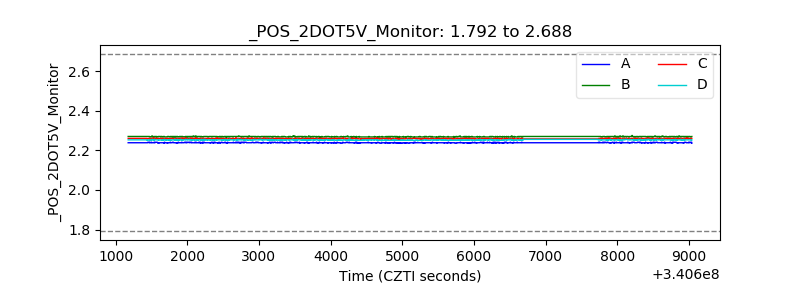 |
| +5 Volts monitor | 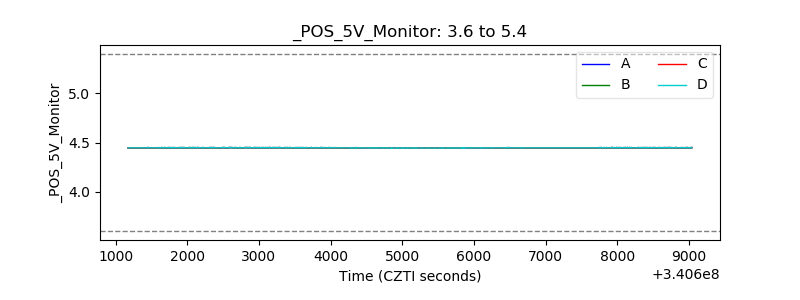 |
| _ROLL_ROT | 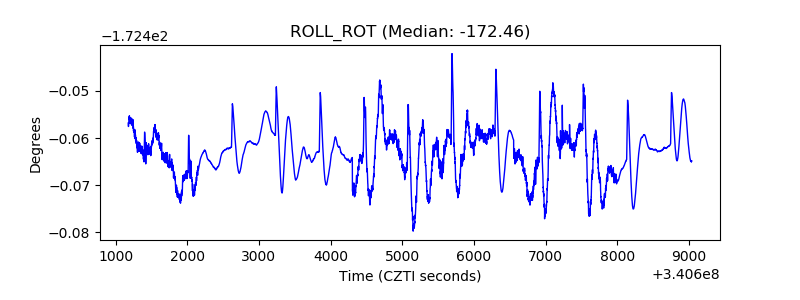 |
| _Roll_DEC | 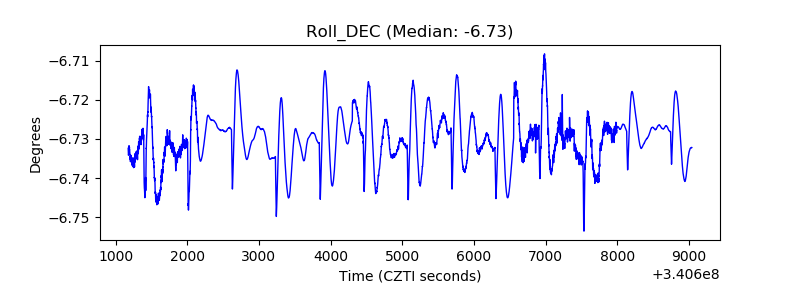 |
| _Roll_RA | 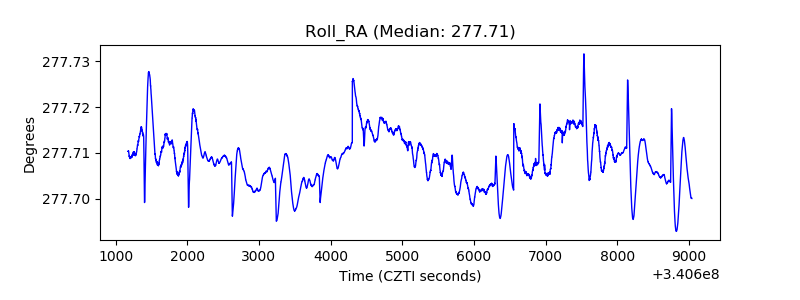 |
| Veto Counter | 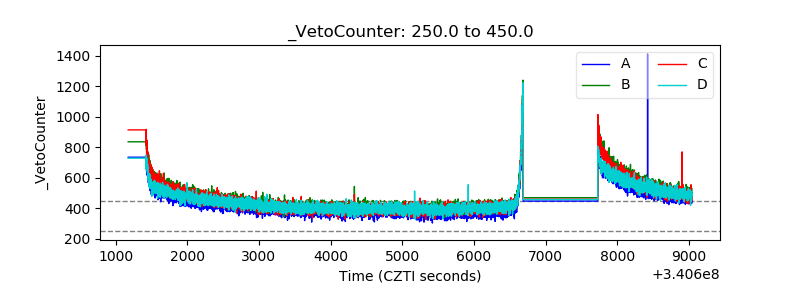 |