| Param | Original file | Final file |
|---|---|---|
| Filename | modeM0/AS1T03_255T01_9000003922_27326cztM0_level2.evt | modeM0/AS1T03_255T01_9000003922_27326cztM0_level2_quad_clean.evt |
| Size (bytes) | 500,641,920 | 89,029,440 |
| Size | 477.4 MB | 84.9 MB |
| Events in quadrant A | 3,435,680 | 580,677 |
| Events in quadrant B | 3,570,251 | 585,514 |
| Events in quadrant C | 3,409,785 | 549,169 |
| Events in quadrant D | 4,313,307 | 535,555 |
| Mode M9 | |||
|---|---|---|---|
| Quadrant | BADHDUFLAG | Total packets | Discarded packets |
| A | 0 | 14 | 0 |
| B | 0 | 15 | 0 |
| C | 0 | 15 | 0 |
| D | 0 | 15 | 0 |
| Mode M0 | |||
|---|---|---|---|
| Quadrant | BADHDUFLAG | Total packets | Discarded packets |
| A | 0 | 14263 | 0 |
| B | 0 | 14623 | 0 |
| C | 0 | 14185 | 0 |
| D | 0 | 17002 | 0 |
| Quadrant | Total seconds | Saturated seconds | Saturation percentage |
|---|---|---|---|
| A | 6385 | 63 | 0.986688% |
| B | 6385 | 80 | 1.252937% |
| C | 6385 | 121 | 1.895067% |
| D | 6385 | 224 | 3.508222% |
Noise dominated data is calculated using 1-second bins in cleaned event files. If a bin has >2000 counts, and if more than 50% of those come from <1% of pixels, then it is considered to be noise-dominated and hence unusable.
| Quadrant | # 1 sec bins | Bins with >0 counts | Bins with >2000 counts | High rate bins dominated by noise | Noise dominated (total time) | Noise dominated (detector-on time) | Marked lightcurve |
|---|---|---|---|---|---|---|---|
| A | 7545 | 6385 | 0 | 0 | 0.00% | 0.00% | 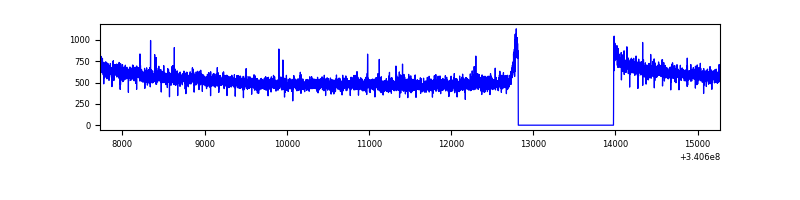 |
| B | 7545 | 6385 | 1 | 1 | 0.01% | 0.02% | 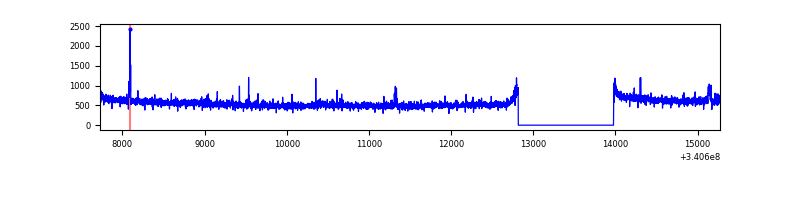 |
| C | 7545 | 6385 | 1 | 1 | 0.01% | 0.02% | 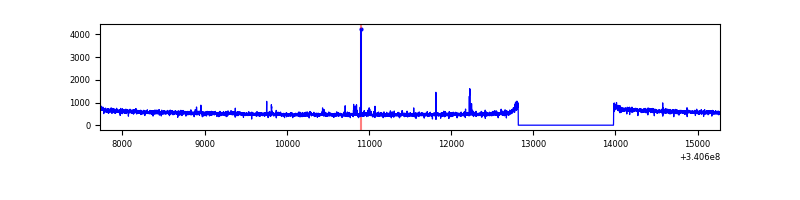 |
| D | 7545 | 6385 | 155 | 155 | 2.05% | 2.43% | 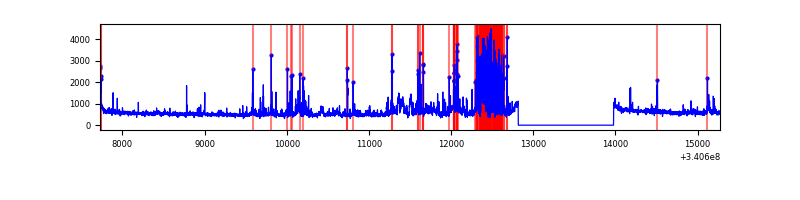 |
Top three noisy pixels from each quadrant. If the there are fewer than three noisy pixels in the level2.evt file, extra rows are filled as -1
| Pixel properties | Quadrant properties | ||||||
|---|---|---|---|---|---|---|---|
| Quadrant | DetID | PixID | Counts | Sigma | Mean | Median | Sigma |
| A | 12 | 189 | 12144 | 63.77 | 887 | 870 | 176.8 |
| A | 13 | 254 | 10890 | 56.68 | 887 | 870 | 176.8 |
| A | 3 | 137 | 7601 | 38.07 | 887 | 870 | 176.8 |
| B | 0 | 219 | 71608 | 434.44 | 872 | 854 | 162.9 |
| B | 7 | 205 | 61765 | 374.01 | 872 | 854 | 162.9 |
| B | 12 | 111 | 19605 | 115.14 | 872 | 854 | 162.9 |
| C | 14 | 238 | 134588 | 691.48 | 829 | 836 | 193.4 |
| C | 2 | 16 | 18364 | 90.62 | 829 | 836 | 193.4 |
| C | 15 | 208 | 16859 | 82.84 | 829 | 836 | 193.4 |
| D | 1 | 52 | 493176 | 2469.61 | 836 | 820 | 199.4 |
| D | 12 | 227 | 379667 | 1900.26 | 836 | 820 | 199.4 |
| D | 2 | 250 | 187857 | 938.16 | 836 | 820 | 199.4 |
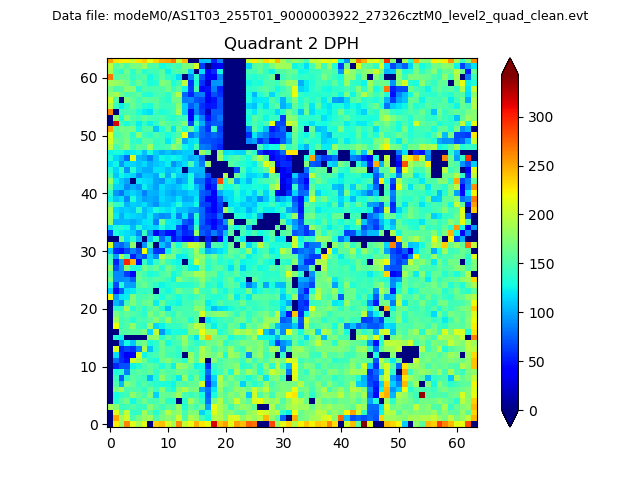
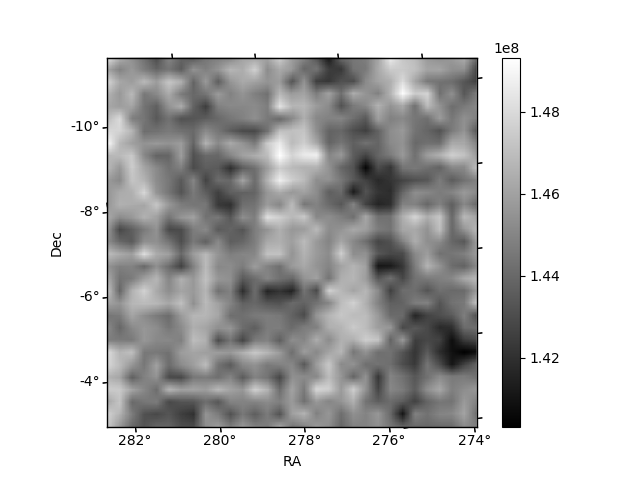
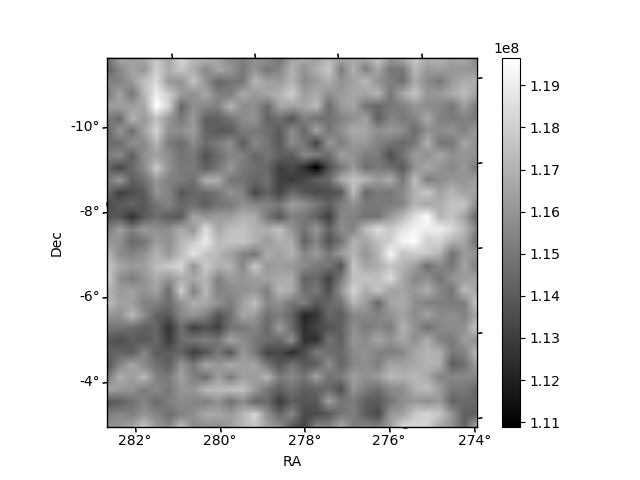
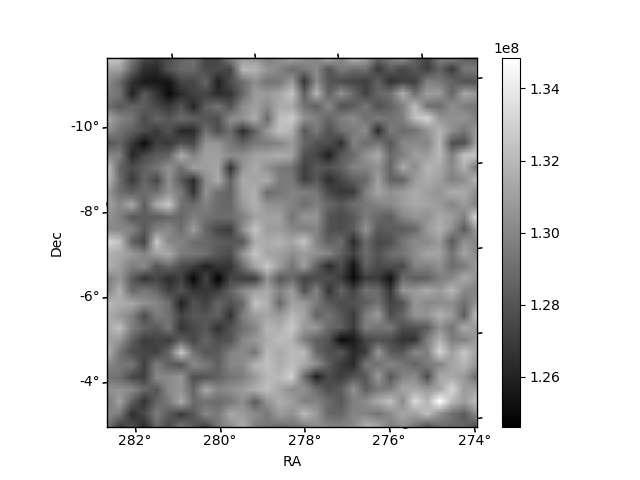
Histogram calculated using DETX and DETY for each event in the final _common_clean file
| Quadrant A |  |
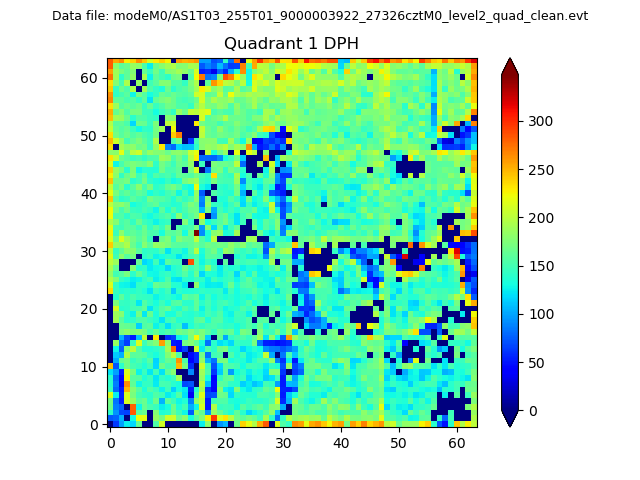 |
Quadrant B |
|---|---|---|---|
| Quadrant D | 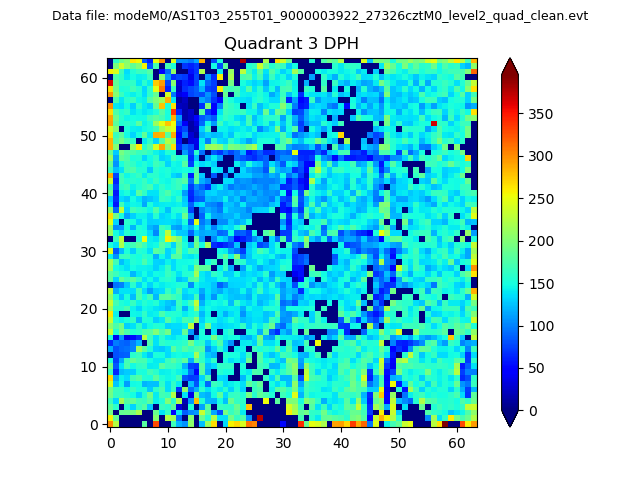 |
 |
Quadrant C |
| Plot type | Count rate plots | Images |
|---|---|---|
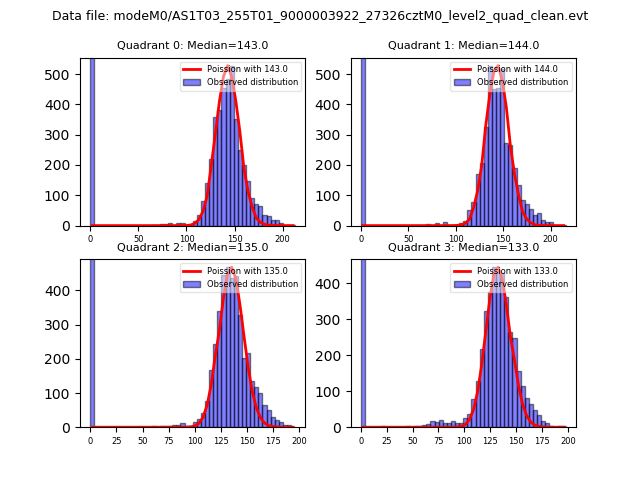
| Comparison with Poisson distribution Blue bars denote a histogram of data divided into 1 sec bins. Red curve is a Poisson curve with rate = median count rate of data. |
 |
 |
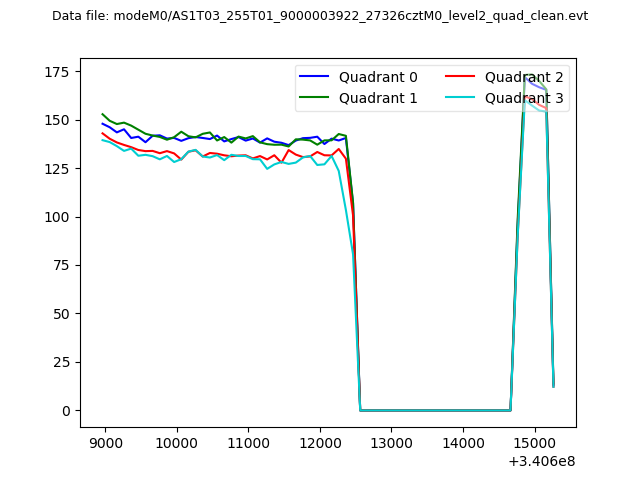
| Quadrant-wise count rates Data is divided into 100 sec bins |
 |
|
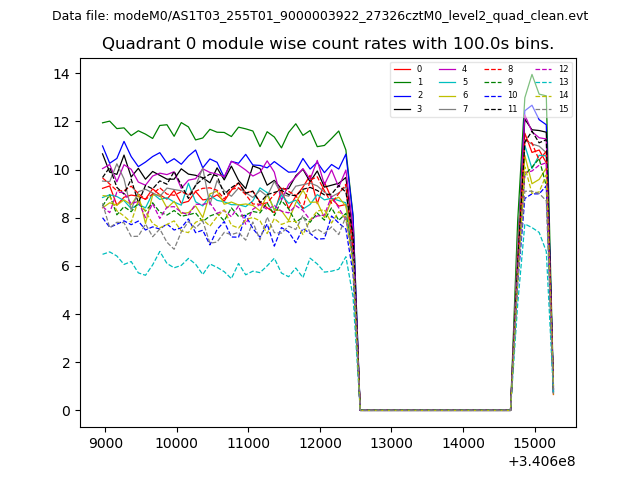
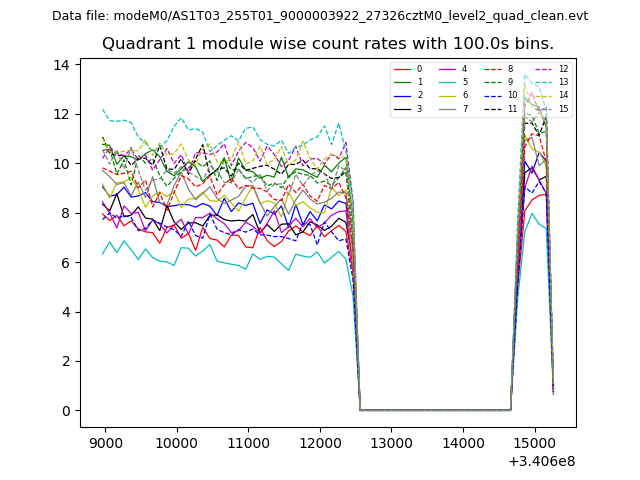
| Module-wise count rates for Quadrant A Data is divided into 100 sec bins |
 |
 |
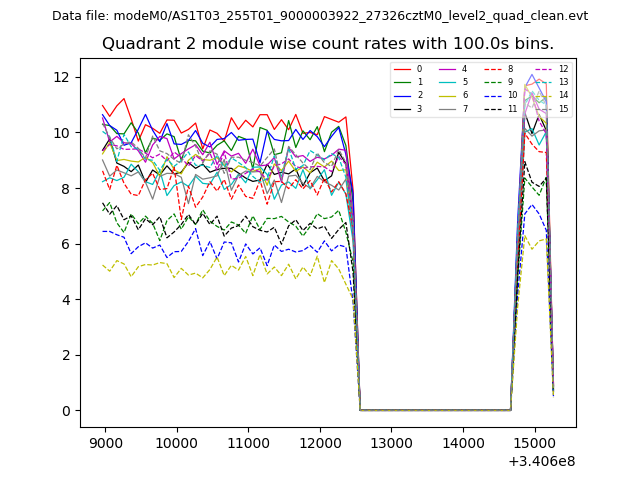
| Module-wise count rates for Quadrant B Data is divided into 100 sec bins |
 |
 |
| Module-wise count rates for Quadrant C Data is divided into 100 sec bins |
 |
 |
| Module-wise count rates for Quadrant D Data is divided into 100 sec bins |
 |
 |
| Parameter | Plot |
|---|---|
| CZT HV Monitor |  |
| D_VDD | 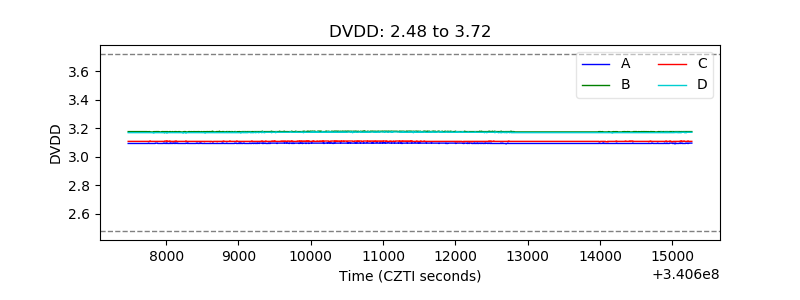 |
| Temperature 1 |  |
| Veto HV Monitor | 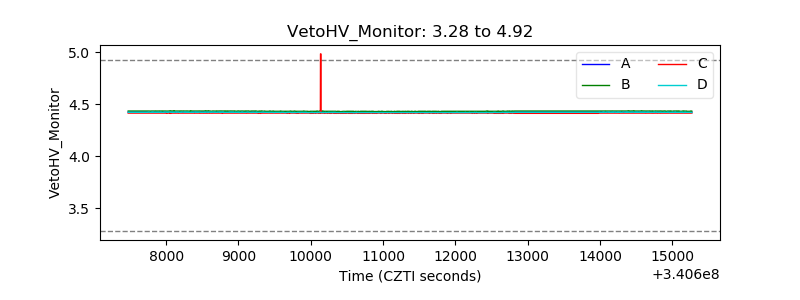 |
| Veto LLD |  |
| Alpha Counter | 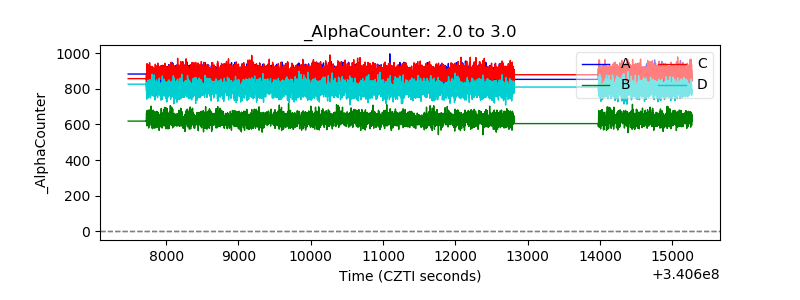 |
| _CPM_Rate | 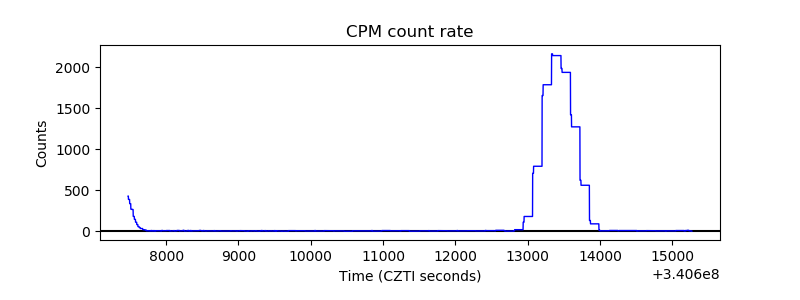 |
| CZT Counter | 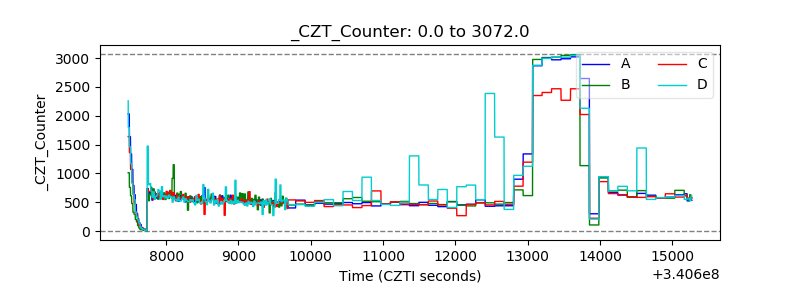 |
| +2.5 Volts monitor |  |
| +5 Volts monitor | 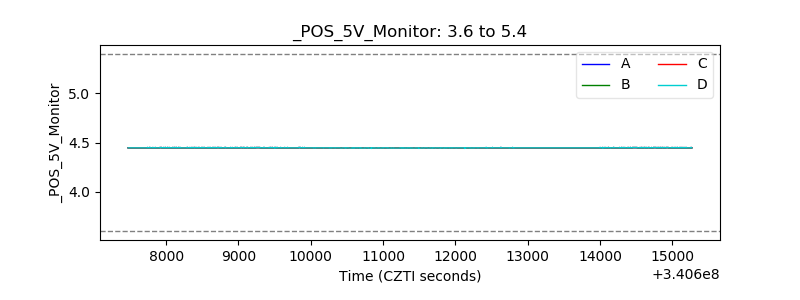 |
| _ROLL_ROT |  |
| _Roll_DEC | 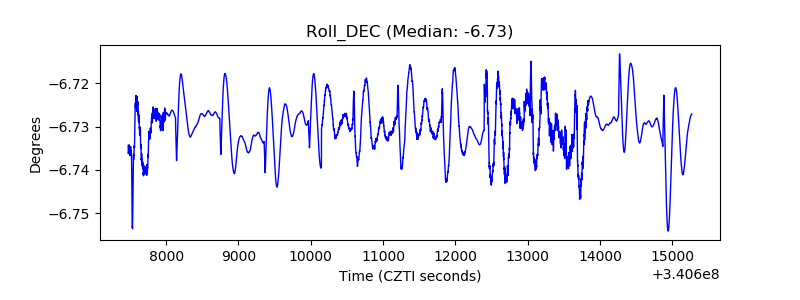 |
| _Roll_RA | 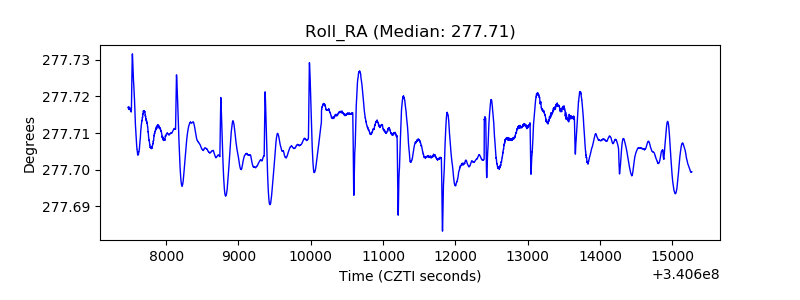 |
| Veto Counter | 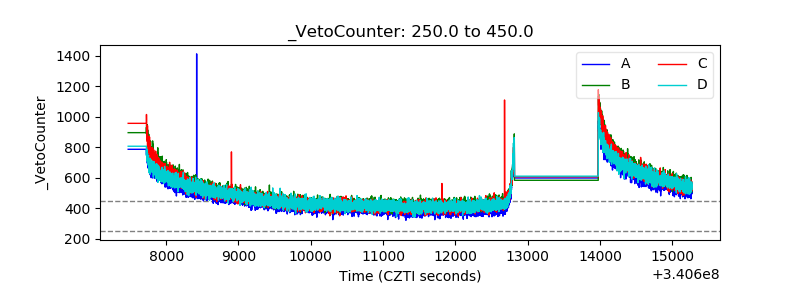 |