| Param | Original file | Final file |
|---|---|---|
| Filename | modeM0/AS1T03_255T01_9000003922_27327cztM0_level2.evt | modeM0/AS1T03_255T01_9000003922_27327cztM0_level2_quad_clean.evt |
| Size (bytes) | 517,271,040 | 105,307,200 |
| Size | 493.3 MB | 100.4 MB |
| Events in quadrant A | 3,615,823 | 711,448 |
| Events in quadrant B | 3,793,724 | 711,979 |
| Events in quadrant C | 3,494,905 | 663,694 |
| Events in quadrant D | 4,331,588 | 659,924 |
| Mode M9 | |||
|---|---|---|---|
| Quadrant | BADHDUFLAG | Total packets | Discarded packets |
| A | 0 | 15 | 0 |
| B | 0 | 16 | 0 |
| C | 0 | 16 | 0 |
| D | 0 | 16 | 0 |
| Mode M0 | |||
|---|---|---|---|
| Quadrant | BADHDUFLAG | Total packets | Discarded packets |
| A | 0 | 14962 | 0 |
| B | 0 | 15390 | 0 |
| C | 0 | 14543 | 0 |
| D | 0 | 17385 | 0 |
| Quadrant | Total seconds | Saturated seconds | Saturation percentage |
|---|---|---|---|
| A | 6341 | 95 | 1.498186% |
| B | 6341 | 135 | 2.129002% |
| C | 6341 | 141 | 2.223624% |
| D | 6340 | 90 | 1.419558% |
Noise dominated data is calculated using 1-second bins in cleaned event files. If a bin has >2000 counts, and if more than 50% of those come from <1% of pixels, then it is considered to be noise-dominated and hence unusable.
| Quadrant | # 1 sec bins | Bins with >0 counts | Bins with >2000 counts | High rate bins dominated by noise | Noise dominated (total time) | Noise dominated (detector-on time) | Marked lightcurve |
|---|---|---|---|---|---|---|---|
| A | 7591 | 6341 | 0 | 0 | 0.00% | 0.00% | 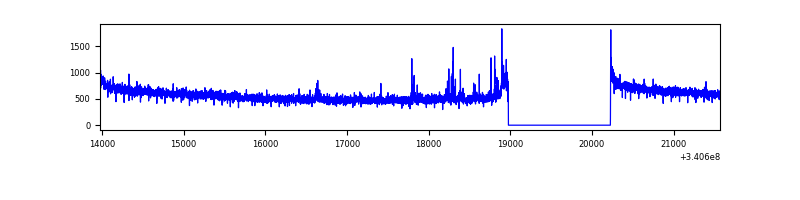 |
| B | 7591 | 6341 | 13 | 13 | 0.17% | 0.21% | 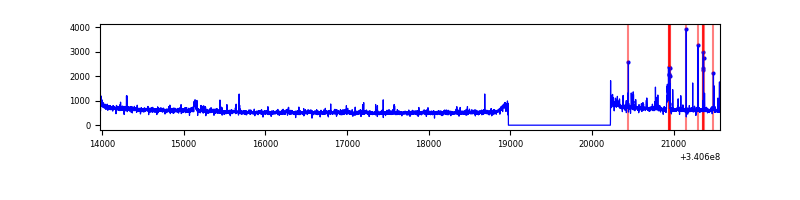 |
| C | 7591 | 6341 | 0 | 0 | 0.00% | 0.00% | 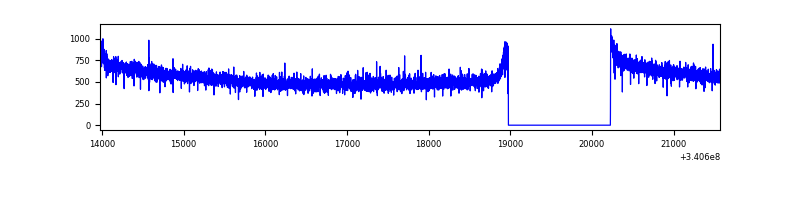 |
| D | 7590 | 6340 | 29 | 29 | 0.38% | 0.46% | 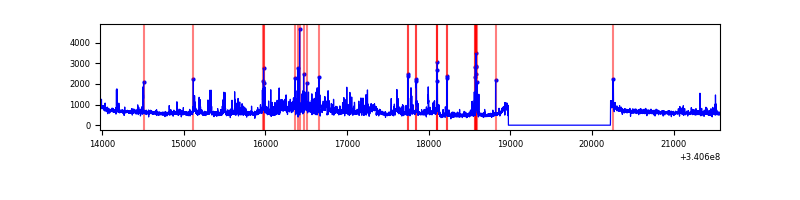 |
Top three noisy pixels from each quadrant. If the there are fewer than three noisy pixels in the level2.evt file, extra rows are filled as -1
| Pixel properties | Quadrant properties | ||||||
|---|---|---|---|---|---|---|---|
| Quadrant | DetID | PixID | Counts | Sigma | Mean | Median | Sigma |
| A | 14 | 235 | 37408 | 199.83 | 925 | 910 | 182.6 |
| A | 13 | 254 | 10641 | 53.28 | 925 | 910 | 182.6 |
| A | 0 | 226 | 8103 | 39.38 | 925 | 910 | 182.6 |
| B | 3 | 64 | 111176 | 655.01 | 906 | 888 | 168.4 |
| B | 7 | 205 | 85800 | 504.3 | 906 | 888 | 168.4 |
| B | 0 | 219 | 41770 | 242.8 | 906 | 888 | 168.4 |
| C | 14 | 238 | 138908 | 697.65 | 858 | 867 | 197.9 |
| C | 4 | 224 | 7401 | 33.02 | 858 | 867 | 197.9 |
| C | 13 | 61 | 5995 | 25.92 | 858 | 867 | 197.9 |
| D | 1 | 52 | 623149 | 2965.9 | 877 | 859 | 209.8 |
| D | 2 | 250 | 185812 | 881.5 | 877 | 859 | 209.8 |
| D | 12 | 227 | 138266 | 654.89 | 877 | 859 | 209.8 |
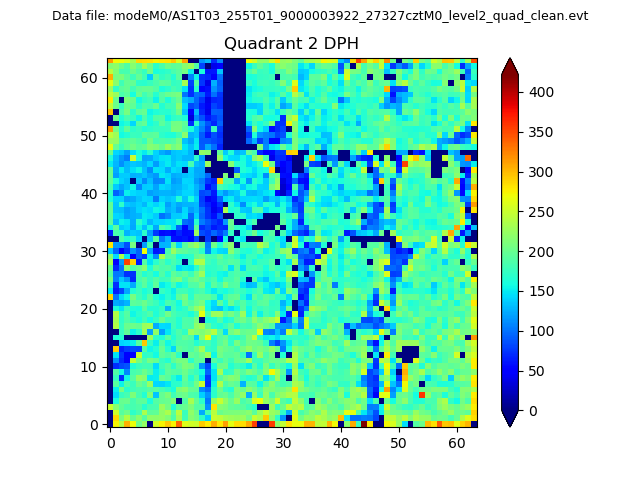
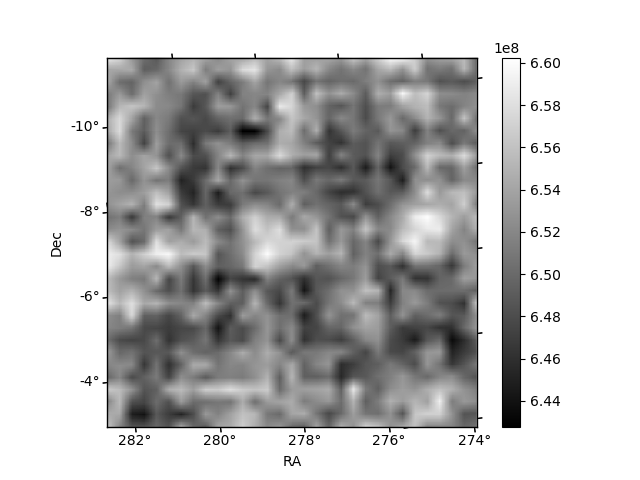
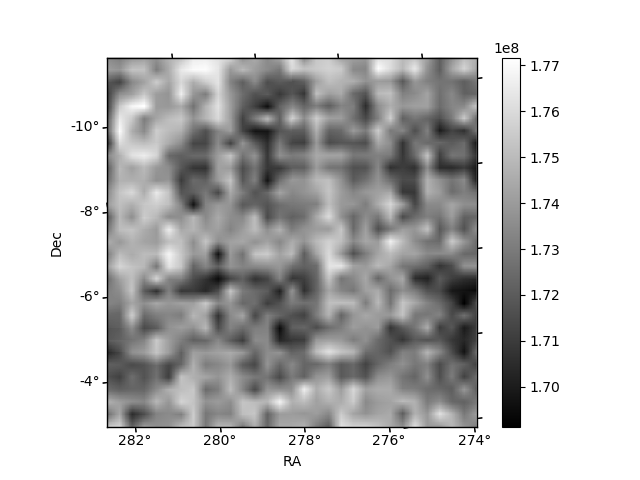
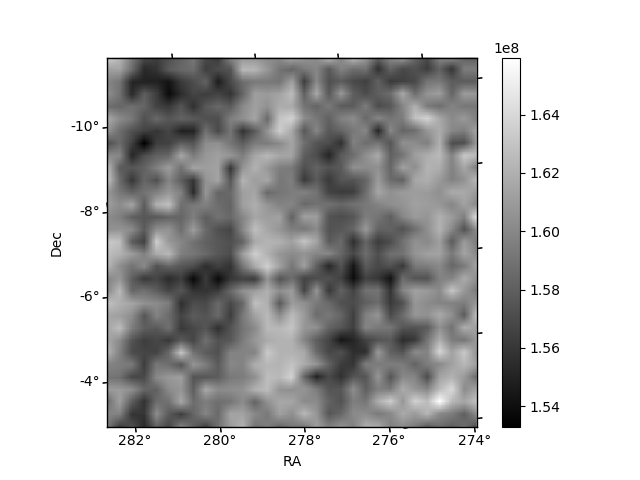
Histogram calculated using DETX and DETY for each event in the final _common_clean file
| Quadrant A | 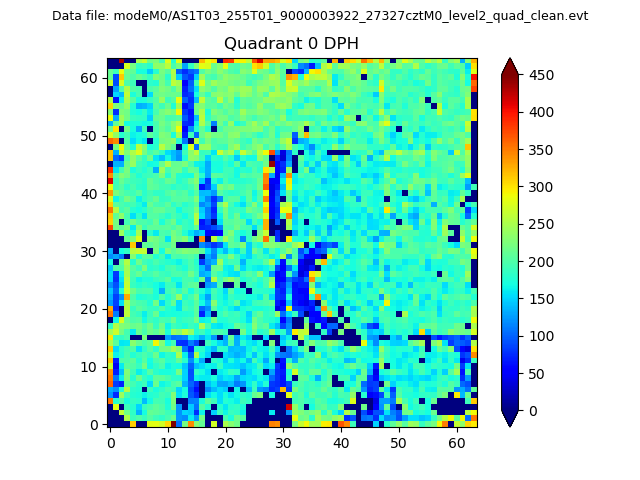 |
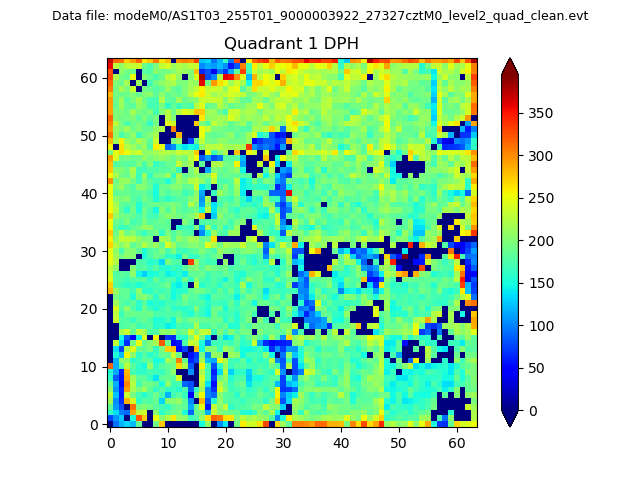 |
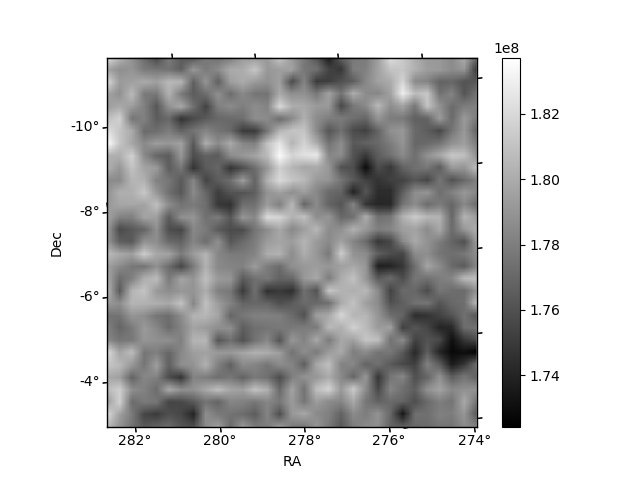
Quadrant B |
|---|---|---|---|
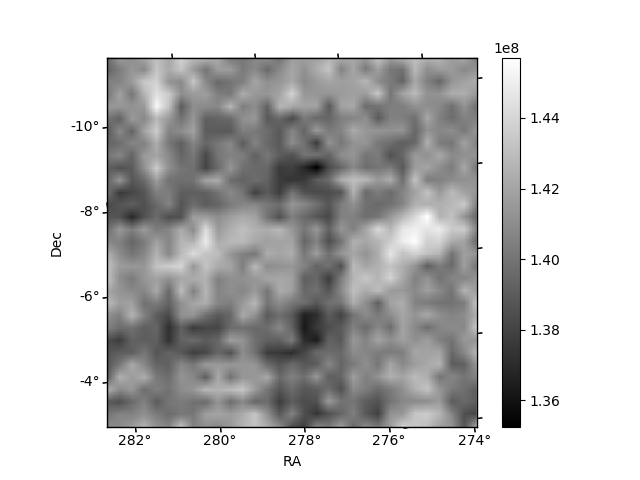
| Quadrant D | 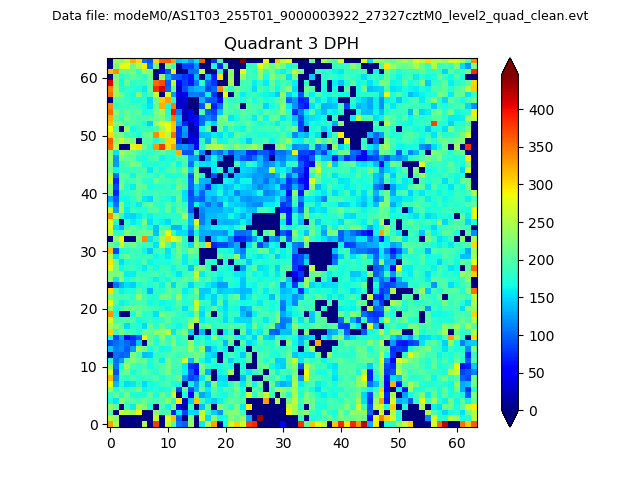 |
 |
Quadrant C |
| Plot type | Count rate plots | Images |
|---|---|---|
| Comparison with Poisson distribution Blue bars denote a histogram of data divided into 1 sec bins. Red curve is a Poisson curve with rate = median count rate of data. |
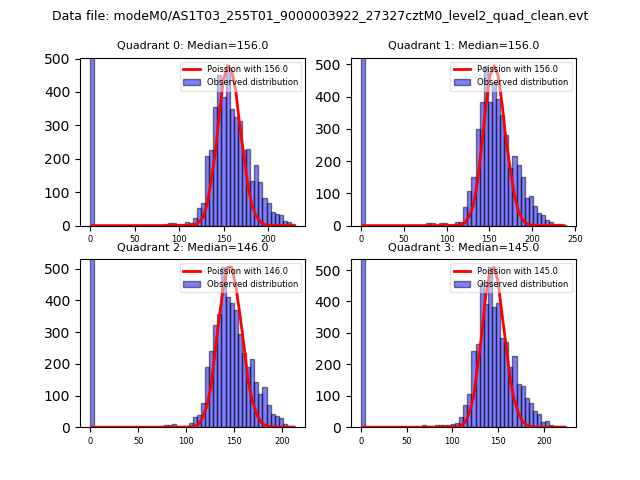 |
 |
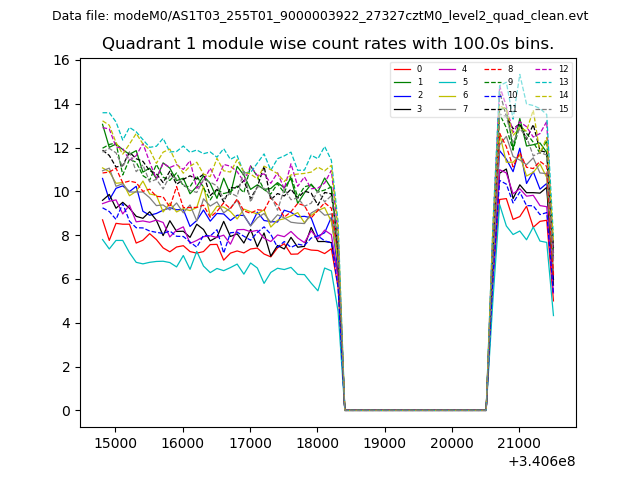
| Quadrant-wise count rates Data is divided into 100 sec bins |
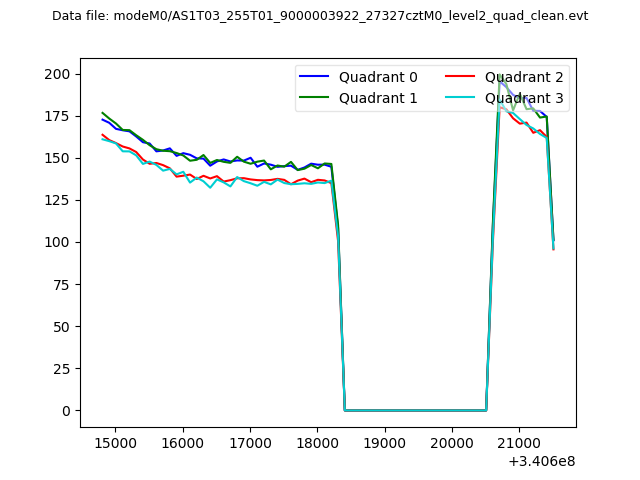 |
|
| Module-wise count rates for Quadrant A Data is divided into 100 sec bins |
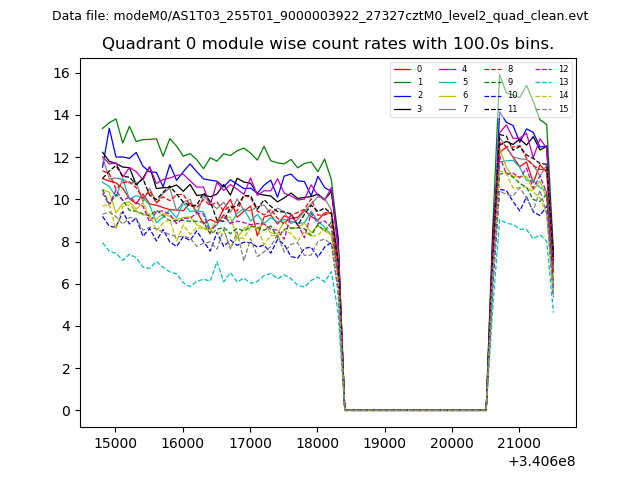 |
 |
| Module-wise count rates for Quadrant B Data is divided into 100 sec bins |
 |
 |
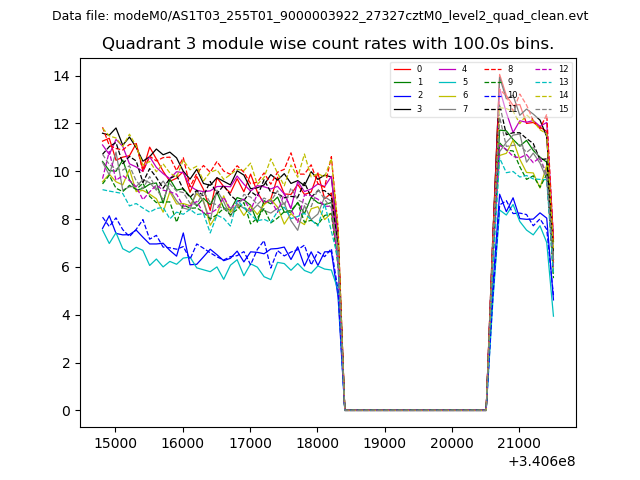
| Module-wise count rates for Quadrant C Data is divided into 100 sec bins |
 |
 |
| Module-wise count rates for Quadrant D Data is divided into 100 sec bins |
 |
 |
| Parameter | Plot |
|---|---|
| CZT HV Monitor | 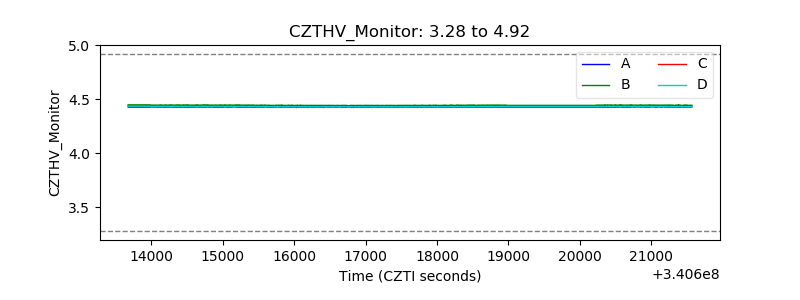 |
| D_VDD |  |
| Temperature 1 | 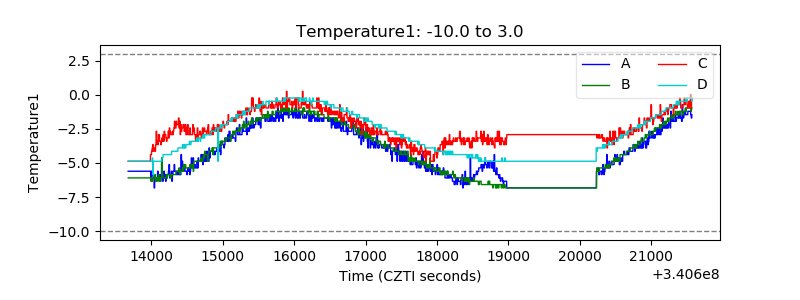 |
| Veto HV Monitor | 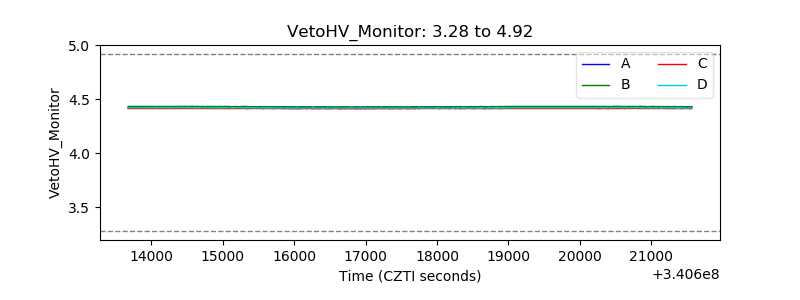 |
| Veto LLD |  |
| Alpha Counter | 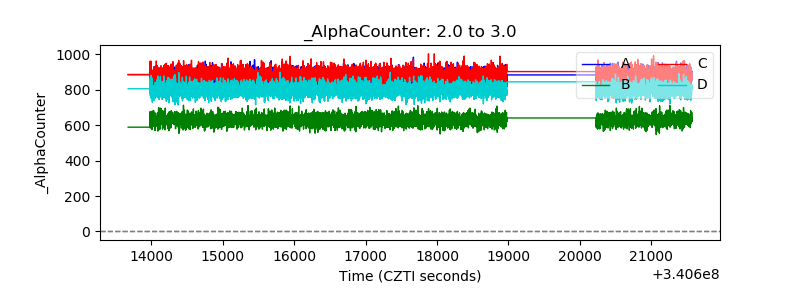 |
| _CPM_Rate | 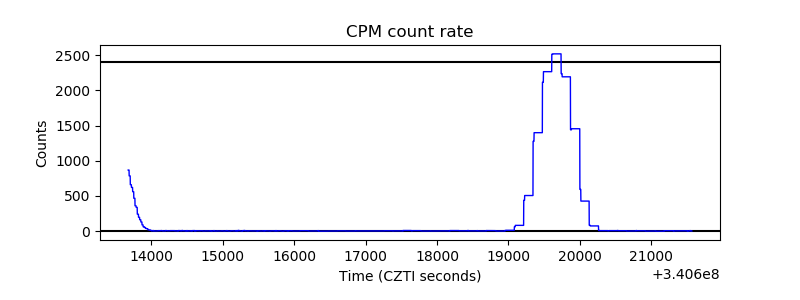 |
| CZT Counter | 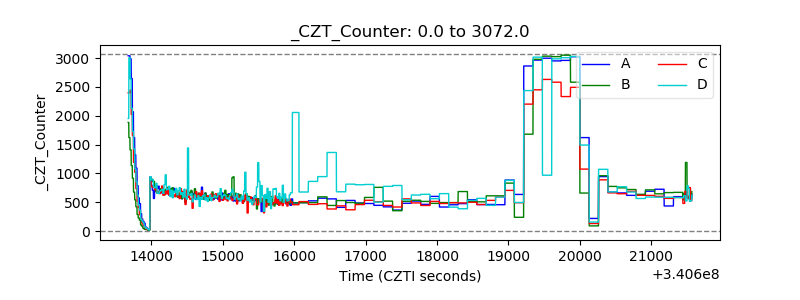 |
| +2.5 Volts monitor |  |
| +5 Volts monitor |  |
| _ROLL_ROT | 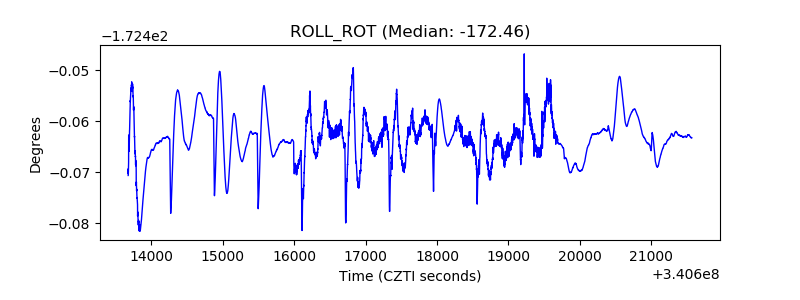 |
| _Roll_DEC | 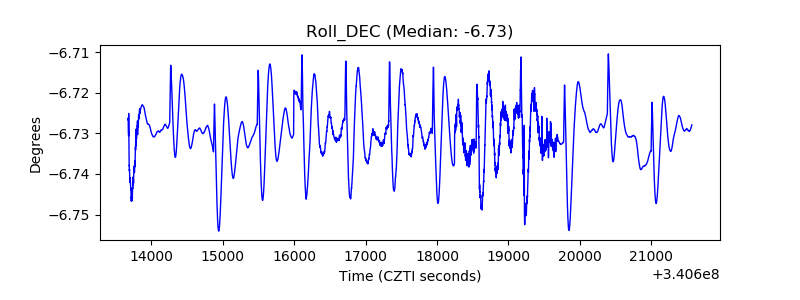 |
| _Roll_RA | 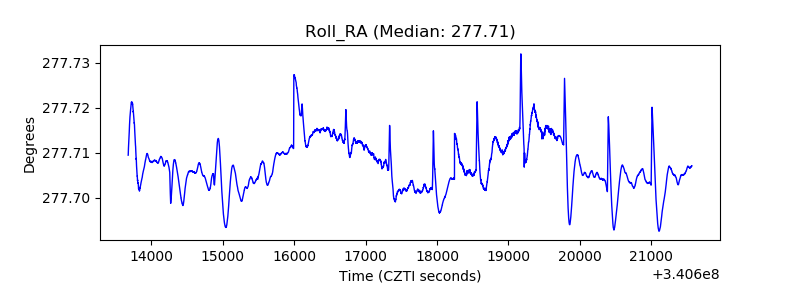 |
| Veto Counter |  |