| Param | Original file | Final file |
|---|---|---|
| Filename | modeM0/AS1T03_255T01_9000003922_27328cztM0_level2.evt | modeM0/AS1T03_255T01_9000003922_27328cztM0_level2_quad_clean.evt |
| Size (bytes) | 525,611,520 | 118,019,520 |
| Size | 501.3 MB | 112.6 MB |
| Events in quadrant A | 3,602,357 | 821,716 |
| Events in quadrant B | 4,513,347 | 797,002 |
| Events in quadrant C | 3,448,185 | 761,029 |
| Events in quadrant D | 3,934,697 | 762,642 |
| Mode M9 | |||
|---|---|---|---|
| Quadrant | BADHDUFLAG | Total packets | Discarded packets |
| A | 0 | 15 | 0 |
| B | 0 | 16 | 0 |
| C | 0 | 16 | 0 |
| D | 0 | 16 | 0 |
| Mode M0 | |||
|---|---|---|---|
| Quadrant | BADHDUFLAG | Total packets | Discarded packets |
| A | 0 | 14879 | 0 |
| B | 0 | 17658 | 0 |
| C | 0 | 14280 | 0 |
| D | 0 | 15936 | 0 |
| Quadrant | Total seconds | Saturated seconds | Saturation percentage |
|---|---|---|---|
| A | 6197 | 98 | 1.581410% |
| B | 6196 | 375 | 6.052292% |
| C | 6196 | 140 | 2.259522% |
| D | 6196 | 110 | 1.775339% |
Noise dominated data is calculated using 1-second bins in cleaned event files. If a bin has >2000 counts, and if more than 50% of those come from <1% of pixels, then it is considered to be noise-dominated and hence unusable.
| Quadrant | # 1 sec bins | Bins with >0 counts | Bins with >2000 counts | High rate bins dominated by noise | Noise dominated (total time) | Noise dominated (detector-on time) | Marked lightcurve |
|---|---|---|---|---|---|---|---|
| A | 7532 | 6197 | 2 | 2 | 0.03% | 0.03% | 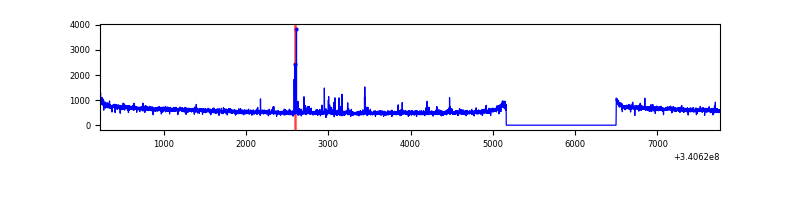 |
| B | 7531 | 6196 | 197 | 197 | 2.62% | 3.18% | 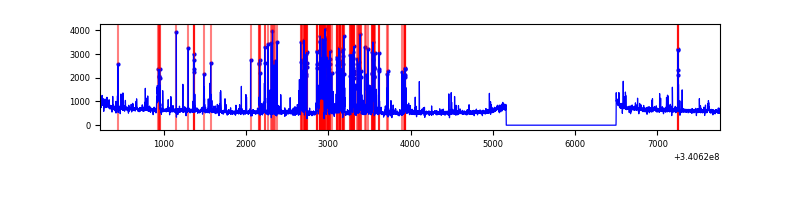 |
| C | 7531 | 6196 | 1 | 1 | 0.01% | 0.02% |  |
| D | 7531 | 6196 | 35 | 35 | 0.46% | 0.56% | 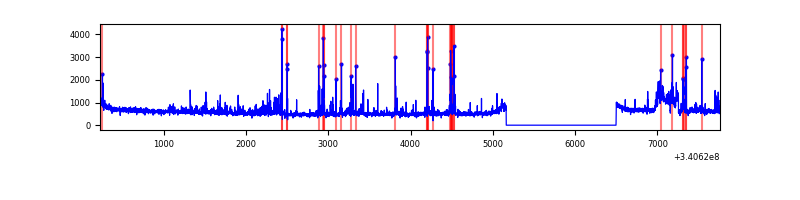 |
Top three noisy pixels from each quadrant. If the there are fewer than three noisy pixels in the level2.evt file, extra rows are filled as -1
| Pixel properties | Quadrant properties | ||||||
|---|---|---|---|---|---|---|---|
| Quadrant | DetID | PixID | Counts | Sigma | Mean | Median | Sigma |
| A | 14 | 235 | 34324 | 184.02 | 917 | 903 | 181.6 |
| A | 13 | 248 | 20476 | 107.77 | 917 | 903 | 181.6 |
| A | 13 | 254 | 10523 | 52.97 | 917 | 903 | 181.6 |
| B | 3 | 64 | 886027 | 5428.91 | 879 | 862 | 163.0 |
| B | 7 | 205 | 80549 | 488.74 | 879 | 862 | 163.0 |
| B | 0 | 182 | 32390 | 193.37 | 879 | 862 | 163.0 |
| C | 14 | 238 | 140503 | 718.34 | 844 | 851 | 194.4 |
| C | 0 | 207 | 10286 | 48.53 | 844 | 851 | 194.4 |
| C | 2 | 16 | 7442 | 33.9 | 844 | 851 | 194.4 |
| D | 12 | 227 | 233788 | 1130.85 | 869 | 852 | 206.0 |
| D | 2 | 250 | 185545 | 896.64 | 869 | 852 | 206.0 |
| D | 1 | 52 | 111481 | 537.08 | 869 | 852 | 206.0 |
Histogram calculated using DETX and DETY for each event in the final _common_clean file
| Quadrant A | 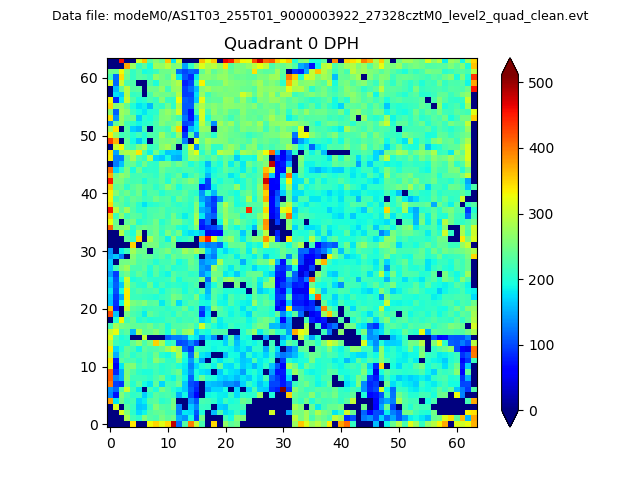 |
 |
Quadrant B |
|---|---|---|---|
| Quadrant D |  |
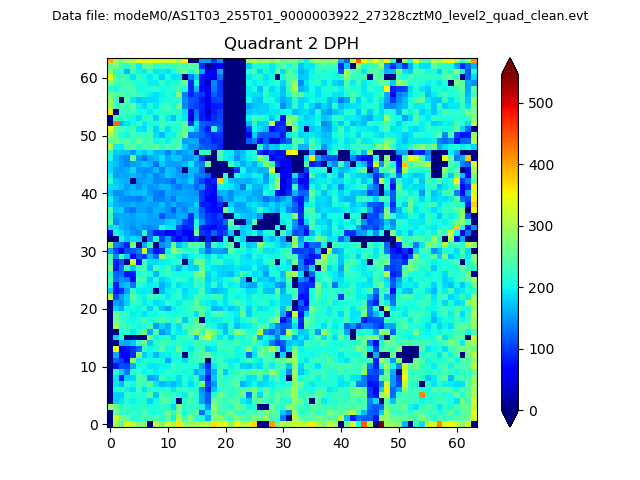 |
Quadrant C |
| Plot type | Count rate plots | Images |
|---|---|---|
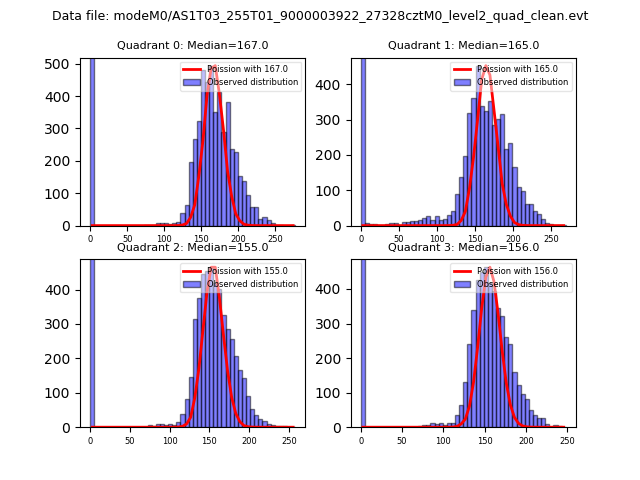
| Comparison with Poisson distribution Blue bars denote a histogram of data divided into 1 sec bins. Red curve is a Poisson curve with rate = median count rate of data. |
 |
 |
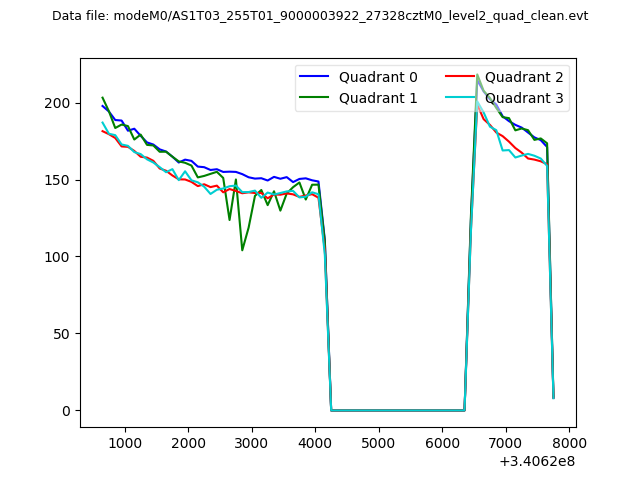
| Quadrant-wise count rates Data is divided into 100 sec bins |
 |
|
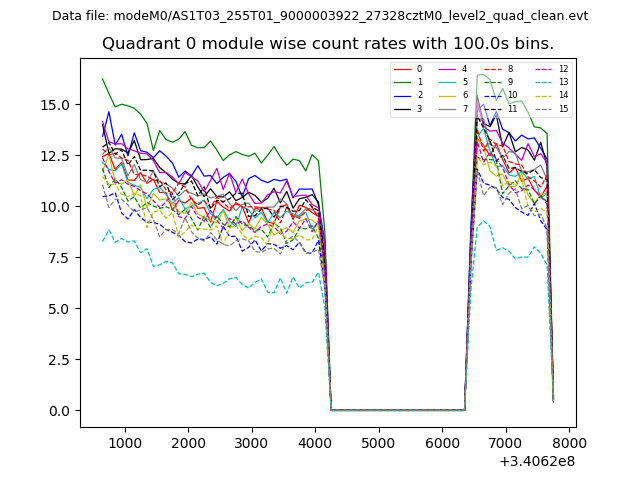
| Module-wise count rates for Quadrant A Data is divided into 100 sec bins |
 |
 |
| Module-wise count rates for Quadrant B Data is divided into 100 sec bins |
 |
 |
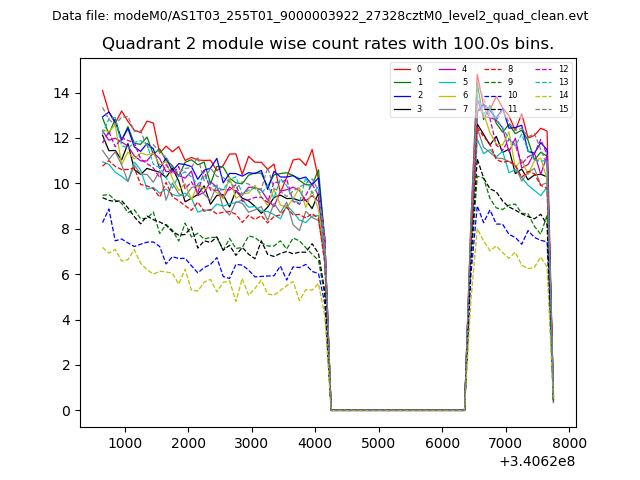
| Module-wise count rates for Quadrant C Data is divided into 100 sec bins |
 |
 |
| Module-wise count rates for Quadrant D Data is divided into 100 sec bins |
 |
 |
| Parameter | Plot |
|---|---|
| CZT HV Monitor | 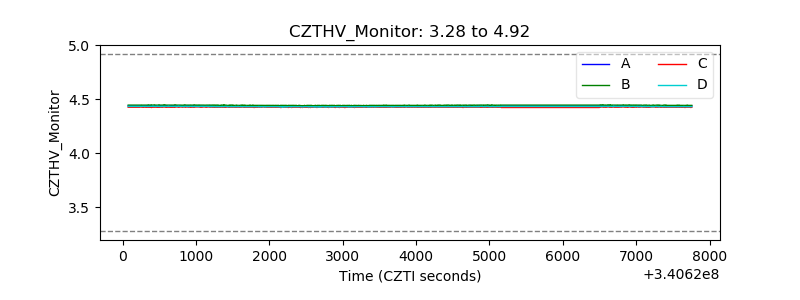 |
| D_VDD | 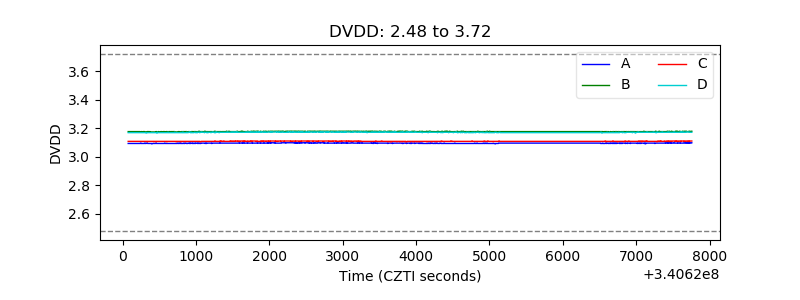 |
| Temperature 1 | 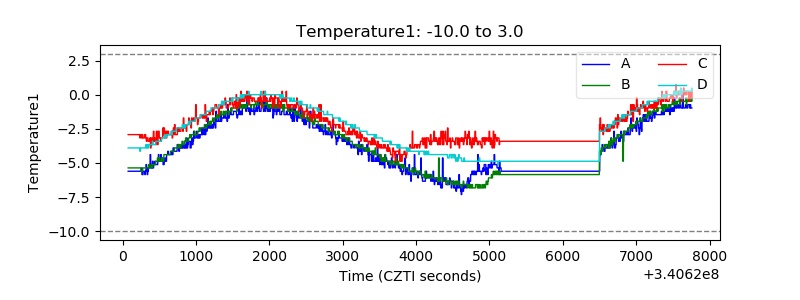 |
| Veto HV Monitor | 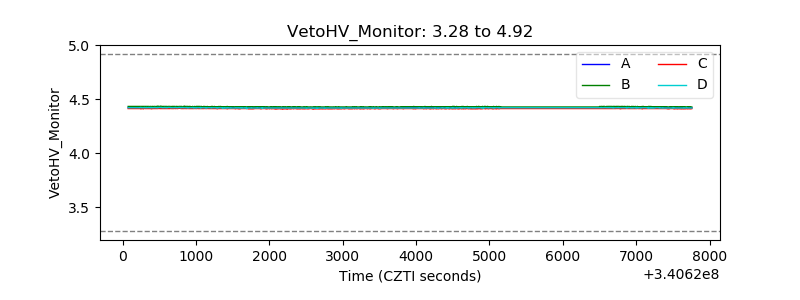 |
| Veto LLD | 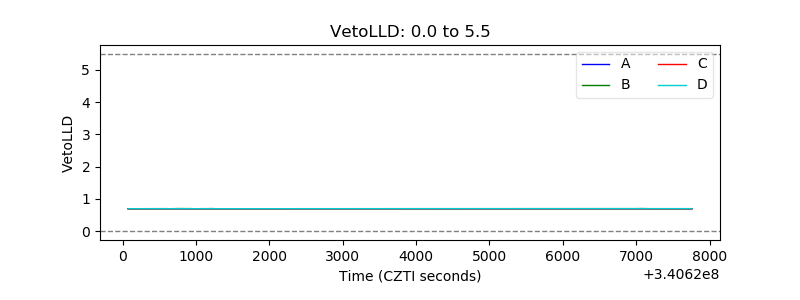 |
| Alpha Counter | 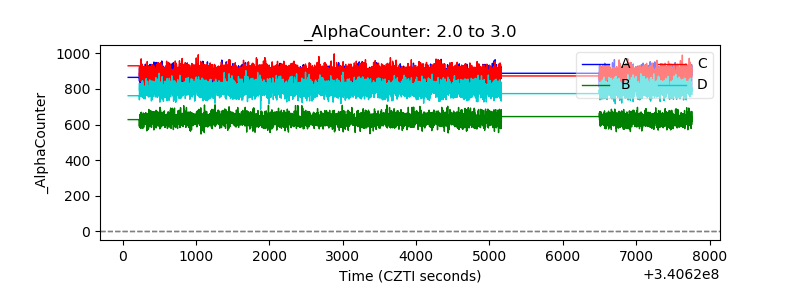 |
| _CPM_Rate | 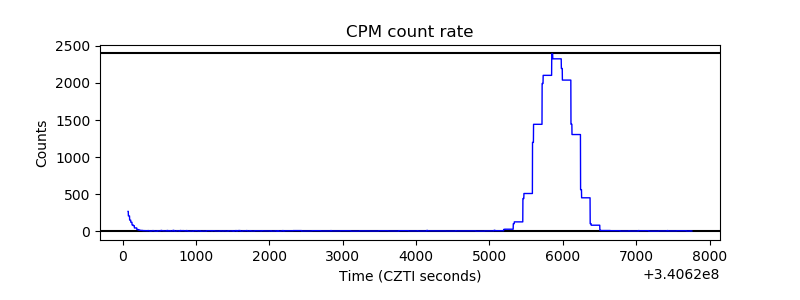 |
| CZT Counter | 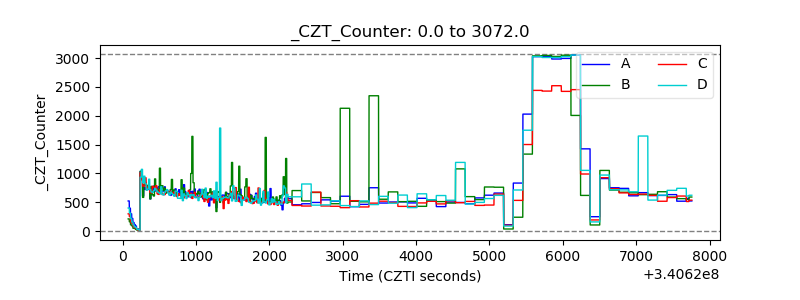 |
| +2.5 Volts monitor |  |
| +5 Volts monitor |  |
| _ROLL_ROT | 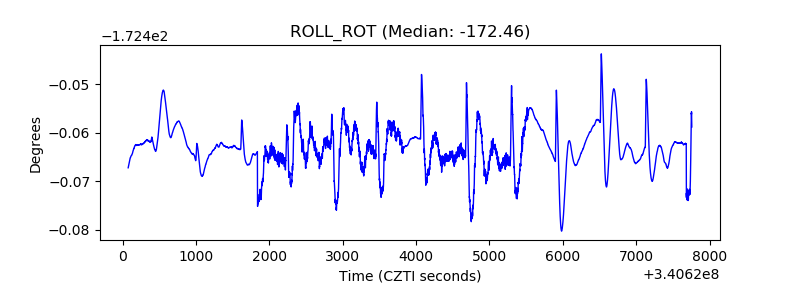 |
| _Roll_DEC | 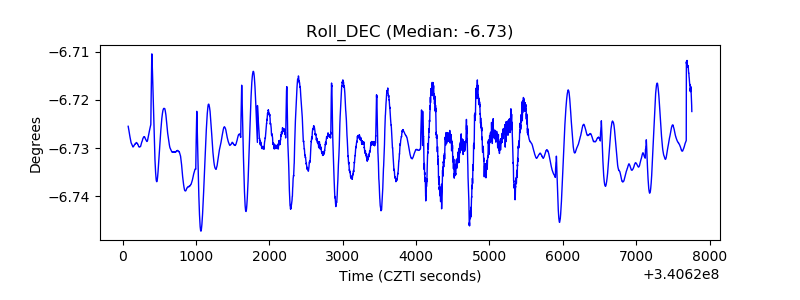 |
| _Roll_RA | 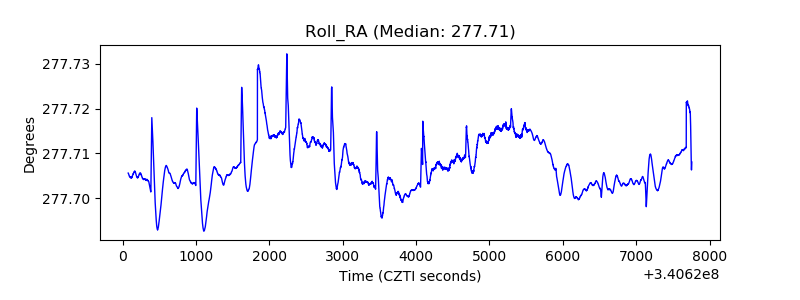 |
| Veto Counter | 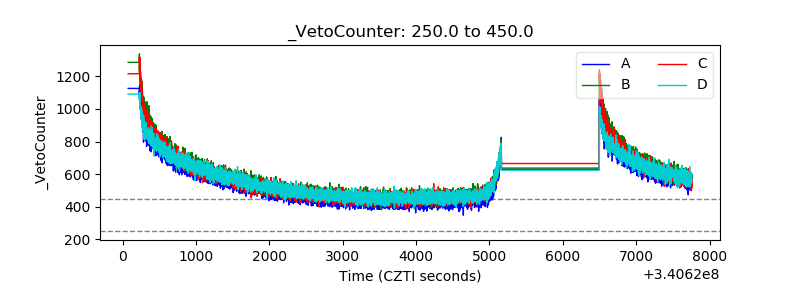 |