| Param | Original file | Final file |
|---|---|---|
| Filename | modeM0/AS1T03_255T01_9000003922_27329cztM0_level2.evt | modeM0/AS1T03_255T01_9000003922_27329cztM0_level2_quad_clean.evt |
| Size (bytes) | 535,985,280 | 121,158,720 |
| Size | 511.2 MB | 115.5 MB |
| Events in quadrant A | 3,562,327 | 844,244 |
| Events in quadrant B | 4,443,378 | 828,341 |
| Events in quadrant C | 3,441,578 | 776,374 |
| Events in quadrant D | 4,351,913 | 774,737 |
| Mode M9 | |||
|---|---|---|---|
| Quadrant | BADHDUFLAG | Total packets | Discarded packets |
| A | 0 | 13 | 0 |
| B | 0 | 13 | 0 |
| C | 0 | 13 | 0 |
| D | 0 | 13 | 0 |
| Mode M0 | |||
|---|---|---|---|
| Quadrant | BADHDUFLAG | Total packets | Discarded packets |
| A | 0 | 14744 | 0 |
| B | 0 | 17593 | 0 |
| C | 0 | 14170 | 0 |
| D | 0 | 17406 | 0 |
| Quadrant | Total seconds | Saturated seconds | Saturation percentage |
|---|---|---|---|
| A | 6390 | 118 | 1.846635% |
| B | 6391 | 293 | 4.584572% |
| C | 6390 | 152 | 2.378717% |
| D | 6390 | 127 | 1.987480% |
Noise dominated data is calculated using 1-second bins in cleaned event files. If a bin has >2000 counts, and if more than 50% of those come from <1% of pixels, then it is considered to be noise-dominated and hence unusable.
| Quadrant | # 1 sec bins | Bins with >0 counts | Bins with >2000 counts | High rate bins dominated by noise | Noise dominated (total time) | Noise dominated (detector-on time) | Marked lightcurve |
|---|---|---|---|---|---|---|---|
| A | 7695 | 6390 | 1 | 1 | 0.01% | 0.02% | 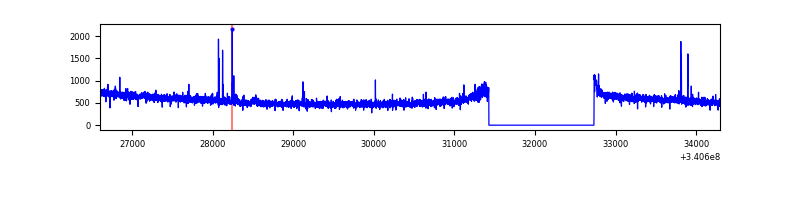 |
| B | 7696 | 6392 | 121 | 121 | 1.57% | 1.89% | 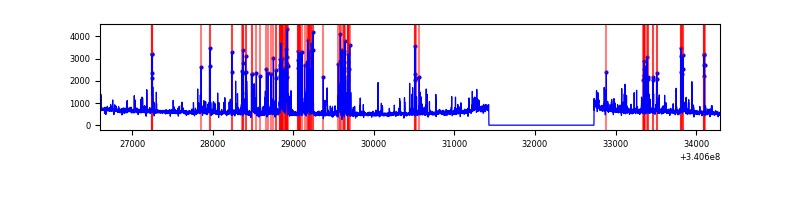 |
| C | 7695 | 6391 | 1 | 1 | 0.01% | 0.02% | 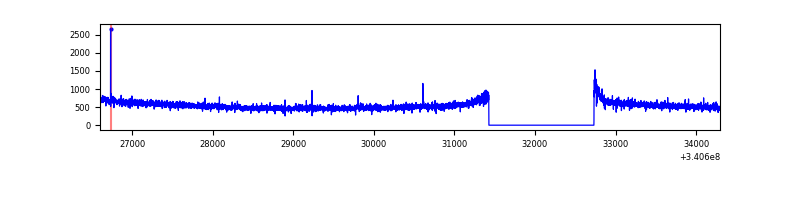 |
| D | 7695 | 6391 | 44 | 44 | 0.57% | 0.69% | 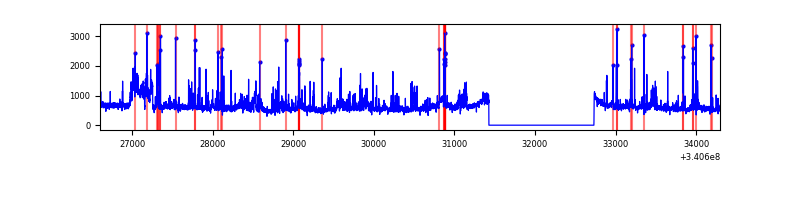 |
Top three noisy pixels from each quadrant. If the there are fewer than three noisy pixels in the level2.evt file, extra rows are filled as -1
| Pixel properties | Quadrant properties | ||||||
|---|---|---|---|---|---|---|---|
| Quadrant | DetID | PixID | Counts | Sigma | Mean | Median | Sigma |
| A | 13 | 248 | 27910 | 148.44 | 911 | 897 | 182.0 |
| A | 12 | 189 | 17405 | 90.71 | 911 | 897 | 182.0 |
| A | 13 | 254 | 10963 | 55.31 | 911 | 897 | 182.0 |
| B | 3 | 64 | 721485 | 4389.86 | 883 | 865 | 164.2 |
| B | 7 | 205 | 89365 | 539.12 | 883 | 865 | 164.2 |
| B | 0 | 182 | 58850 | 353.23 | 883 | 865 | 164.2 |
| C | 14 | 238 | 138235 | 710.95 | 840 | 848 | 193.2 |
| C | 15 | 208 | 12505 | 60.32 | 840 | 848 | 193.2 |
| C | 4 | 224 | 8441 | 39.29 | 840 | 848 | 193.2 |
| D | 1 | 52 | 428063 | 2024.12 | 862 | 841 | 211.1 |
| D | 12 | 227 | 318460 | 1504.83 | 862 | 841 | 211.1 |
| D | 2 | 250 | 202539 | 955.61 | 862 | 841 | 211.1 |
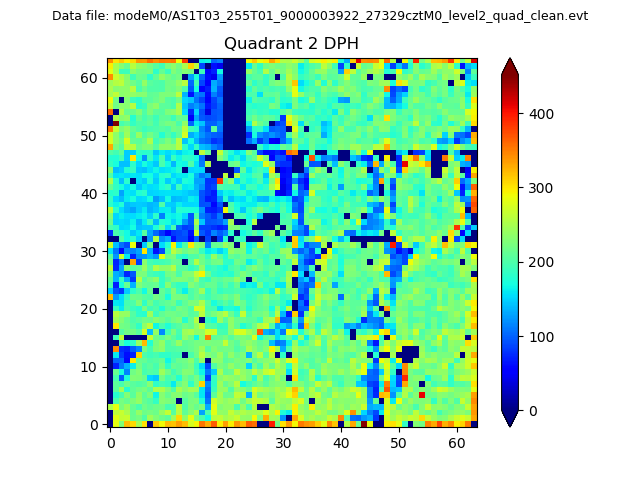
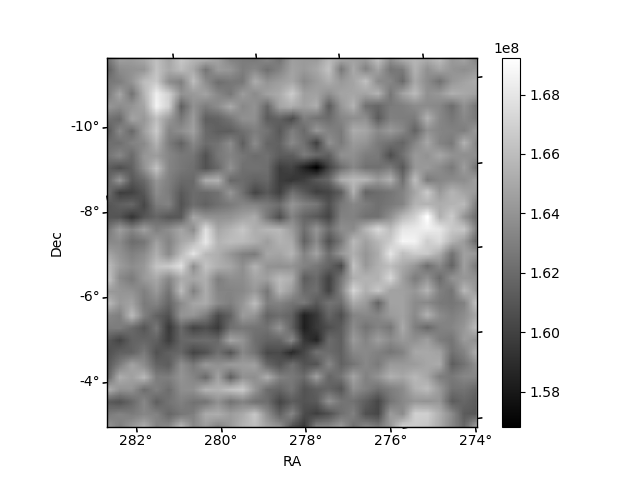
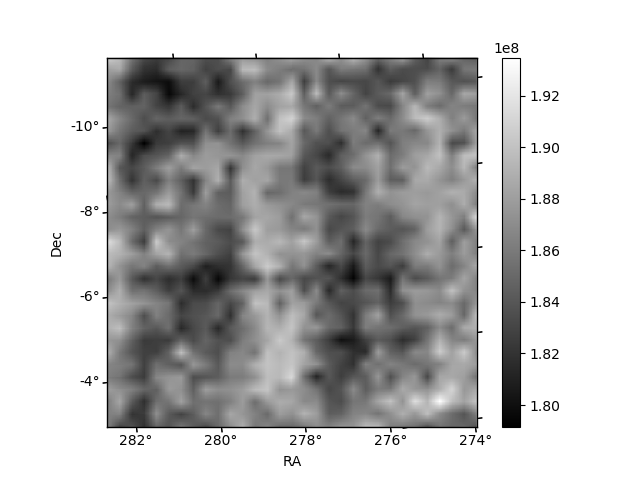
Histogram calculated using DETX and DETY for each event in the final _common_clean file
| Quadrant A | 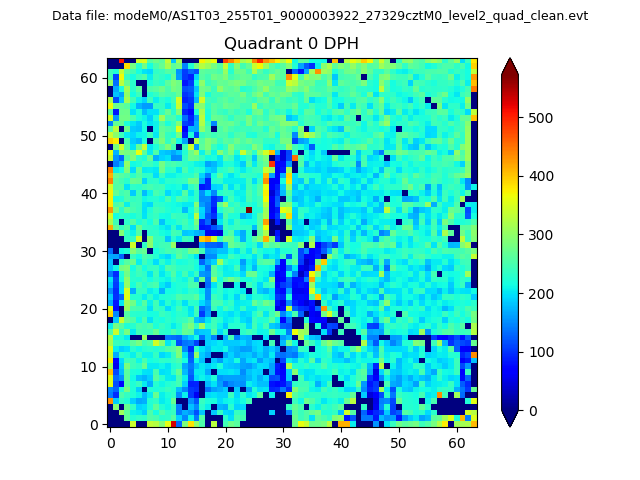 |
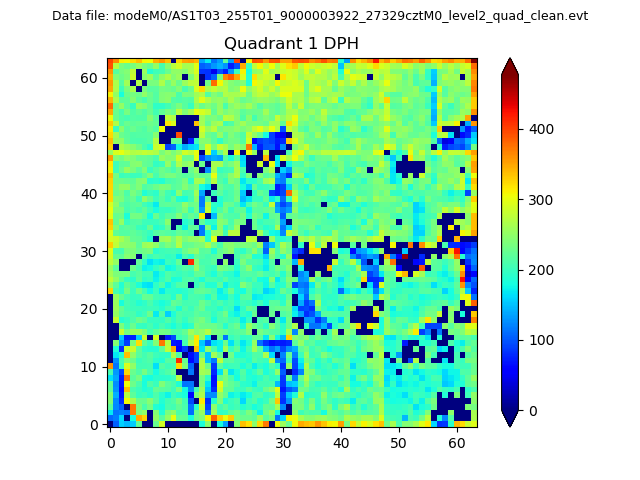 |
Quadrant B |
|---|---|---|---|
| Quadrant D | 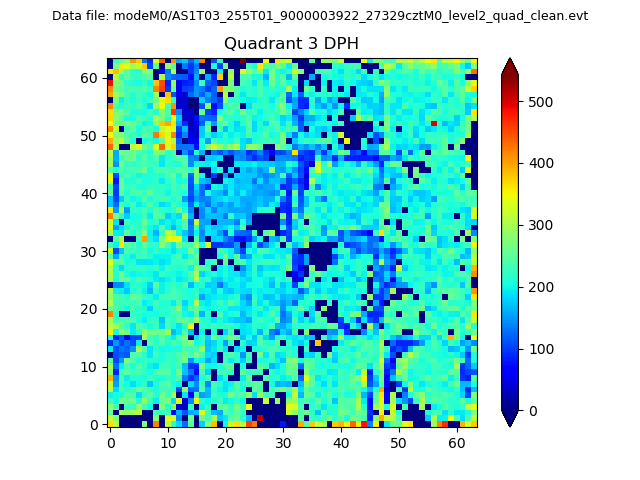 |
 |
Quadrant C |
| Plot type | Count rate plots | Images |
|---|---|---|
| Comparison with Poisson distribution Blue bars denote a histogram of data divided into 1 sec bins. Red curve is a Poisson curve with rate = median count rate of data. |
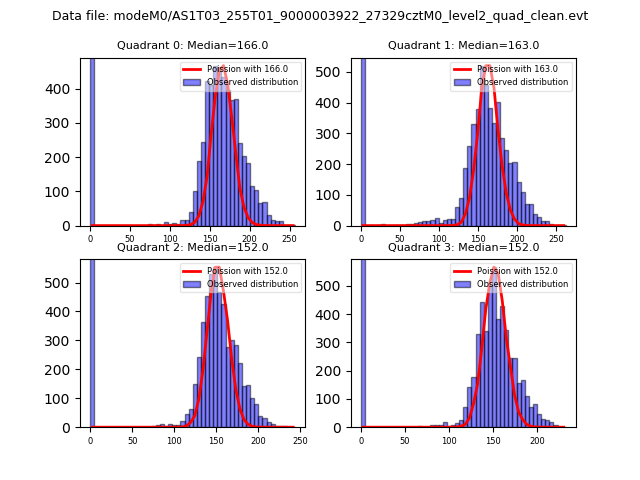 |
 |
| Quadrant-wise count rates Data is divided into 100 sec bins |
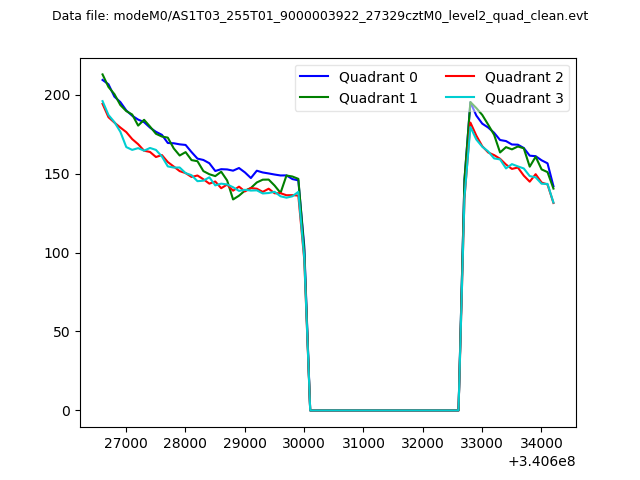 |
|
| Module-wise count rates for Quadrant A Data is divided into 100 sec bins |
 |
 |
| Module-wise count rates for Quadrant B Data is divided into 100 sec bins |
 |
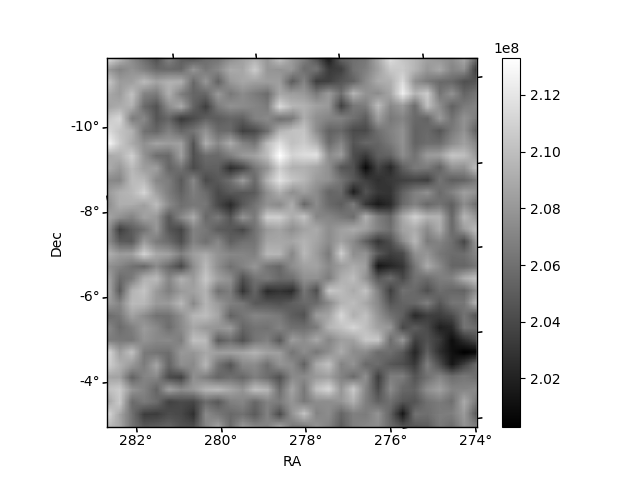 |
| Module-wise count rates for Quadrant C Data is divided into 100 sec bins |
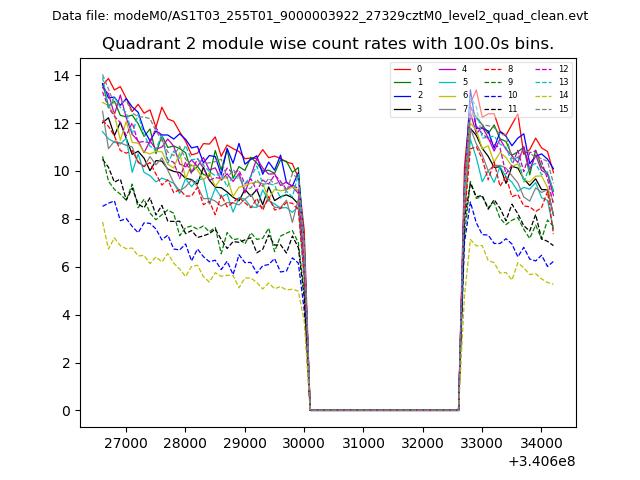 |
 |
| Module-wise count rates for Quadrant D Data is divided into 100 sec bins |
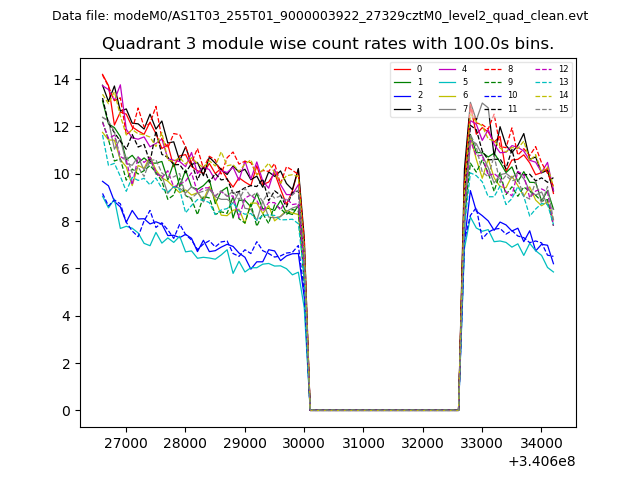 |
 |
| Parameter | Plot |
|---|---|
| CZT HV Monitor |  |
| D_VDD | 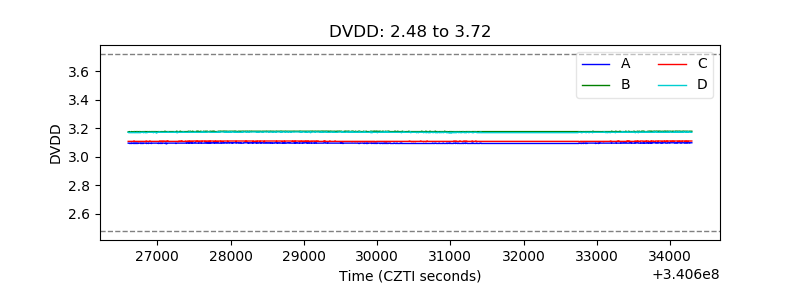 |
| Temperature 1 | 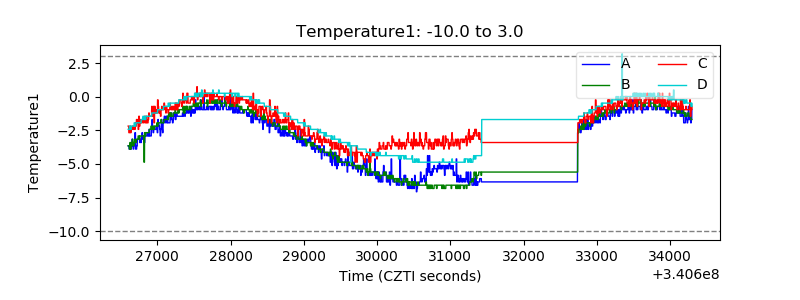 |
| Veto HV Monitor | 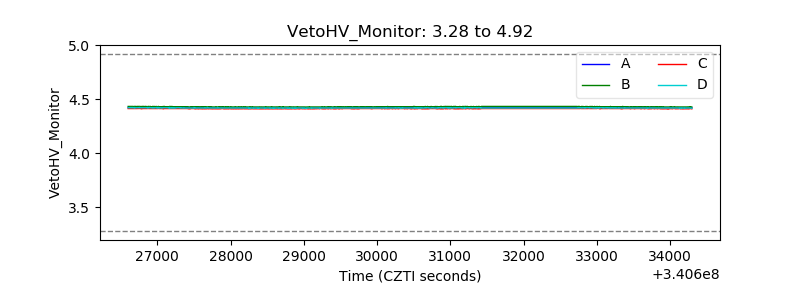 |
| Veto LLD | 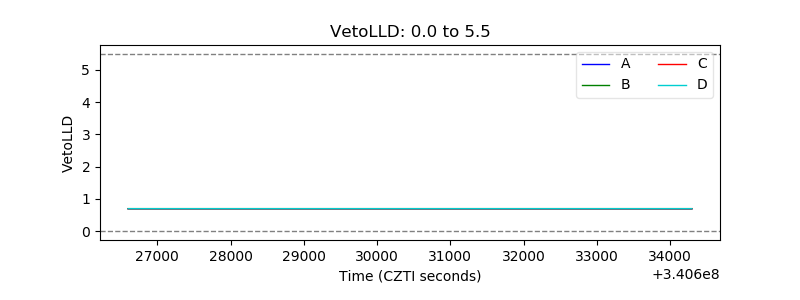 |
| Alpha Counter | 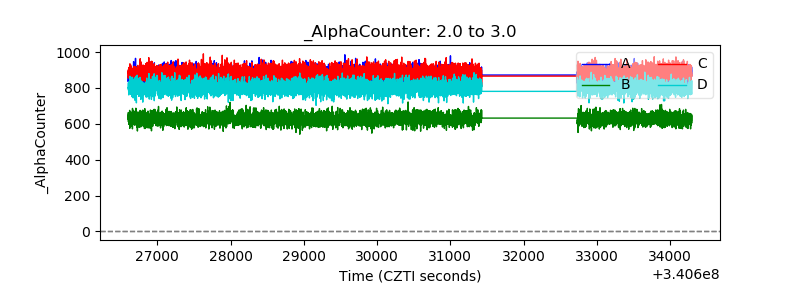 |
| _CPM_Rate | 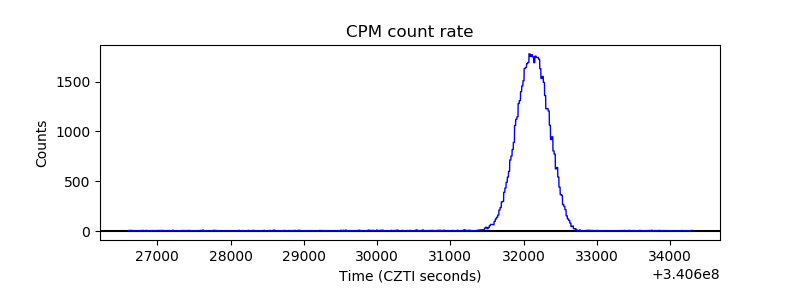 |
| CZT Counter | 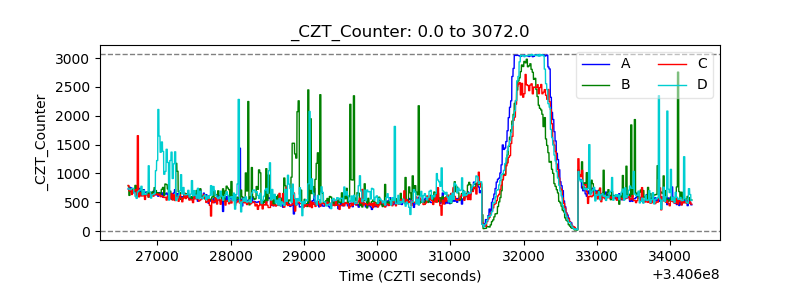 |
| +2.5 Volts monitor |  |
| +5 Volts monitor |  |
| _ROLL_ROT |  |
| _Roll_DEC | 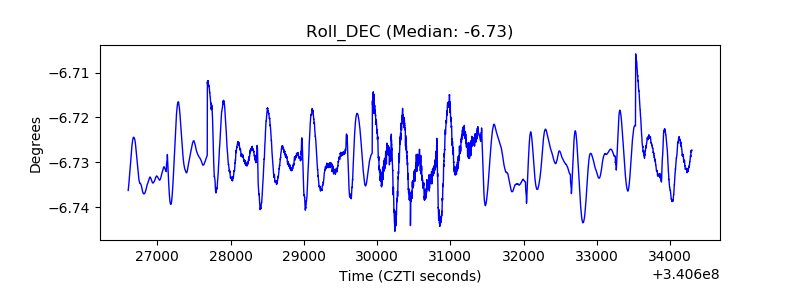 |
| _Roll_RA | 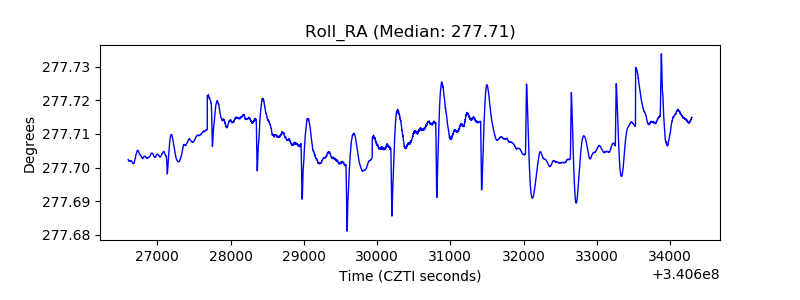 |
| Veto Counter |  |