| Param | Original file | Final file |
|---|---|---|
| Filename | modeM0/AS1T03_255T01_9000003922_27330cztM0_level2.evt | modeM0/AS1T03_255T01_9000003922_27330cztM0_level2_quad_clean.evt |
| Size (bytes) | 454,438,080 | 89,706,240 |
| Size | 433.4 MB | 85.6 MB |
| Events in quadrant A | 3,067,190 | 602,808 |
| Events in quadrant B | 4,076,717 | 587,160 |
| Events in quadrant C | 2,967,338 | 561,894 |
| Events in quadrant D | 3,253,530 | 555,371 |
| Mode M9 | |||
|---|---|---|---|
| Quadrant | BADHDUFLAG | Total packets | Discarded packets |
| A | 0 | 12 | 0 |
| B | 0 | 12 | 0 |
| C | 0 | 12 | 0 |
| D | 0 | 12 | 0 |
| Mode M0 | |||
|---|---|---|---|
| Quadrant | BADHDUFLAG | Total packets | Discarded packets |
| A | 0 | 12616 | 0 |
| B | 0 | 15769 | 0 |
| C | 0 | 12347 | 0 |
| D | 0 | 13383 | 0 |
| Quadrant | Total seconds | Saturated seconds | Saturation percentage |
|---|---|---|---|
| A | 5861 | 117 | 1.996246% |
| B | 5861 | 335 | 5.715748% |
| C | 5861 | 127 | 2.166866% |
| D | 5862 | 99 | 1.688843% |
Noise dominated data is calculated using 1-second bins in cleaned event files. If a bin has >2000 counts, and if more than 50% of those come from <1% of pixels, then it is considered to be noise-dominated and hence unusable.
| Quadrant | # 1 sec bins | Bins with >0 counts | Bins with >2000 counts | High rate bins dominated by noise | Noise dominated (total time) | Noise dominated (detector-on time) | Marked lightcurve |
|---|---|---|---|---|---|---|---|
| A | 7076 | 5862 | 7 | 7 | 0.10% | 0.12% | 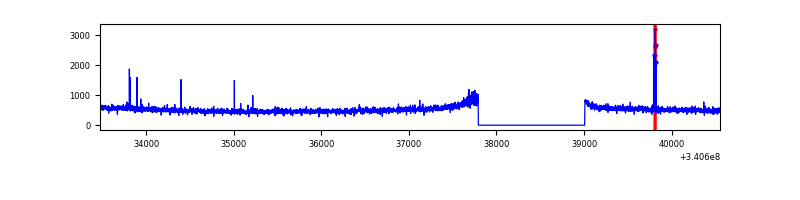 |
| B | 7076 | 5862 | 188 | 188 | 2.66% | 3.21% | 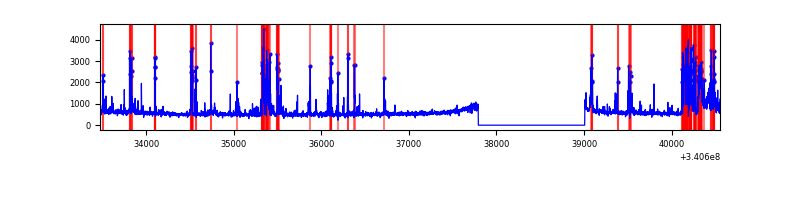 |
| C | 7076 | 5862 | 0 | 0 | 0.00% | 0.00% | 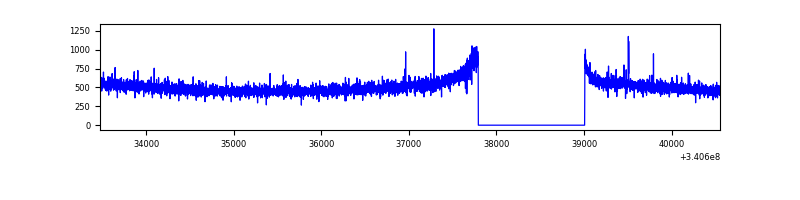 |
| D | 7077 | 5863 | 22 | 22 | 0.31% | 0.38% | 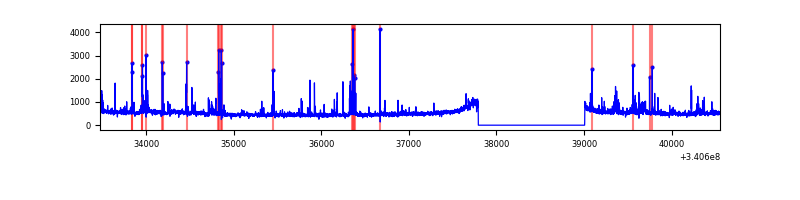 |
Top three noisy pixels from each quadrant. If the there are fewer than three noisy pixels in the level2.evt file, extra rows are filled as -1
| Pixel properties | Quadrant properties | ||||||
|---|---|---|---|---|---|---|---|
| Quadrant | DetID | PixID | Counts | Sigma | Mean | Median | Sigma |
| A | 13 | 248 | 35604 | 222.53 | 779 | 767 | 156.6 |
| A | 12 | 189 | 20661 | 127.08 | 779 | 767 | 156.6 |
| A | 13 | 254 | 9790 | 57.64 | 779 | 767 | 156.6 |
| B | 3 | 64 | 812467 | 5653.23 | 757 | 739 | 143.6 |
| B | 7 | 205 | 109948 | 760.58 | 757 | 739 | 143.6 |
| B | 10 | 245 | 84735 | 584.98 | 757 | 739 | 143.6 |
| C | 14 | 238 | 116623 | 680.47 | 727 | 733 | 170.3 |
| C | 15 | 208 | 7286 | 38.48 | 727 | 733 | 170.3 |
| C | 2 | 16 | 5495 | 27.96 | 727 | 733 | 170.3 |
| D | 2 | 250 | 151637 | 781.09 | 740 | 726 | 193.2 |
| D | 1 | 52 | 119044 | 612.39 | 740 | 726 | 193.2 |
| D | 12 | 233 | 57132 | 291.95 | 740 | 726 | 193.2 |
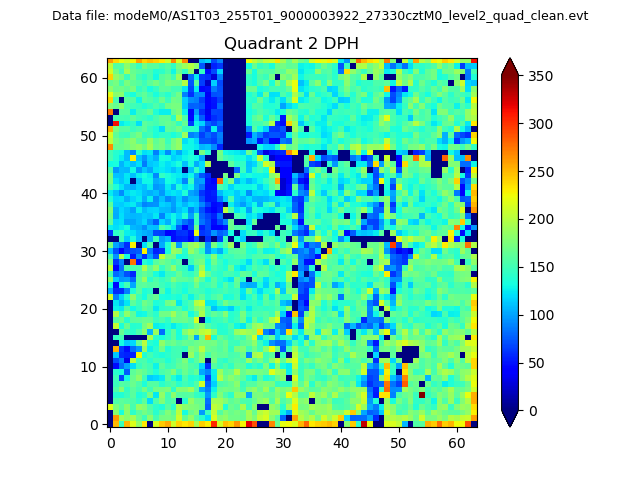
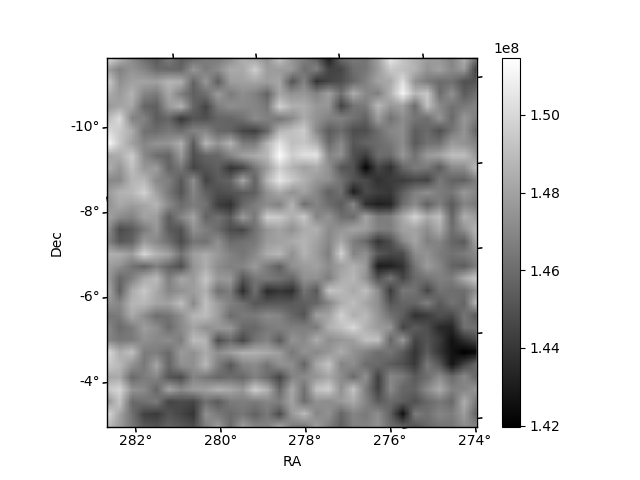
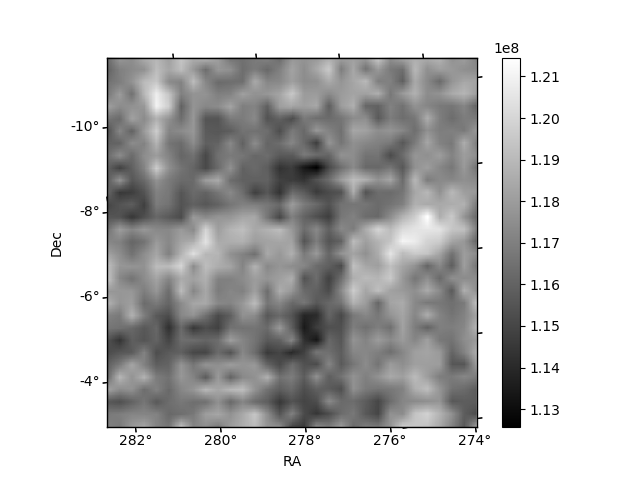
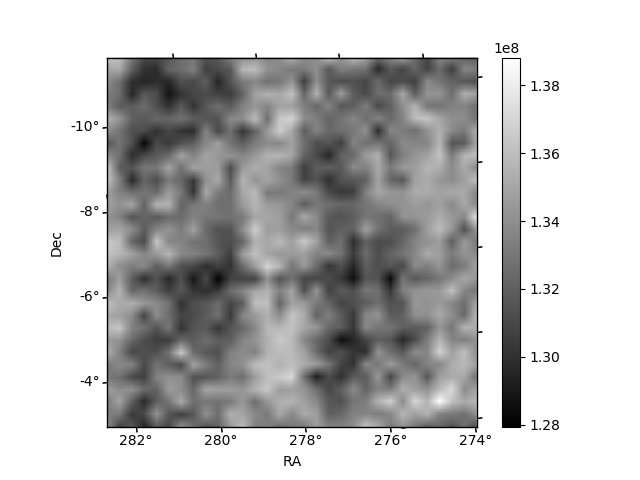
Histogram calculated using DETX and DETY for each event in the final _common_clean file
| Quadrant A | 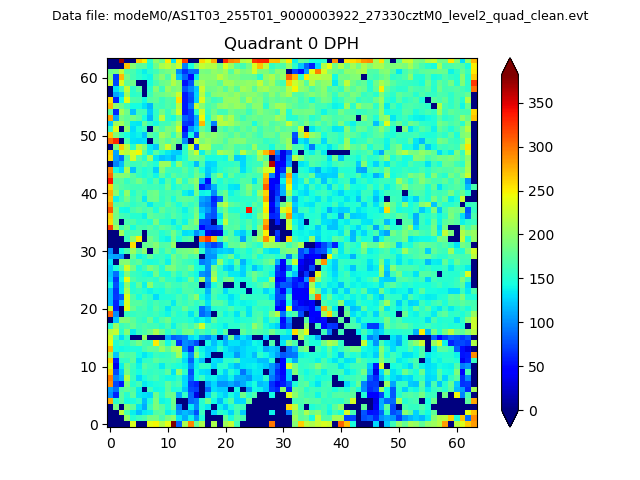 |
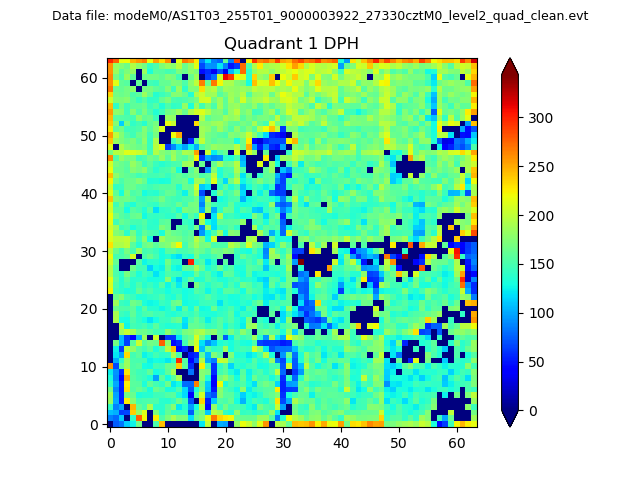 |
Quadrant B |
|---|---|---|---|
| Quadrant D | 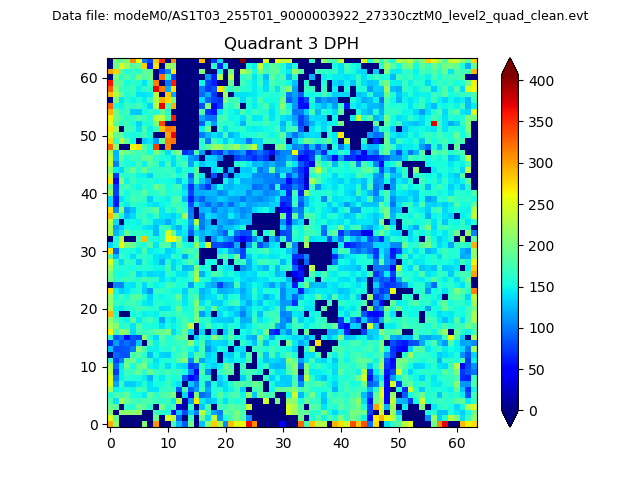 |
 |
Quadrant C |
| Plot type | Count rate plots | Images |
|---|---|---|
| Comparison with Poisson distribution Blue bars denote a histogram of data divided into 1 sec bins. Red curve is a Poisson curve with rate = median count rate of data. |
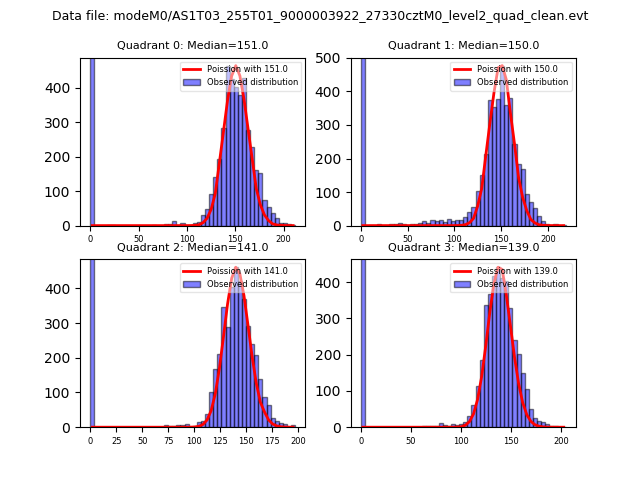 |
 |
| Quadrant-wise count rates Data is divided into 100 sec bins |
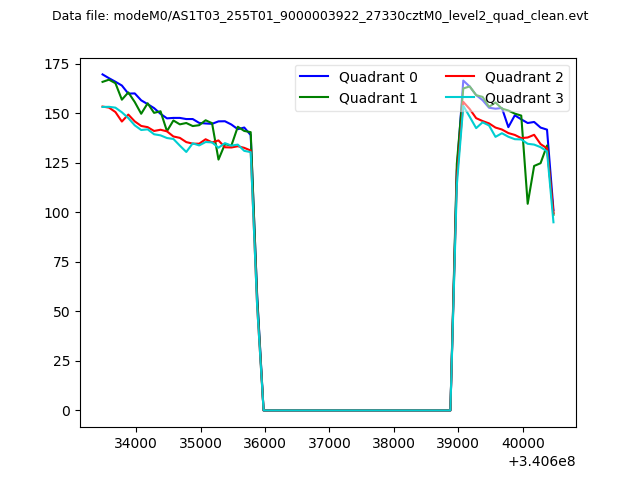 |
|
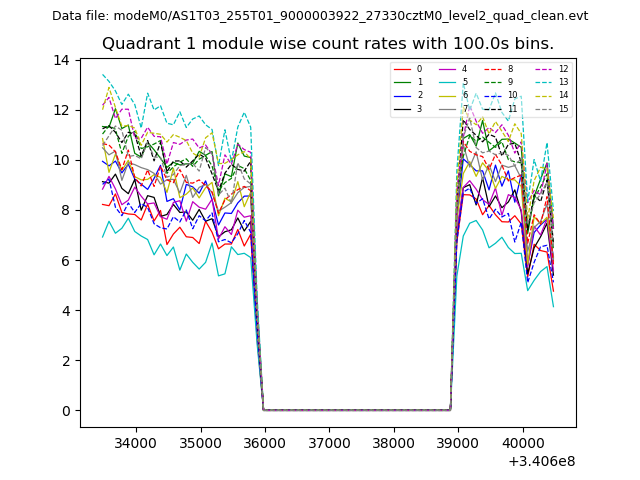
| Module-wise count rates for Quadrant A Data is divided into 100 sec bins |
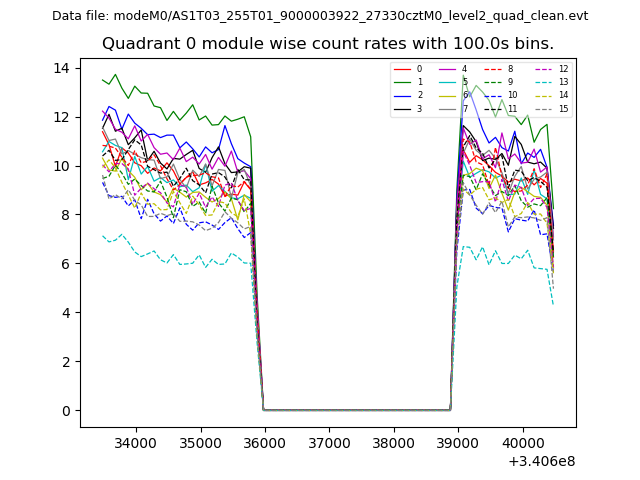 |
 |
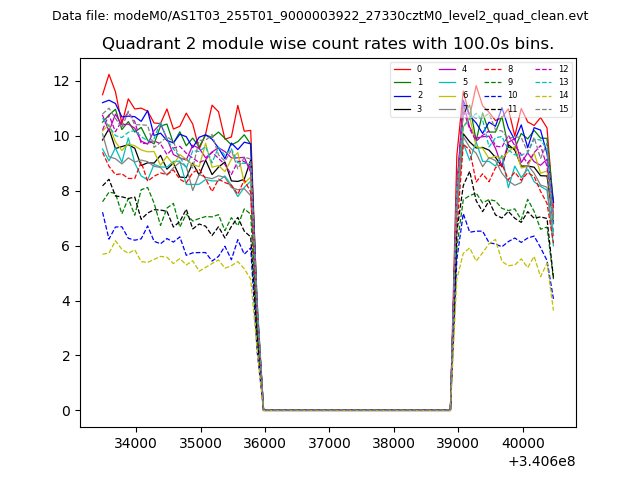
| Module-wise count rates for Quadrant B Data is divided into 100 sec bins |
 |
 |
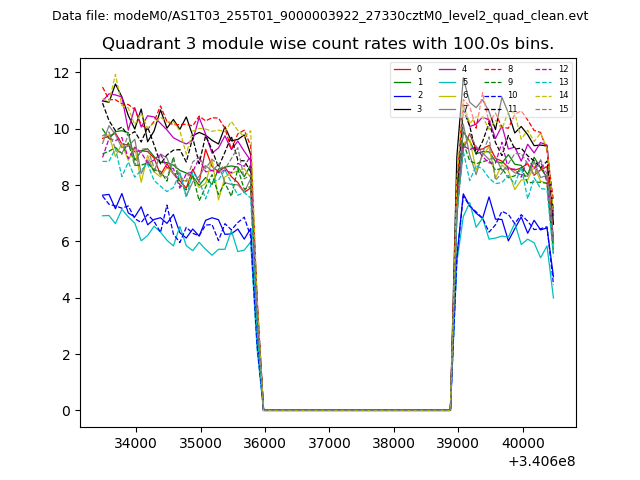
| Module-wise count rates for Quadrant C Data is divided into 100 sec bins |
 |
 |
| Module-wise count rates for Quadrant D Data is divided into 100 sec bins |
 |
 |
| Parameter | Plot |
|---|---|
| CZT HV Monitor | 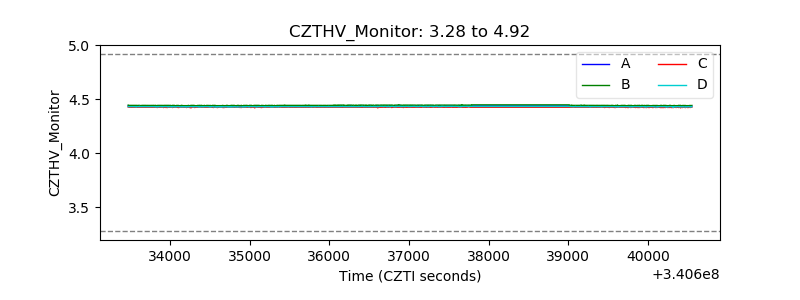 |
| D_VDD | 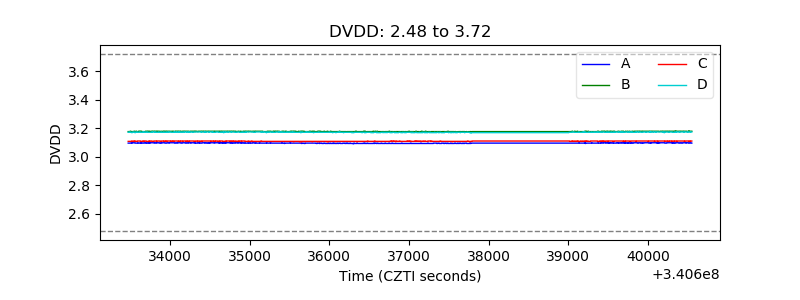 |
| Temperature 1 | 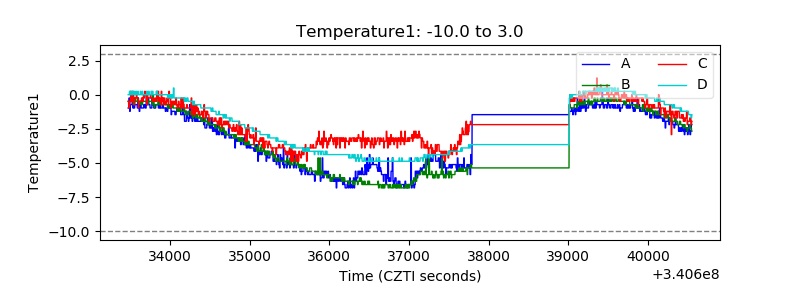 |
| Veto HV Monitor | 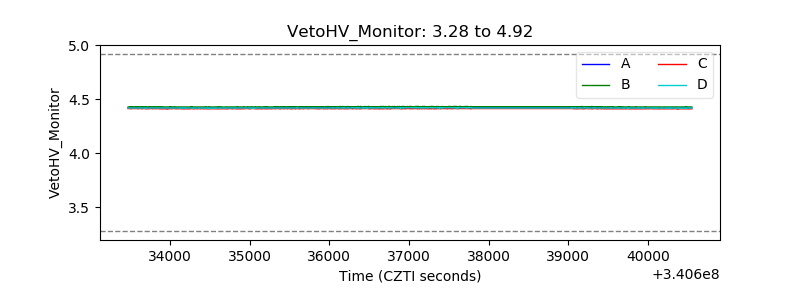 |
| Veto LLD | 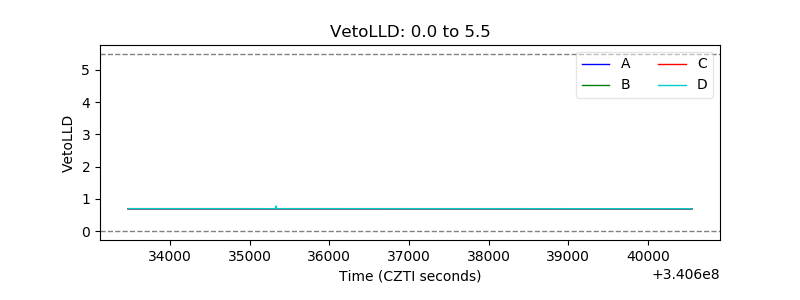 |
| Alpha Counter | 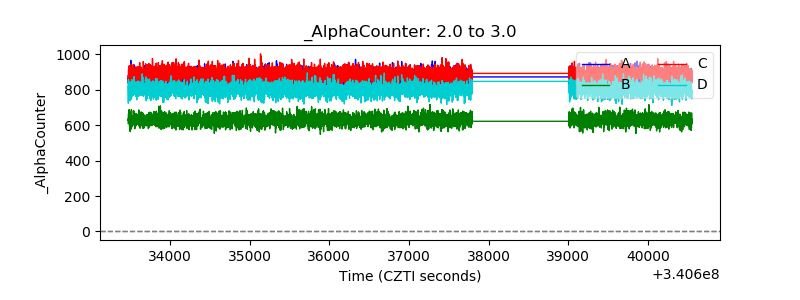 |
| _CPM_Rate | 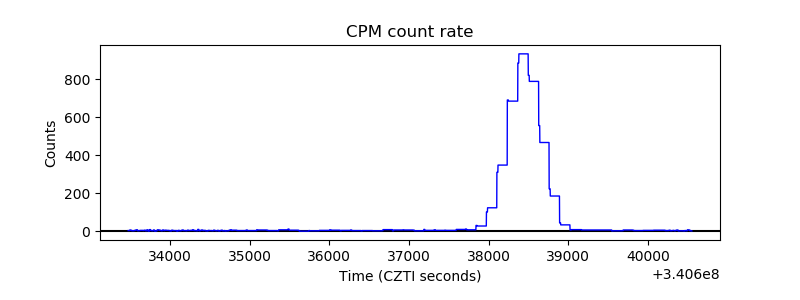 |
| CZT Counter | 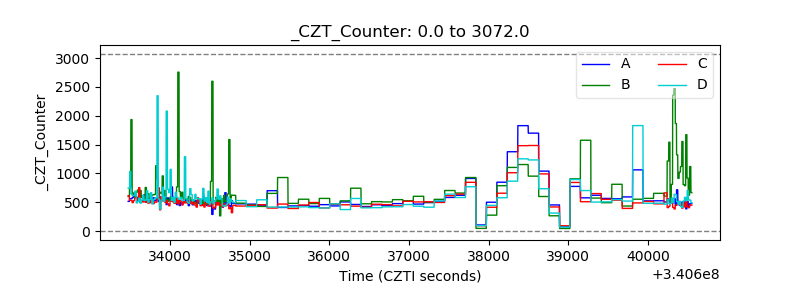 |
| +2.5 Volts monitor |  |
| +5 Volts monitor | 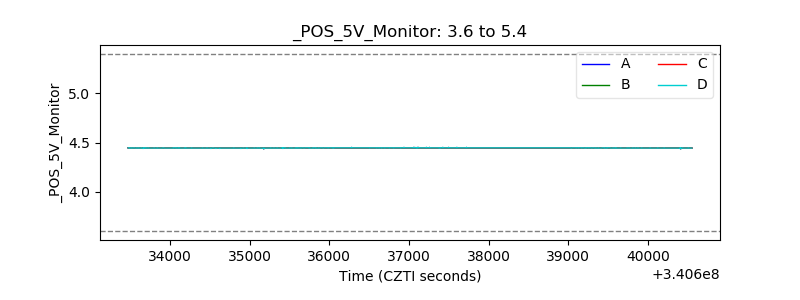 |
| _ROLL_ROT | 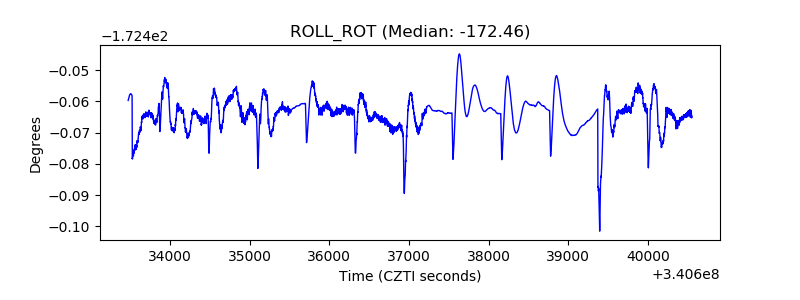 |
| _Roll_DEC | 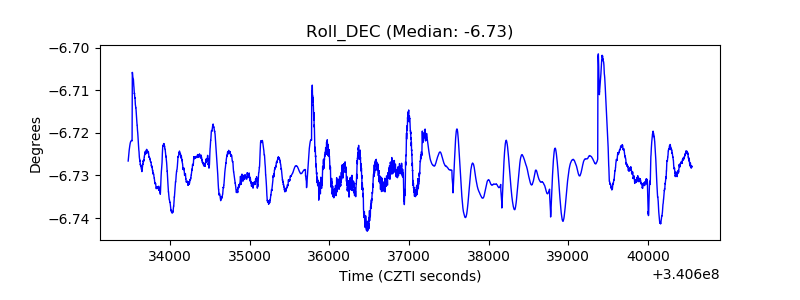 |
| _Roll_RA | 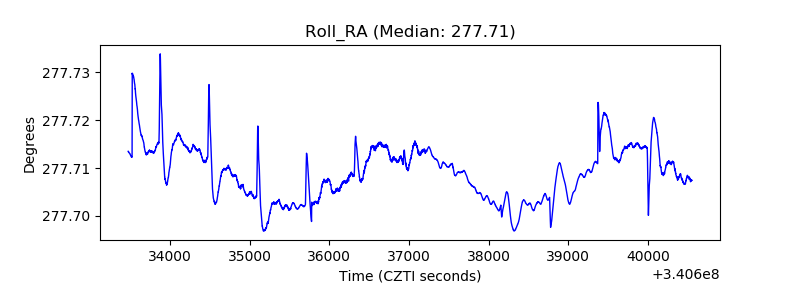 |
| Veto Counter | 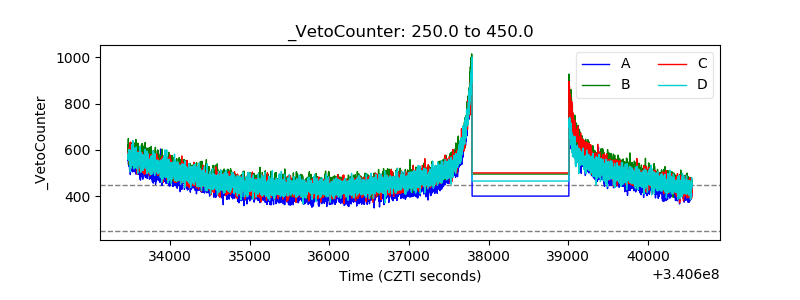 |