| Param | Original file | Final file |
|---|---|---|
| Filename | modeM0/AS1T03_255T01_9000003922_27331cztM0_level2.evt | modeM0/AS1T03_255T01_9000003922_27331cztM0_level2_quad_clean.evt |
| Size (bytes) | 543,199,680 | 92,191,680 |
| Size | 518.0 MB | 87.9 MB |
| Events in quadrant A | 3,380,117 | 611,578 |
| Events in quadrant B | 4,817,586 | 584,982 |
| Events in quadrant C | 3,272,492 | 575,356 |
| Events in quadrant D | 4,535,729 | 562,048 |
| Mode M9 | |||
|---|---|---|---|
| Quadrant | BADHDUFLAG | Total packets | Discarded packets |
| A | 0 | 9 | 0 |
| B | 0 | 9 | 0 |
| C | 0 | 9 | 0 |
| D | 0 | 9 | 0 |
| Mode M0 | |||
|---|---|---|---|
| Quadrant | BADHDUFLAG | Total packets | Discarded packets |
| A | 0 | 14152 | 0 |
| B | 0 | 18555 | 0 |
| C | 0 | 13808 | 0 |
| D | 0 | 17630 | 0 |
| Quadrant | Total seconds | Saturated seconds | Saturation percentage |
|---|---|---|---|
| A | 6563 | 70 | 1.066585% |
| B | 6562 | 416 | 6.339531% |
| C | 6563 | 98 | 1.493220% |
| D | 6563 | 146 | 2.224592% |
Noise dominated data is calculated using 1-second bins in cleaned event files. If a bin has >2000 counts, and if more than 50% of those come from <1% of pixels, then it is considered to be noise-dominated and hence unusable.
| Quadrant | # 1 sec bins | Bins with >0 counts | Bins with >2000 counts | High rate bins dominated by noise | Noise dominated (total time) | Noise dominated (detector-on time) | Marked lightcurve |
|---|---|---|---|---|---|---|---|
| A | 7508 | 6564 | 7 | 7 | 0.09% | 0.11% | 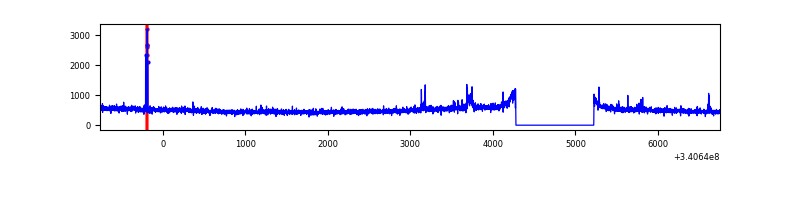 |
| B | 7508 | 6563 | 260 | 260 | 3.46% | 3.96% | 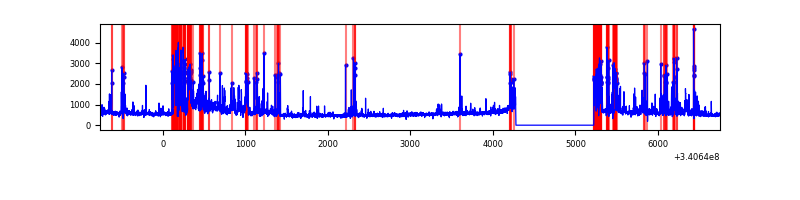 |
| C | 7508 | 6564 | 3 | 3 | 0.04% | 0.05% | 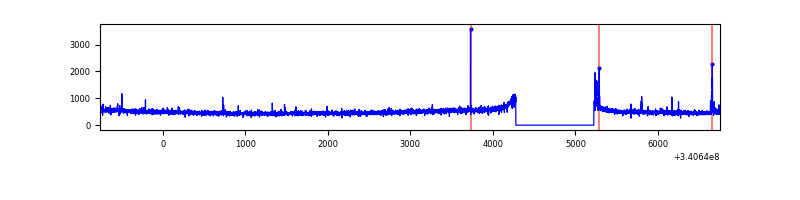 |
| D | 7508 | 6564 | 183 | 183 | 2.44% | 2.79% | 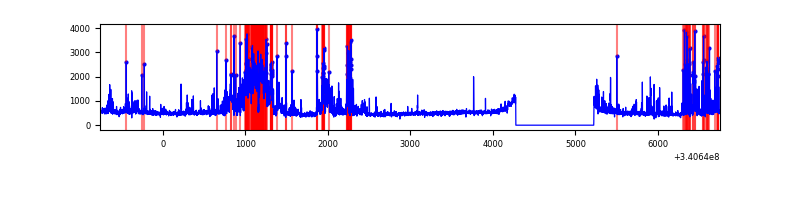 |
Top three noisy pixels from each quadrant. If the there are fewer than three noisy pixels in the level2.evt file, extra rows are filled as -1
| Pixel properties | Quadrant properties | ||||||
|---|---|---|---|---|---|---|---|
| Quadrant | DetID | PixID | Counts | Sigma | Mean | Median | Sigma |
| A | 15 | 174 | 58392 | 338.64 | 843 | 826 | 170.0 |
| A | 12 | 189 | 30966 | 177.3 | 843 | 826 | 170.0 |
| A | 13 | 248 | 26223 | 149.4 | 843 | 826 | 170.0 |
| B | 3 | 64 | 1106130 | 7091.07 | 812 | 793 | 155.9 |
| B | 5 | 172 | 309342 | 1979.44 | 812 | 793 | 155.9 |
| B | 7 | 205 | 144794 | 923.81 | 812 | 793 | 155.9 |
| C | 14 | 238 | 126786 | 680.45 | 790 | 796 | 185.2 |
| C | 2 | 16 | 38629 | 204.33 | 790 | 796 | 185.2 |
| C | 15 | 208 | 11297 | 56.71 | 790 | 796 | 185.2 |
| D | 12 | 227 | 539812 | 2572.34 | 796 | 782 | 209.5 |
| D | 2 | 250 | 281926 | 1341.66 | 796 | 782 | 209.5 |
| D | 12 | 233 | 230763 | 1097.51 | 796 | 782 | 209.5 |
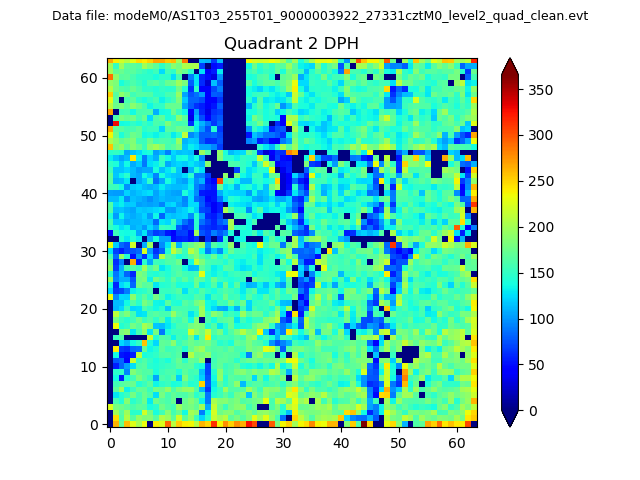
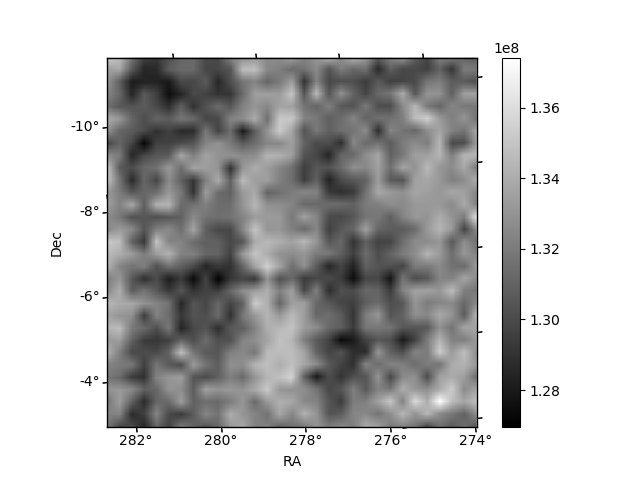
Histogram calculated using DETX and DETY for each event in the final _common_clean file
| Quadrant A | 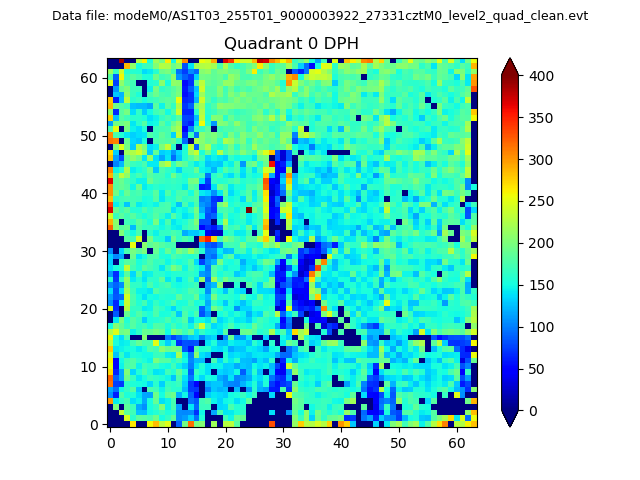 |
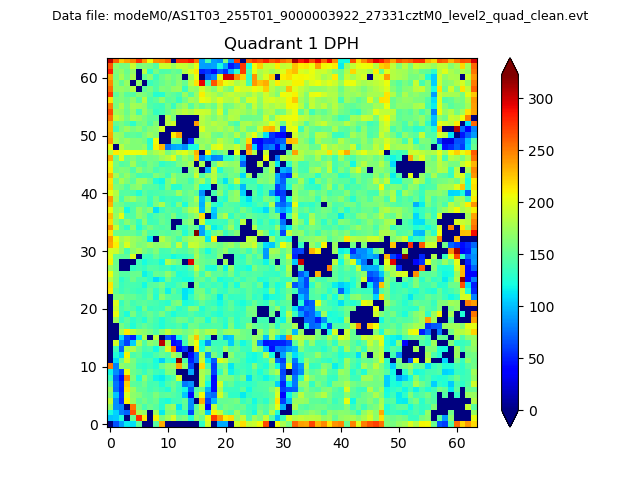 |
Quadrant B |
|---|---|---|---|
| Quadrant D | 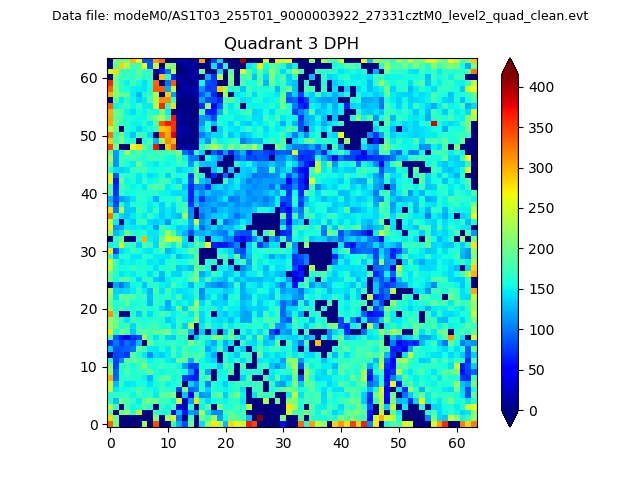 |
 |
Quadrant C |
| Plot type | Count rate plots | Images |
|---|---|---|
| Comparison with Poisson distribution Blue bars denote a histogram of data divided into 1 sec bins. Red curve is a Poisson curve with rate = median count rate of data. |
 |
 |
| Quadrant-wise count rates Data is divided into 100 sec bins |
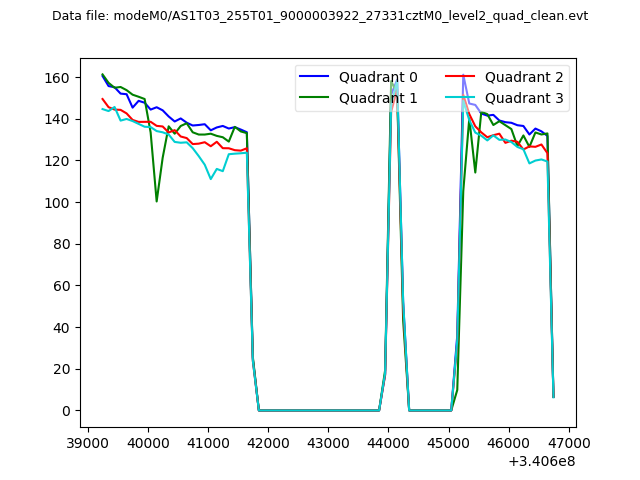 |
|
| Module-wise count rates for Quadrant A Data is divided into 100 sec bins |
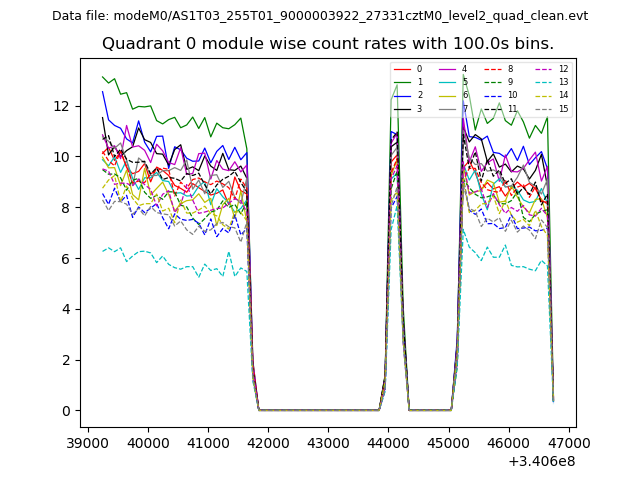 |
 |
| Module-wise count rates for Quadrant B Data is divided into 100 sec bins |
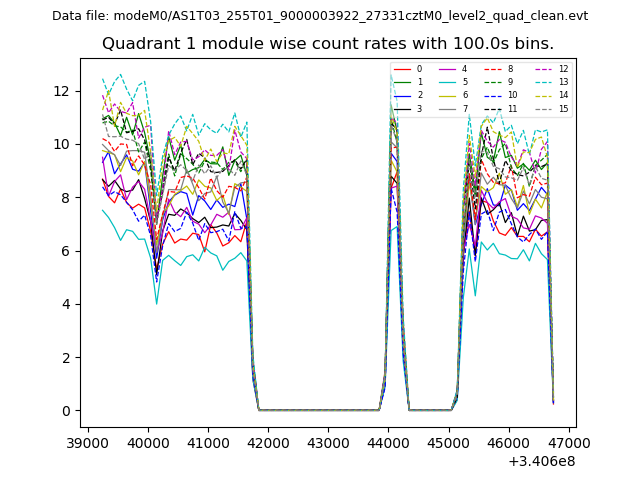 |
 |
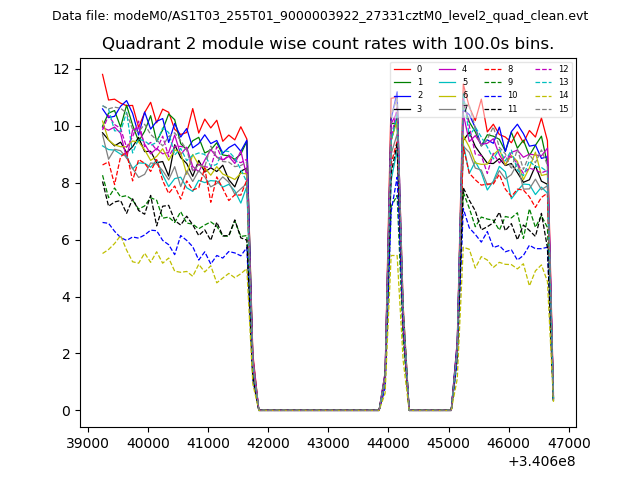
| Module-wise count rates for Quadrant C Data is divided into 100 sec bins |
 |
 |
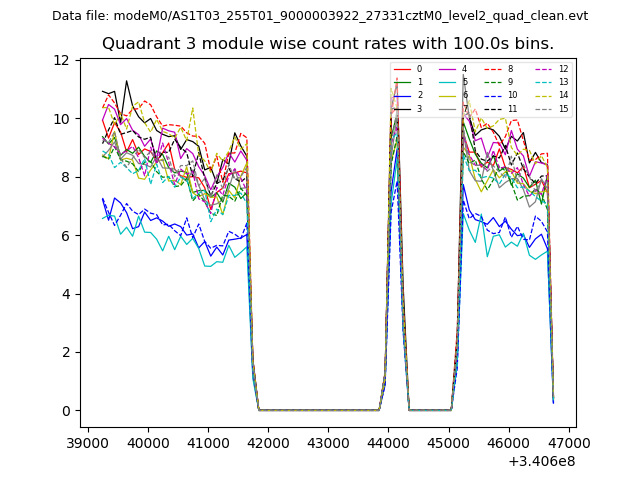
| Module-wise count rates for Quadrant D Data is divided into 100 sec bins |
 |
 |
| Parameter | Plot |
|---|---|
| CZT HV Monitor | 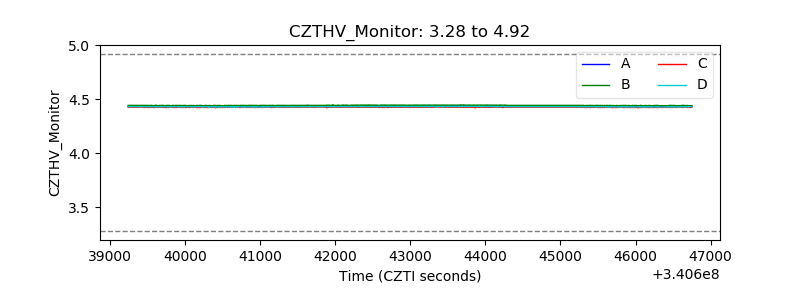 |
| D_VDD | 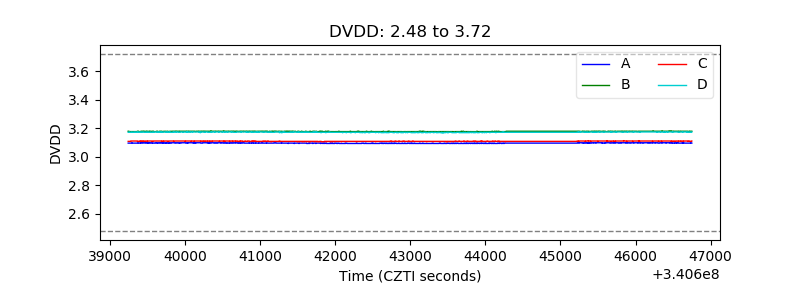 |
| Temperature 1 | 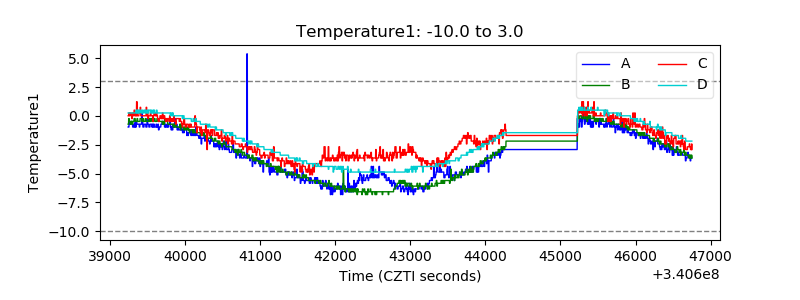 |
| Veto HV Monitor | 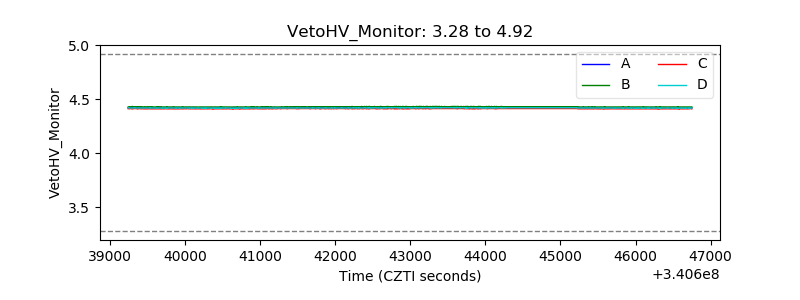 |
| Veto LLD | 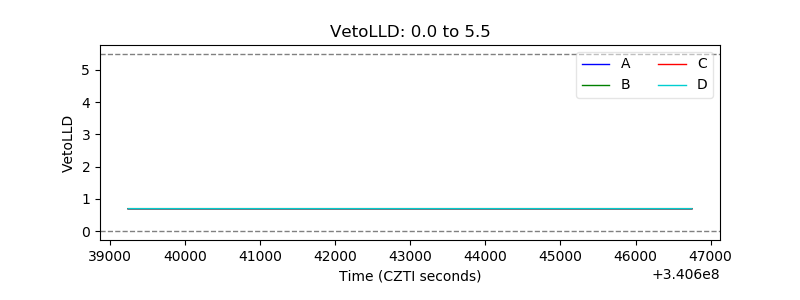 |
| Alpha Counter |  |
| _CPM_Rate | 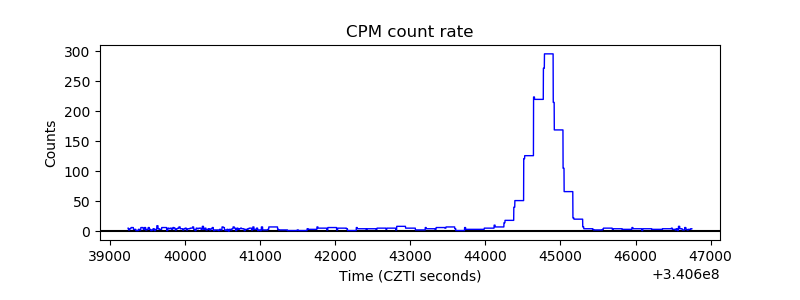 |
| CZT Counter |  |
| +2.5 Volts monitor |  |
| +5 Volts monitor |  |
| _ROLL_ROT | 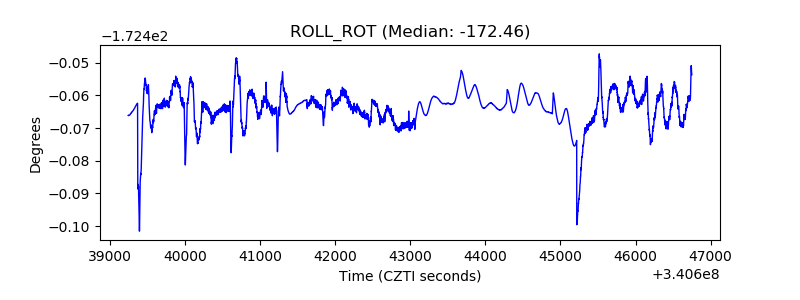 |
| _Roll_DEC | 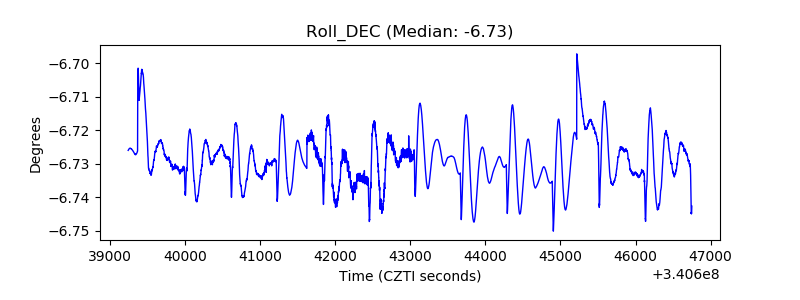 |
| _Roll_RA | 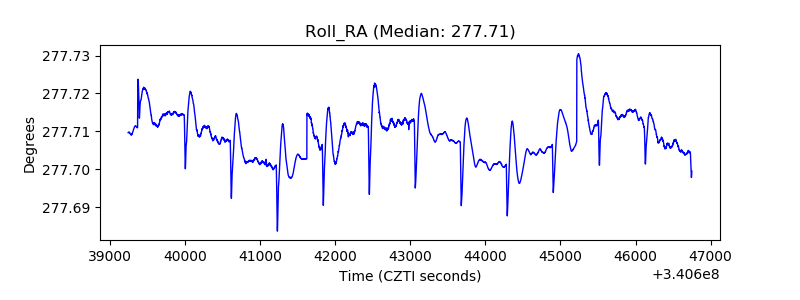 |
| Veto Counter | 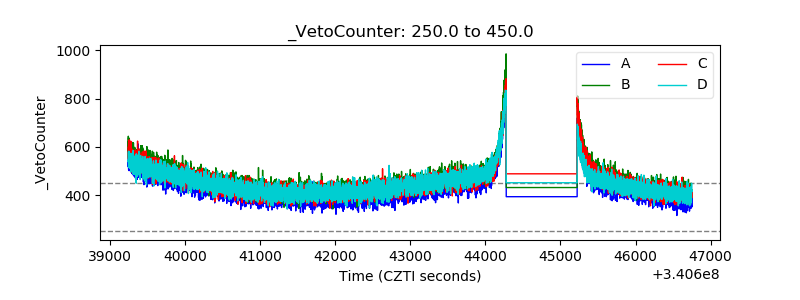 |