| Param | Original file | Final file |
|---|---|---|
| Filename | modeM0/AS1T03_255T01_9000003922_27332cztM0_level2.evt | modeM0/AS1T03_255T01_9000003922_27332cztM0_level2_quad_clean.evt |
| Size (bytes) | 547,657,920 | 97,790,400 |
| Size | 522.3 MB | 93.3 MB |
| Events in quadrant A | 3,472,766 | 641,883 |
| Events in quadrant B | 4,677,176 | 633,705 |
| Events in quadrant C | 3,719,278 | 605,215 |
| Events in quadrant D | 4,244,281 | 595,442 |
| Mode M9 | |||
|---|---|---|---|
| Quadrant | BADHDUFLAG | Total packets | Discarded packets |
| A | 0 | 5 | 0 |
| B | 0 | 5 | 0 |
| C | 0 | 5 | 0 |
| D | 0 | 5 | 0 |
| Mode M0 | |||
|---|---|---|---|
| Quadrant | BADHDUFLAG | Total packets | Discarded packets |
| A | 0 | 14754 | 0 |
| B | 0 | 18262 | 0 |
| C | 0 | 15634 | 0 |
| D | 0 | 17015 | 0 |
| Quadrant | Total seconds | Saturated seconds | Saturation percentage |
|---|---|---|---|
| A | 6963 | 40 | 0.574465% |
| B | 6963 | 341 | 4.897314% |
| C | 6963 | 145 | 2.082436% |
| D | 6963 | 151 | 2.168605% |
Noise dominated data is calculated using 1-second bins in cleaned event files. If a bin has >2000 counts, and if more than 50% of those come from <1% of pixels, then it is considered to be noise-dominated and hence unusable.
| Quadrant | # 1 sec bins | Bins with >0 counts | Bins with >2000 counts | High rate bins dominated by noise | Noise dominated (total time) | Noise dominated (detector-on time) | Marked lightcurve |
|---|---|---|---|---|---|---|---|
| A | 7503 | 6964 | 5 | 5 | 0.07% | 0.07% | 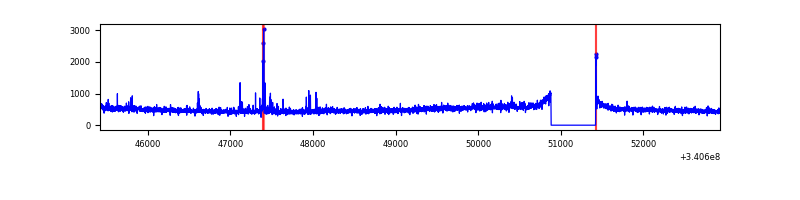 |
| B | 7503 | 6964 | 166 | 166 | 2.21% | 2.38% | 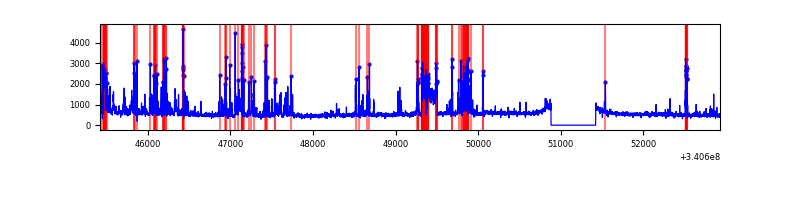 |
| C | 7503 | 6964 | 39 | 39 | 0.52% | 0.56% | 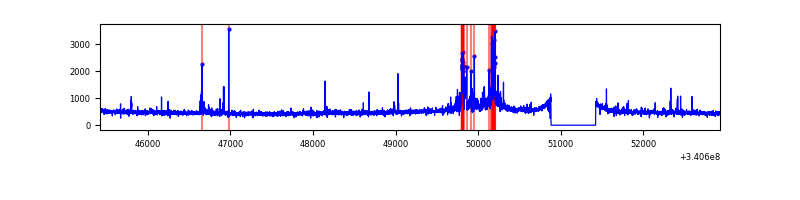 |
| D | 7503 | 6964 | 119 | 119 | 1.59% | 1.71% | 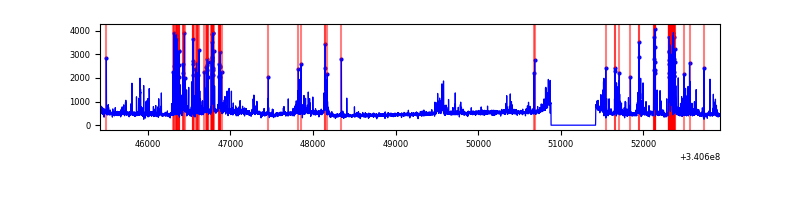 |
Top three noisy pixels from each quadrant. If the there are fewer than three noisy pixels in the level2.evt file, extra rows are filled as -1
| Pixel properties | Quadrant properties | ||||||
|---|---|---|---|---|---|---|---|
| Quadrant | DetID | PixID | Counts | Sigma | Mean | Median | Sigma |
| A | 14 | 235 | 58748 | 331.21 | 870 | 851 | 174.8 |
| A | 12 | 189 | 21422 | 117.68 | 870 | 851 | 174.8 |
| A | 13 | 254 | 12606 | 67.25 | 870 | 851 | 174.8 |
| B | 3 | 64 | 921108 | 5597.17 | 856 | 835 | 164.4 |
| B | 5 | 172 | 169942 | 1028.52 | 856 | 835 | 164.4 |
| B | 7 | 205 | 144753 | 875.32 | 856 | 835 | 164.4 |
| C | 8 | 208 | 302921 | 1569.16 | 819 | 824 | 192.5 |
| C | 14 | 238 | 130906 | 675.68 | 819 | 824 | 192.5 |
| C | 2 | 16 | 76869 | 394.99 | 819 | 824 | 192.5 |
| D | 2 | 250 | 403629 | 1873.77 | 825 | 807 | 215.0 |
| D | 12 | 233 | 369146 | 1713.37 | 825 | 807 | 215.0 |
| D | 1 | 52 | 227911 | 1056.4 | 825 | 807 | 215.0 |
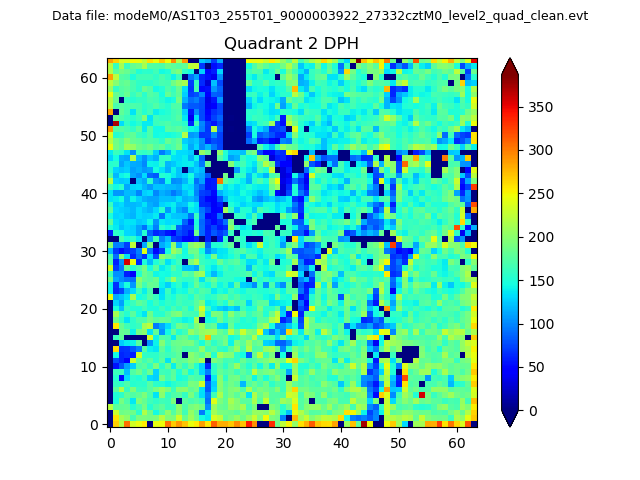
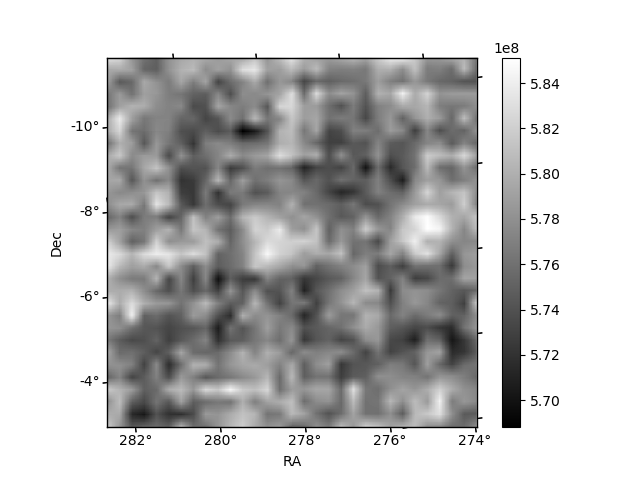
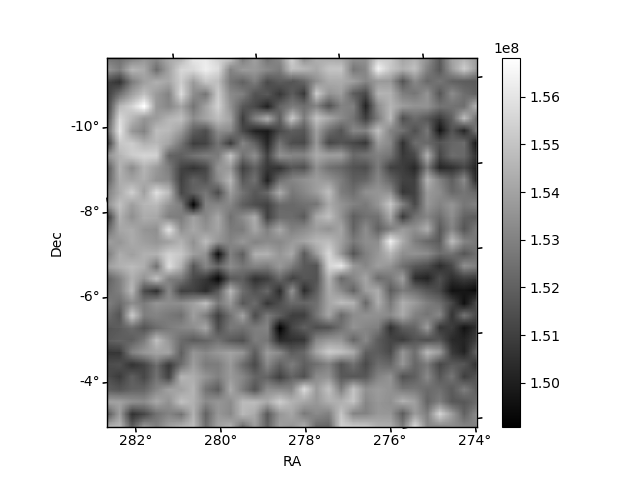
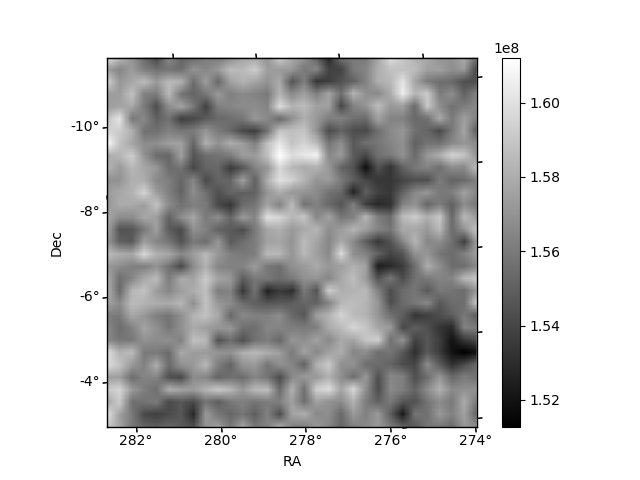
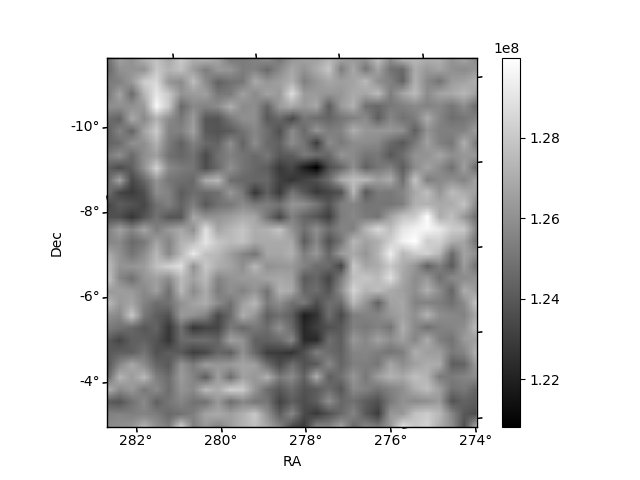
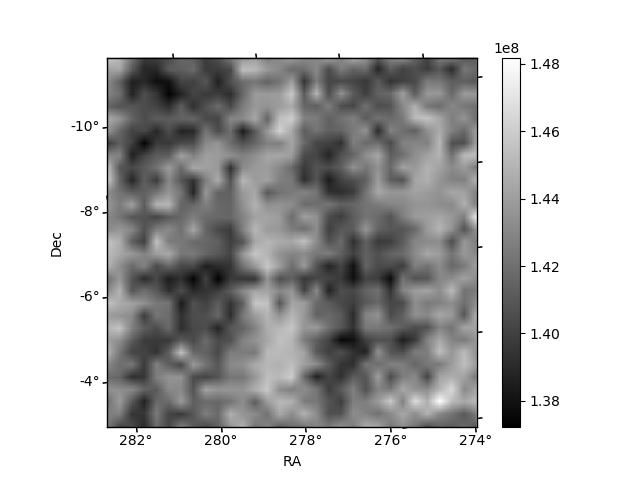
Histogram calculated using DETX and DETY for each event in the final _common_clean file
| Quadrant A | 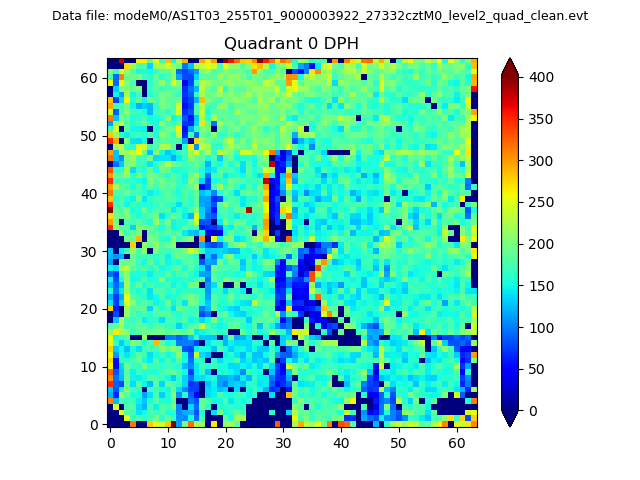 |
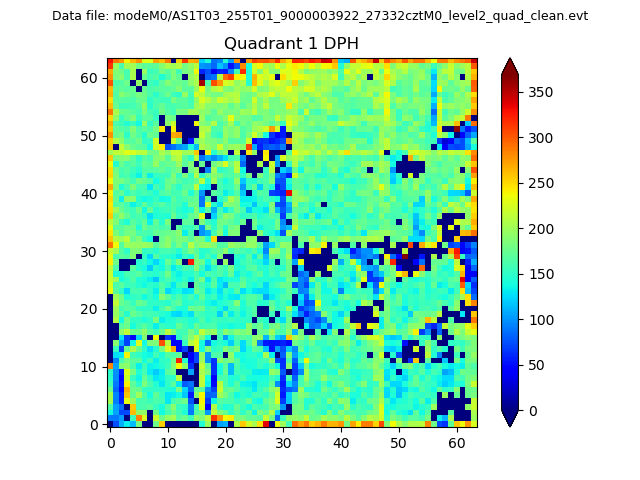 |
Quadrant B |
|---|---|---|---|
| Quadrant D | 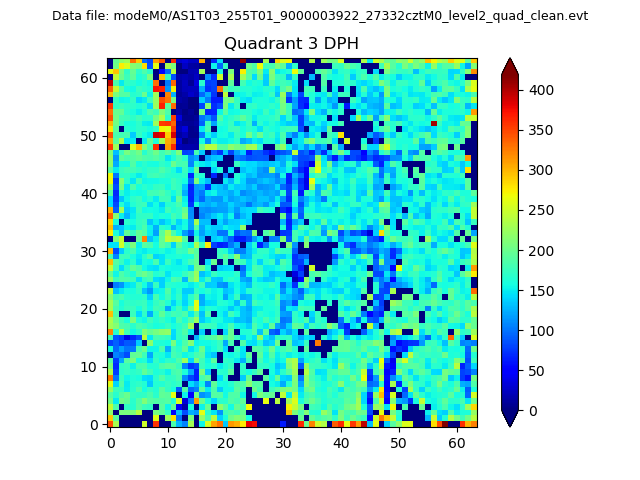 |
 |
Quadrant C |
| Plot type | Count rate plots | Images |
|---|---|---|
| Comparison with Poisson distribution Blue bars denote a histogram of data divided into 1 sec bins. Red curve is a Poisson curve with rate = median count rate of data. |
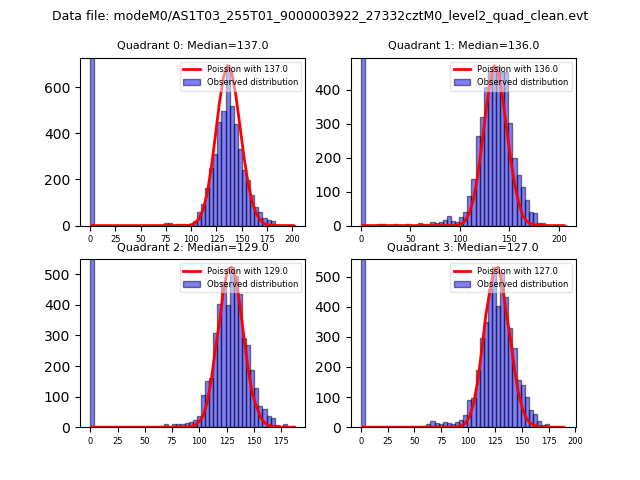 |
 |
| Quadrant-wise count rates Data is divided into 100 sec bins |
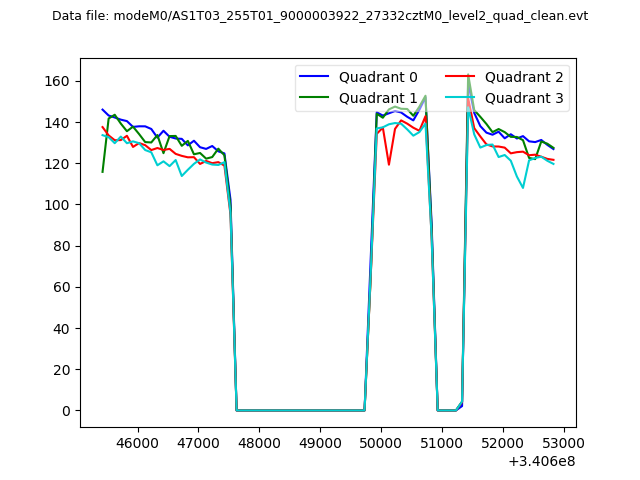 |
|
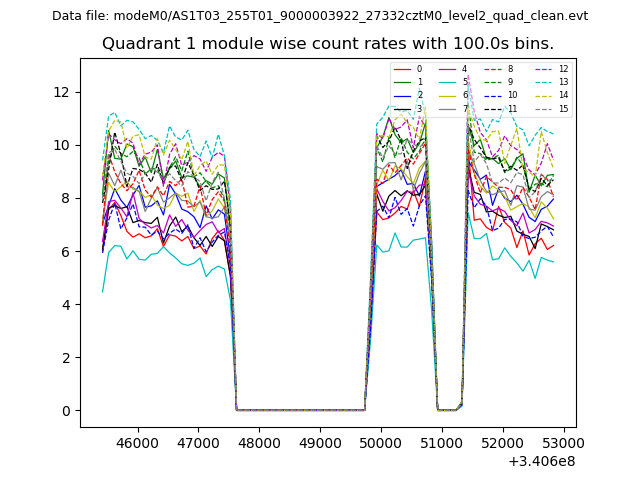
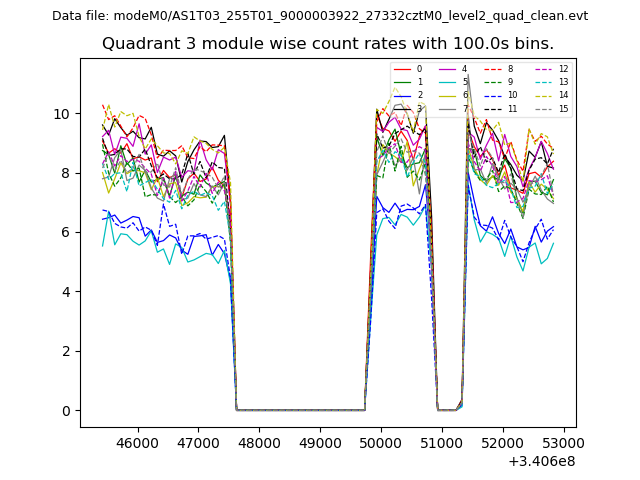
| Module-wise count rates for Quadrant A Data is divided into 100 sec bins |
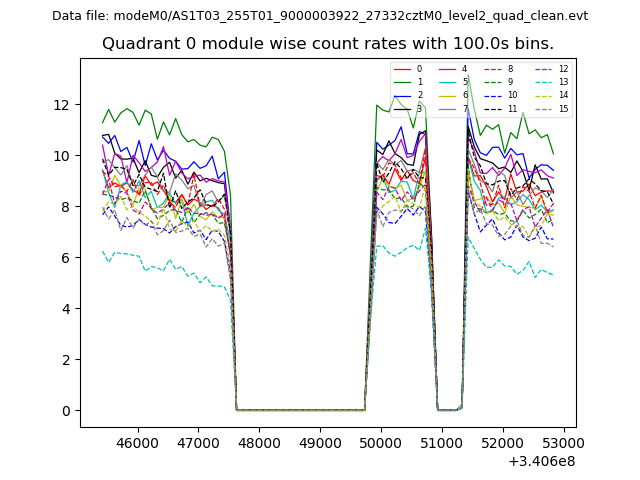 |
 |
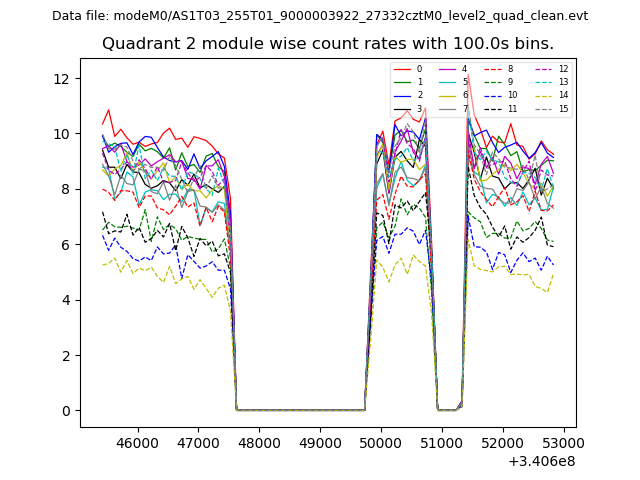
| Module-wise count rates for Quadrant B Data is divided into 100 sec bins |
 |
 |
| Module-wise count rates for Quadrant C Data is divided into 100 sec bins |
 |
 |
| Module-wise count rates for Quadrant D Data is divided into 100 sec bins |
 |
 |
| Parameter | Plot |
|---|---|
| CZT HV Monitor | 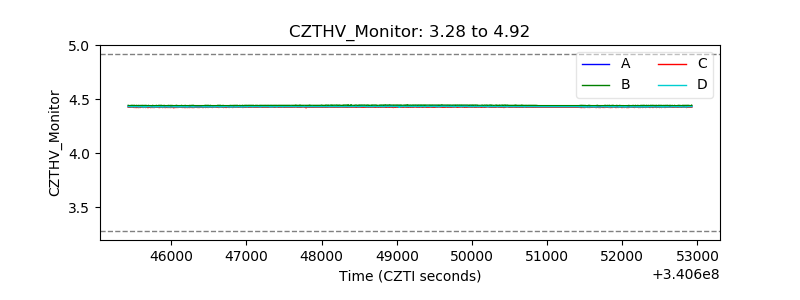 |
| D_VDD | 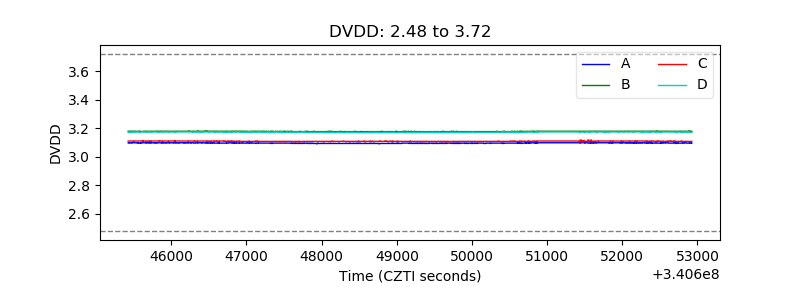 |
| Temperature 1 | 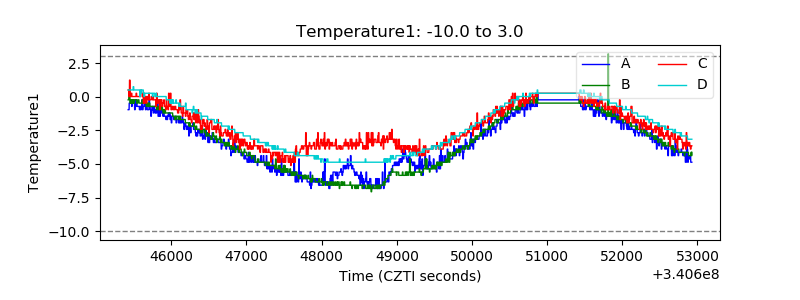 |
| Veto HV Monitor |  |
| Veto LLD | 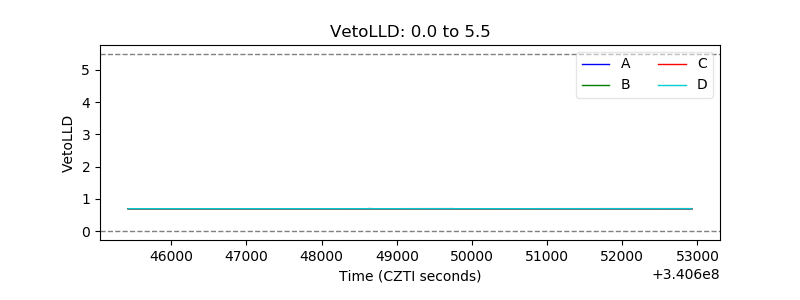 |
| Alpha Counter | 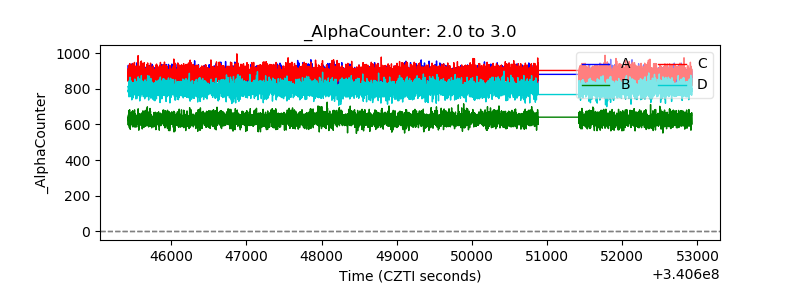 |
| _CPM_Rate | 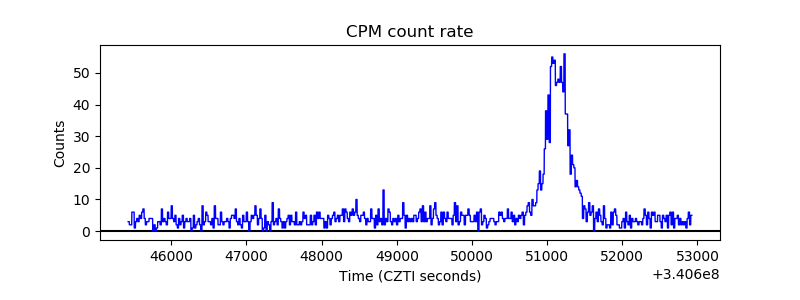 |
| CZT Counter | 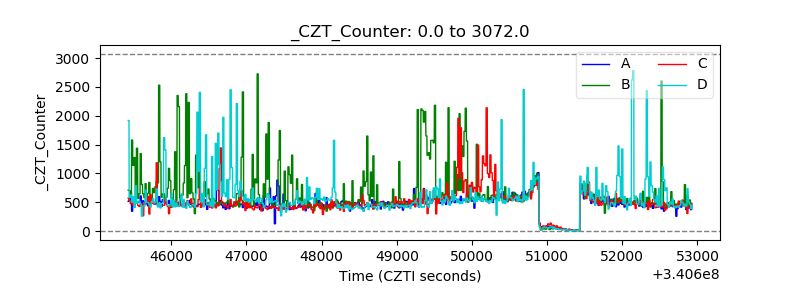 |
| +2.5 Volts monitor | 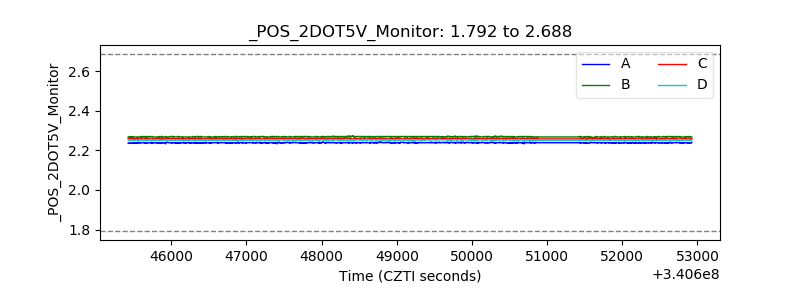 |
| +5 Volts monitor |  |
| _ROLL_ROT |  |
| _Roll_DEC | 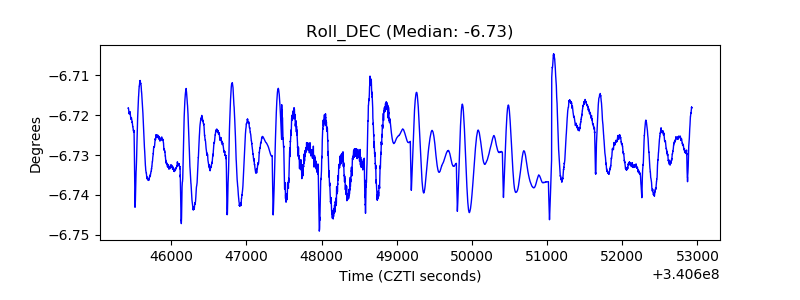 |
| _Roll_RA | 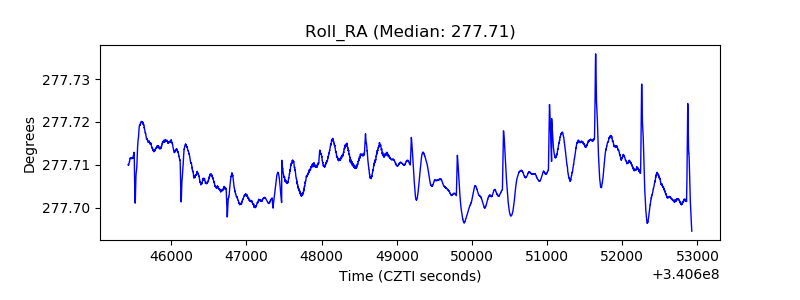 |
| Veto Counter | 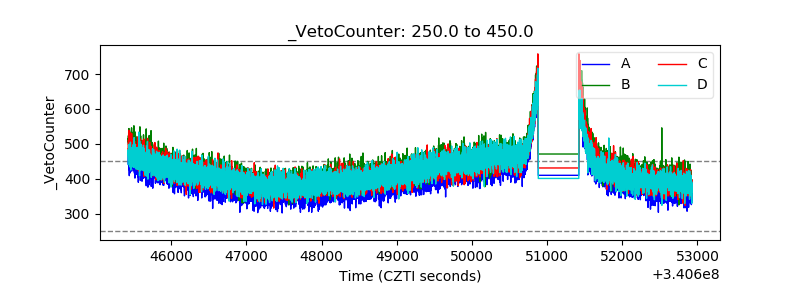 |