| Param | Original file | Final file |
|---|---|---|
| Filename | modeM0/AS1T03_255T01_9000003922_27333cztM0_level2.evt | modeM0/AS1T03_255T01_9000003922_27333cztM0_level2_quad_clean.evt |
| Size (bytes) | 554,811,840 | 106,372,800 |
| Size | 529.1 MB | 101.4 MB |
| Events in quadrant A | 3,621,745 | 704,836 |
| Events in quadrant B | 4,709,158 | 675,064 |
| Events in quadrant C | 3,686,320 | 668,050 |
| Events in quadrant D | 4,278,153 | 653,473 |
| Mode M9 | |||
|---|---|---|---|
| Quadrant | BADHDUFLAG | Total packets | Discarded packets |
| A | 0 | 2 | 0 |
| B | 0 | 2 | 0 |
| C | 0 | 2 | 0 |
| D | 0 | 2 | 0 |
| Mode M0 | |||
|---|---|---|---|
| Quadrant | BADHDUFLAG | Total packets | Discarded packets |
| A | 0 | 15552 | 0 |
| B | 0 | 18651 | 0 |
| C | 0 | 15748 | 0 |
| D | 0 | 17704 | 0 |
| Quadrant | Total seconds | Saturated seconds | Saturation percentage |
|---|---|---|---|
| A | 7469 | 28 | 0.374883% |
| B | 7470 | 454 | 6.077644% |
| C | 7470 | 90 | 1.204819% |
| D | 7470 | 143 | 1.914324% |
Noise dominated data is calculated using 1-second bins in cleaned event files. If a bin has >2000 counts, and if more than 50% of those come from <1% of pixels, then it is considered to be noise-dominated and hence unusable.
| Quadrant | # 1 sec bins | Bins with >0 counts | Bins with >2000 counts | High rate bins dominated by noise | Noise dominated (total time) | Noise dominated (detector-on time) | Marked lightcurve |
|---|---|---|---|---|---|---|---|
| A | 7729 | 7470 | 2 | 2 | 0.03% | 0.03% |  |
| B | 7730 | 7471 | 273 | 273 | 3.53% | 3.65% |  |
| C | 7730 | 7471 | 9 | 9 | 0.12% | 0.12% |  |
| D | 7730 | 7471 | 114 | 114 | 1.47% | 1.53% |  |
Top three noisy pixels from each quadrant. If the there are fewer than three noisy pixels in the level2.evt file, extra rows are filled as -1
| Pixel properties | Quadrant properties | ||||||
|---|---|---|---|---|---|---|---|
| Quadrant | DetID | PixID | Counts | Sigma | Mean | Median | Sigma |
| A | 15 | 174 | 14881 | 74.34 | 927 | 909 | 187.9 |
| A | 13 | 254 | 13145 | 65.1 | 927 | 909 | 187.9 |
| A | 3 | 137 | 8591 | 40.87 | 927 | 909 | 187.9 |
| B | 5 | 172 | 551629 | 3215.05 | 897 | 877 | 171.3 |
| B | 3 | 64 | 435929 | 2539.64 | 897 | 877 | 171.3 |
| B | 7 | 205 | 146813 | 851.91 | 897 | 877 | 171.3 |
| C | 14 | 238 | 137641 | 659.5 | 877 | 884 | 207.4 |
| C | 2 | 16 | 90784 | 433.54 | 877 | 884 | 207.4 |
| C | 15 | 208 | 35692 | 167.86 | 877 | 884 | 207.4 |
| D | 2 | 250 | 454379 | 1975.92 | 880 | 862 | 229.5 |
| D | 12 | 233 | 158810 | 688.16 | 880 | 862 | 229.5 |
| D | 6 | 112 | 150680 | 652.74 | 880 | 862 | 229.5 |
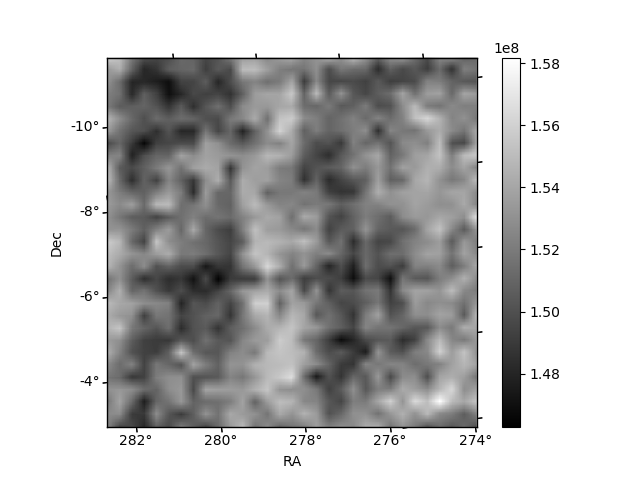
Histogram calculated using DETX and DETY for each event in the final _common_clean file
| Quadrant A |  |
 |
Quadrant B |
|---|---|---|---|
| Quadrant D |  |
 |
Quadrant C |
| Plot type | Count rate plots | Images |
|---|---|---|
| Comparison with Poisson distribution Blue bars denote a histogram of data divided into 1 sec bins. Red curve is a Poisson curve with rate = median count rate of data. |
 |
 |
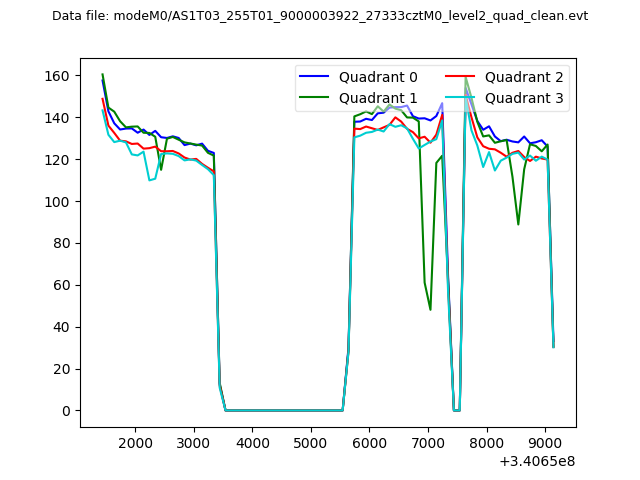
| Quadrant-wise count rates Data is divided into 100 sec bins |
 |
|
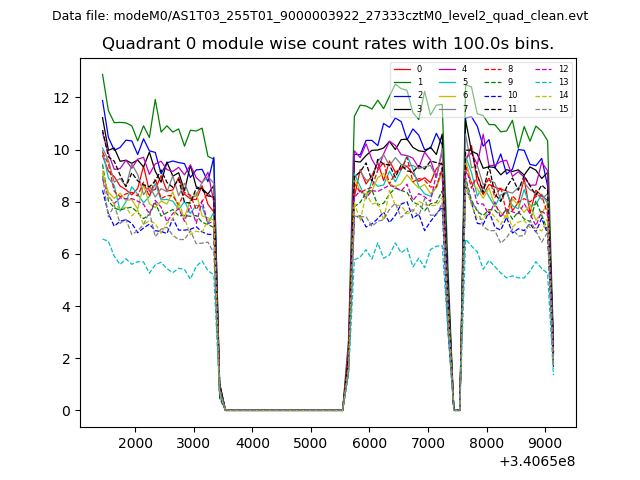
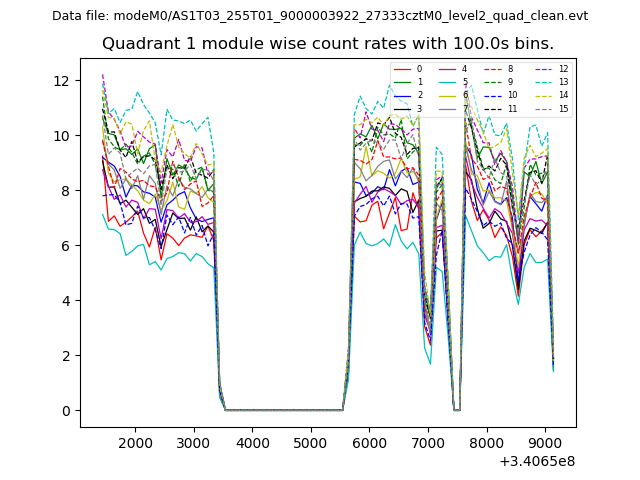
| Module-wise count rates for Quadrant A Data is divided into 100 sec bins |
 |
 |
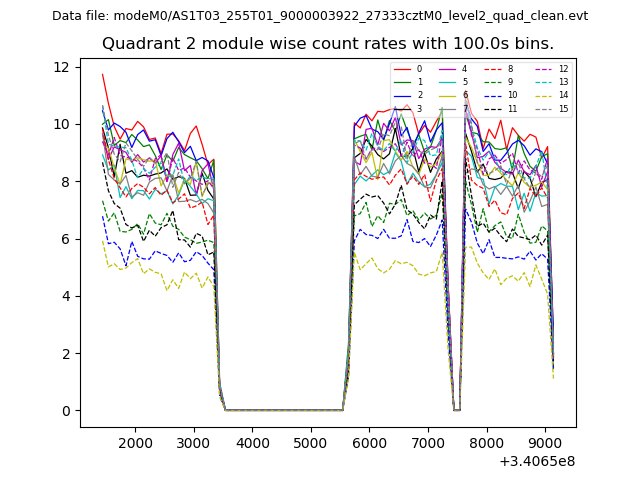
| Module-wise count rates for Quadrant B Data is divided into 100 sec bins |
 |
 |
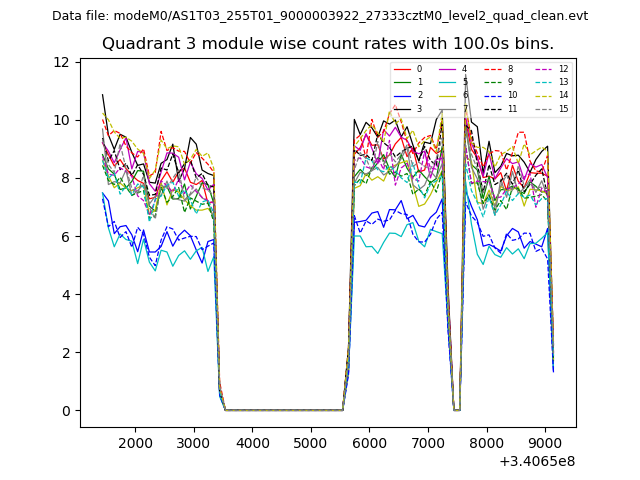
| Module-wise count rates for Quadrant C Data is divided into 100 sec bins |
 |
 |
| Module-wise count rates for Quadrant D Data is divided into 100 sec bins |
 |
 |
| Parameter | Plot |
|---|---|
| CZT HV Monitor | 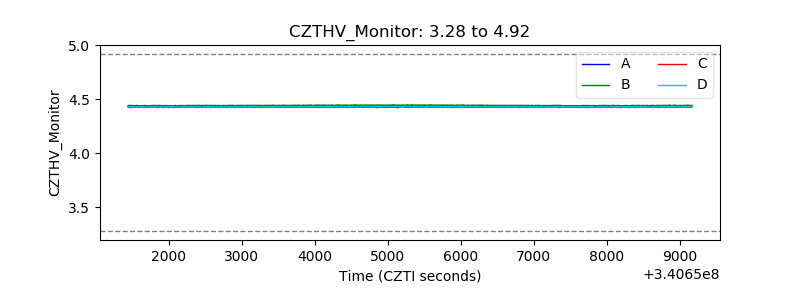 |
| D_VDD | 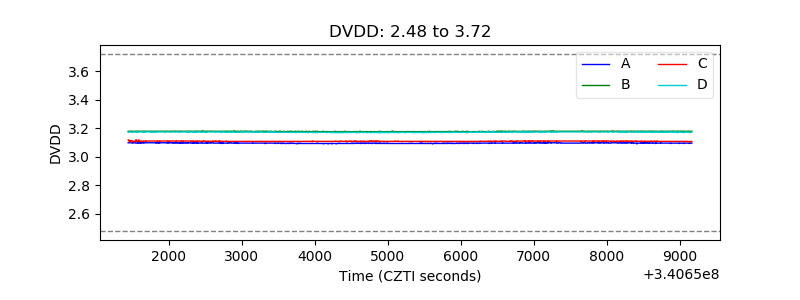 |
| Temperature 1 |  |
| Veto HV Monitor | 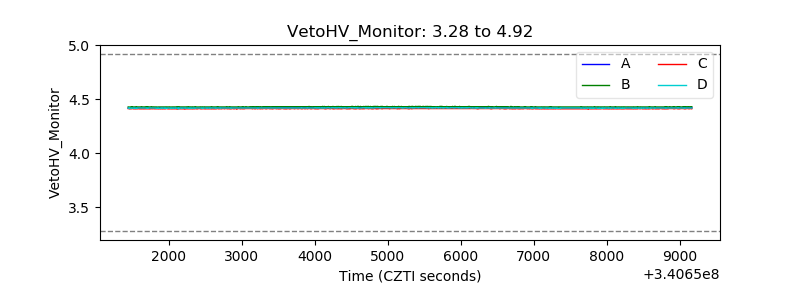 |
| Veto LLD | 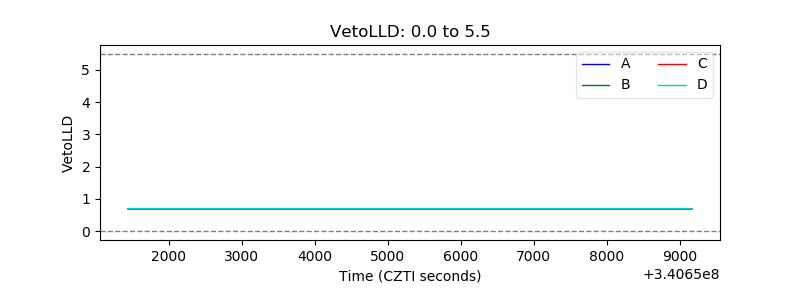 |
| Alpha Counter | 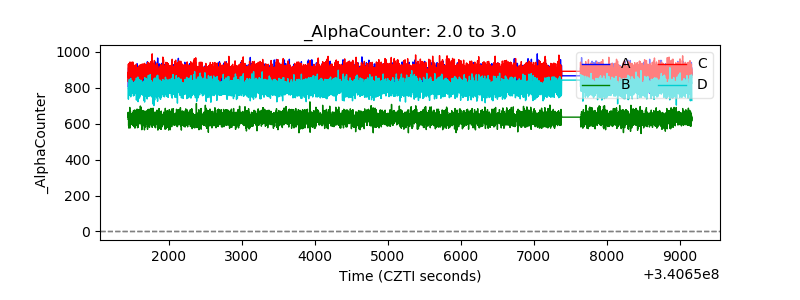 |
| _CPM_Rate | 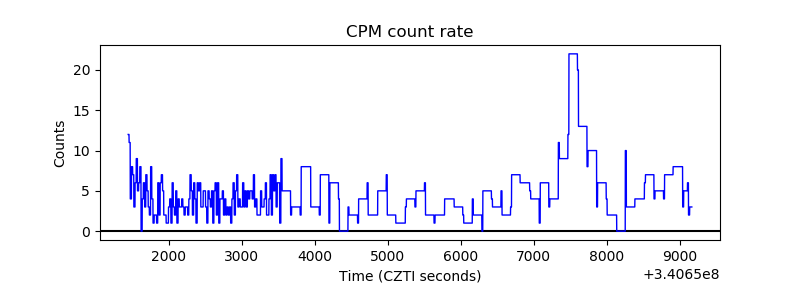 |
| CZT Counter | 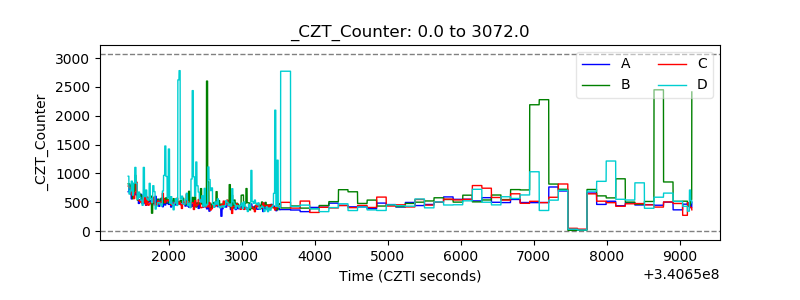 |
| +2.5 Volts monitor |  |
| +5 Volts monitor |  |
| _ROLL_ROT | 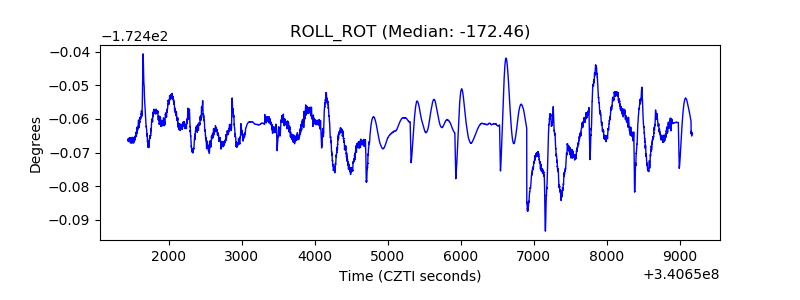 |
| _Roll_DEC | 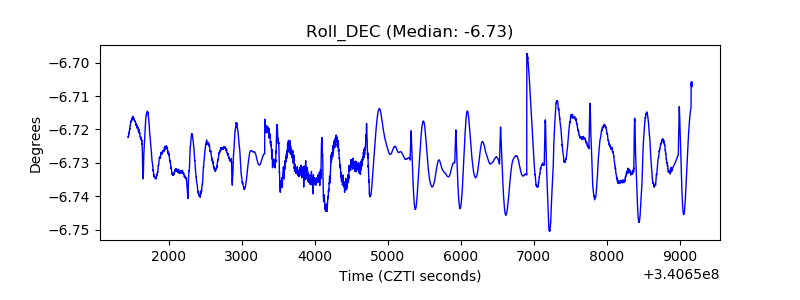 |
| _Roll_RA | 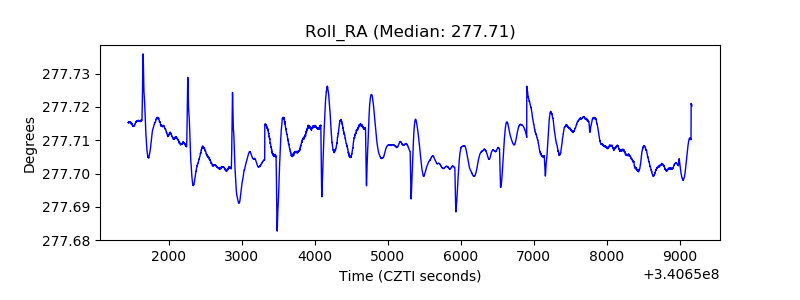 |
| Veto Counter |  |