| Param | Original file | Final file |
|---|---|---|
| Filename | modeM0/AS1T03_255T01_9000003922_27334cztM0_level2.evt | modeM0/AS1T03_255T01_9000003922_27334cztM0_level2_quad_clean.evt |
| Size (bytes) | 629,628,480 | 100,854,720 |
| Size | 600.5 MB | 96.2 MB |
| Events in quadrant A | 3,896,135 | 661,792 |
| Events in quadrant B | 5,884,674 | 618,760 |
| Events in quadrant C | 3,836,926 | 626,844 |
| Events in quadrant D | 4,932,315 | 614,646 |
| Mode M9 | |||
|---|---|---|---|
| Quadrant | BADHDUFLAG | Total packets | Discarded packets |
| A | 0 | 6 | 0 |
| B | 0 | 6 | 0 |
| C | 0 | 6 | 0 |
| D | 0 | 6 | 0 |
| Mode M0 | |||
|---|---|---|---|
| Quadrant | BADHDUFLAG | Total packets | Discarded packets |
| A | 0 | 16567 | 0 |
| B | 0 | 22395 | 0 |
| C | 0 | 16265 | 0 |
| D | 0 | 19752 | 0 |
| Quadrant | Total seconds | Saturated seconds | Saturation percentage |
|---|---|---|---|
| A | 7642 | 68 | 0.889819% |
| B | 7643 | 784 | 10.257752% |
| C | 7643 | 116 | 1.517729% |
| D | 7643 | 305 | 3.990580% |
Noise dominated data is calculated using 1-second bins in cleaned event files. If a bin has >2000 counts, and if more than 50% of those come from <1% of pixels, then it is considered to be noise-dominated and hence unusable.
| Quadrant | # 1 sec bins | Bins with >0 counts | Bins with >2000 counts | High rate bins dominated by noise | Noise dominated (total time) | Noise dominated (detector-on time) | Marked lightcurve |
|---|---|---|---|---|---|---|---|
| A | 8287 | 7644 | 20 | 20 | 0.24% | 0.26% | 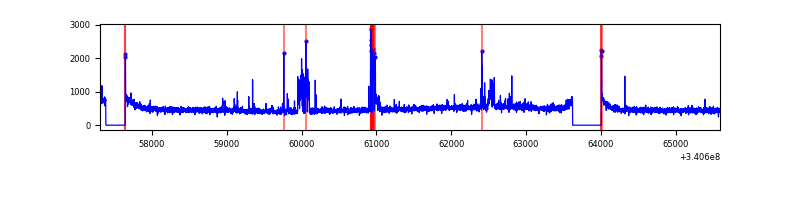 |
| B | 8288 | 7645 | 491 | 491 | 5.92% | 6.42% | 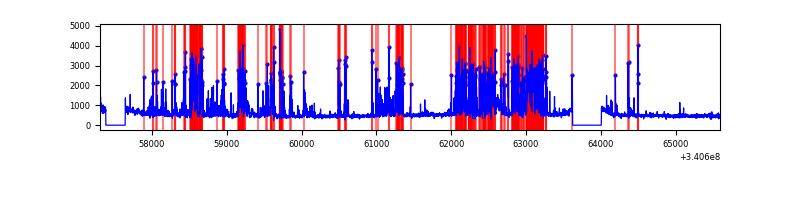 |
| C | 8288 | 7645 | 35 | 35 | 0.42% | 0.46% | 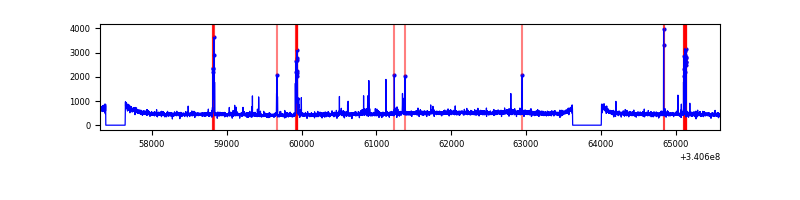 |
| D | 8287 | 7644 | 271 | 271 | 3.27% | 3.55% | 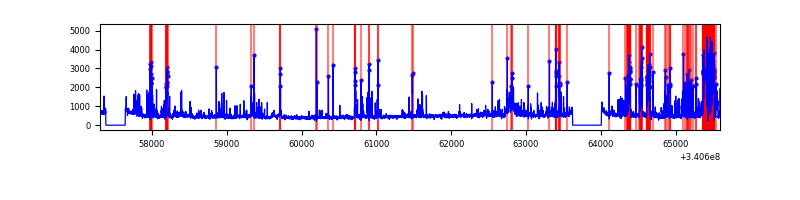 |
Top three noisy pixels from each quadrant. If the there are fewer than three noisy pixels in the level2.evt file, extra rows are filled as -1
| Pixel properties | Quadrant properties | ||||||
|---|---|---|---|---|---|---|---|
| Quadrant | DetID | PixID | Counts | Sigma | Mean | Median | Sigma |
| A | 15 | 174 | 245387 | 1291.7 | 938 | 919 | 189.3 |
| A | 8 | 192 | 15554 | 77.33 | 938 | 919 | 189.3 |
| A | 13 | 254 | 13362 | 65.75 | 938 | 919 | 189.3 |
| B | 3 | 64 | 1788323 | 10341.67 | 897 | 874 | 172.8 |
| B | 5 | 172 | 412200 | 2379.82 | 897 | 874 | 172.8 |
| B | 7 | 205 | 122529 | 703.86 | 897 | 874 | 172.8 |
| C | 15 | 208 | 170630 | 802.8 | 892 | 895 | 211.4 |
| C | 14 | 238 | 140812 | 661.77 | 892 | 895 | 211.4 |
| C | 2 | 16 | 42812 | 198.26 | 892 | 895 | 211.4 |
| D | 1 | 52 | 684405 | 2935.39 | 882 | 863 | 232.9 |
| D | 2 | 250 | 396265 | 1698.01 | 882 | 863 | 232.9 |
| D | 12 | 233 | 247211 | 1057.91 | 882 | 863 | 232.9 |
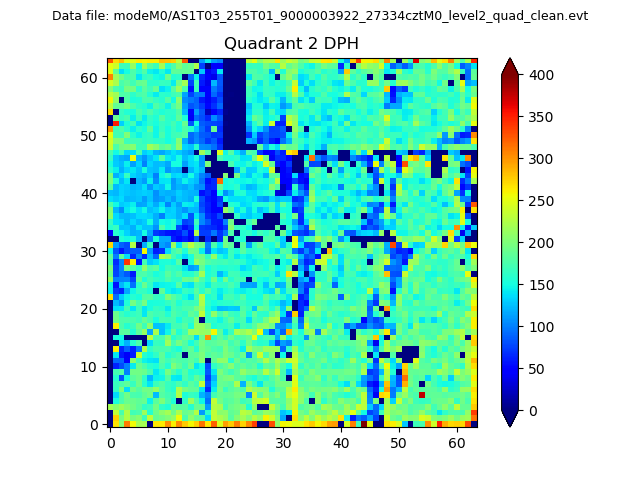
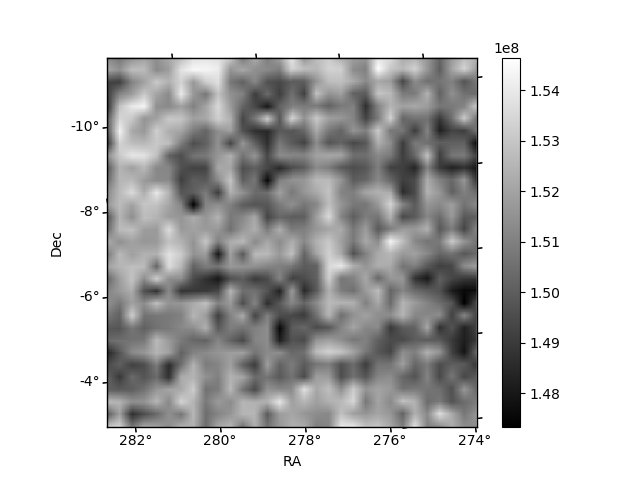
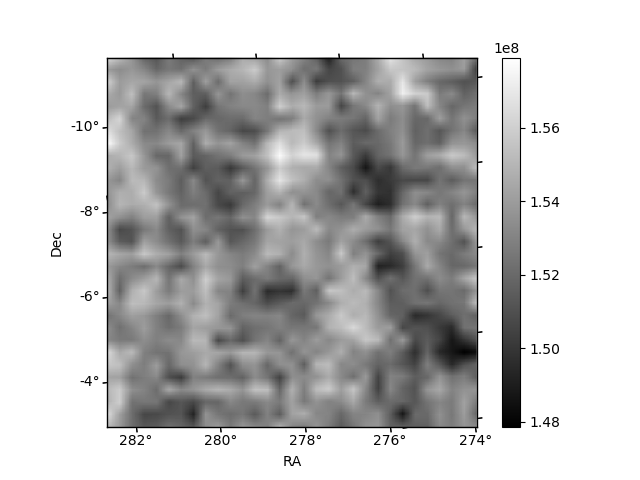
Histogram calculated using DETX and DETY for each event in the final _common_clean file
| Quadrant A | 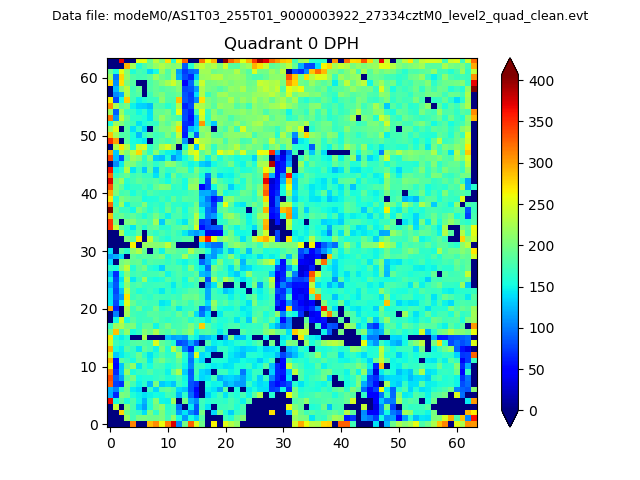 |
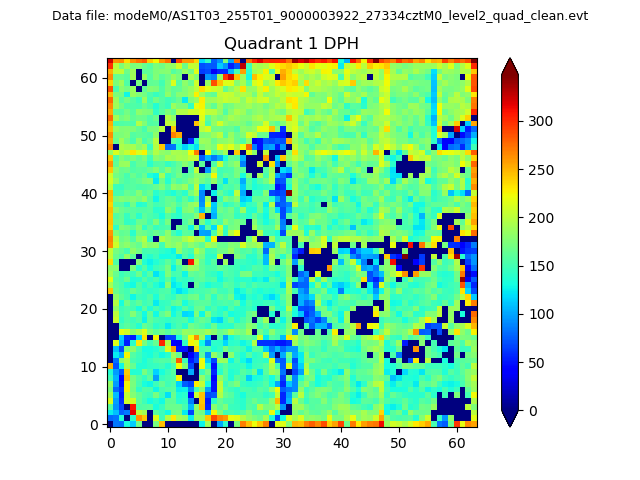 |
Quadrant B |
|---|---|---|---|
| Quadrant D | 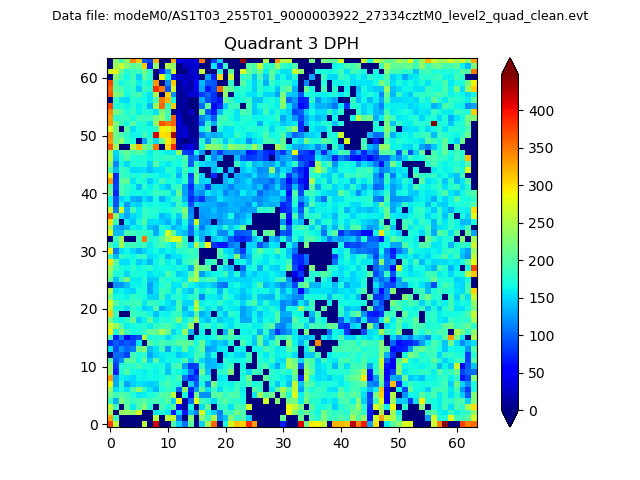 |
 |
Quadrant C |
| Plot type | Count rate plots | Images |
|---|---|---|
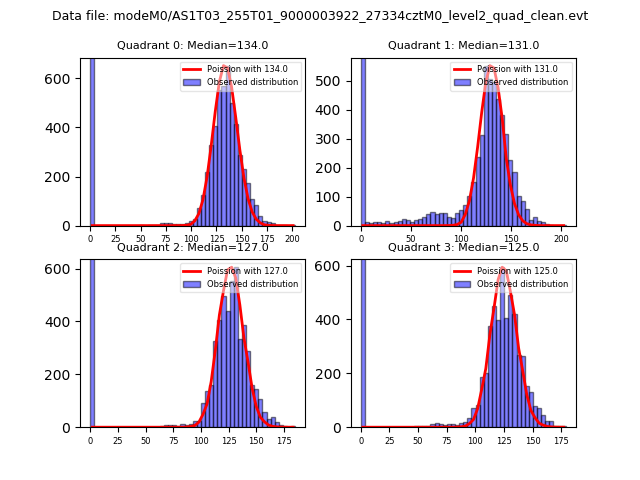
| Comparison with Poisson distribution Blue bars denote a histogram of data divided into 1 sec bins. Red curve is a Poisson curve with rate = median count rate of data. |
 |
 |
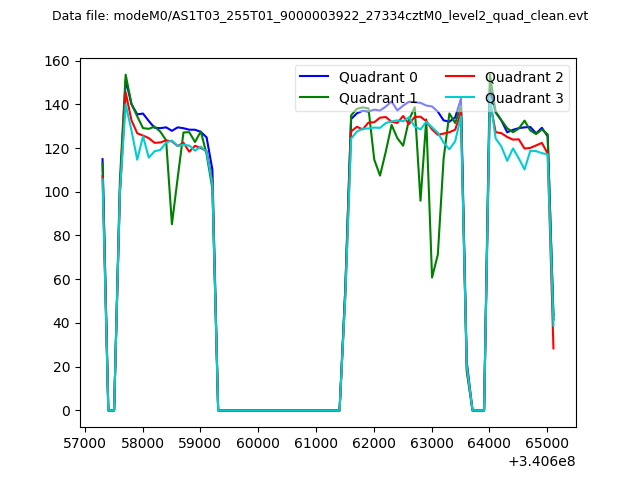
| Quadrant-wise count rates Data is divided into 100 sec bins |
 |
|
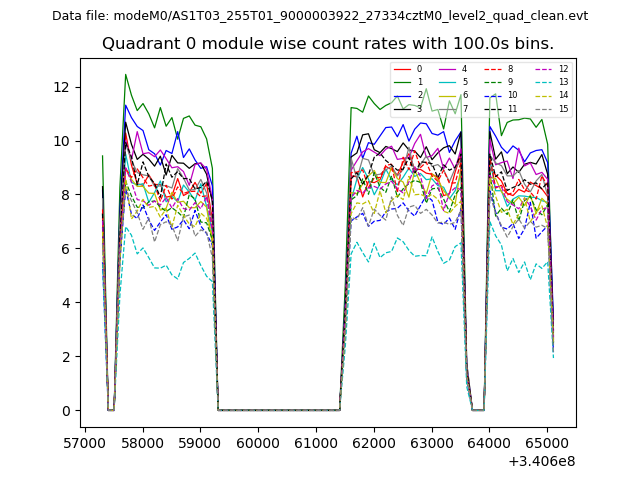
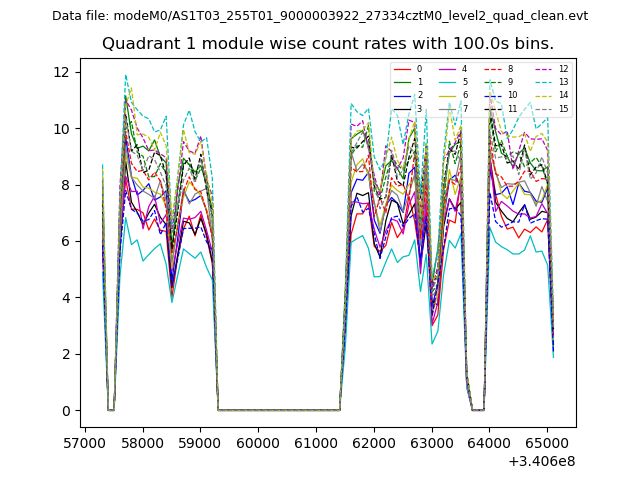
| Module-wise count rates for Quadrant A Data is divided into 100 sec bins |
 |
 |
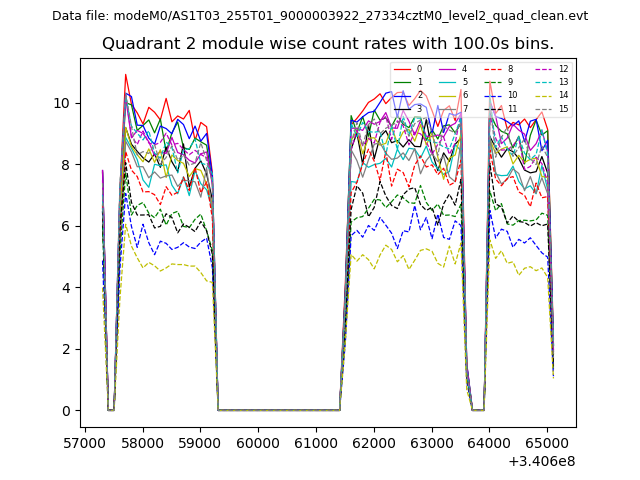
| Module-wise count rates for Quadrant B Data is divided into 100 sec bins |
 |
 |
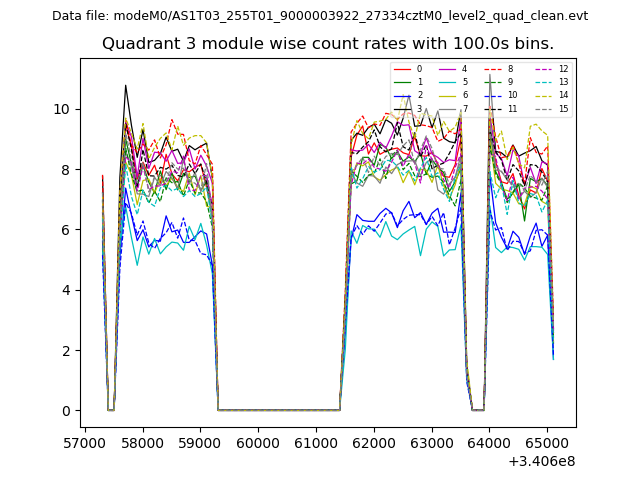
| Module-wise count rates for Quadrant C Data is divided into 100 sec bins |
 |
 |
| Module-wise count rates for Quadrant D Data is divided into 100 sec bins |
 |
 |
| Parameter | Plot |
|---|---|
| CZT HV Monitor | 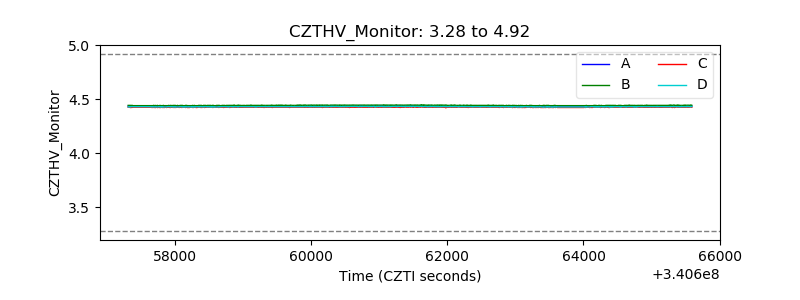 |
| D_VDD | 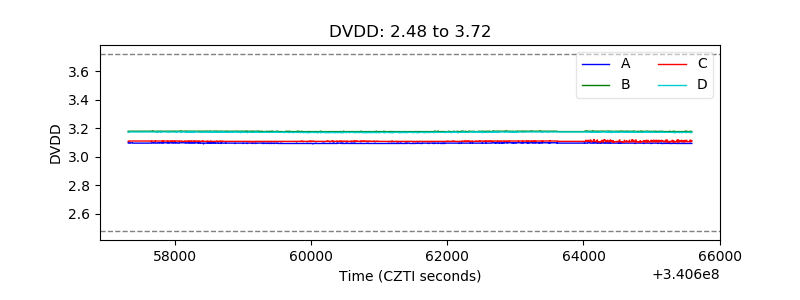 |
| Temperature 1 |  |
| Veto HV Monitor | 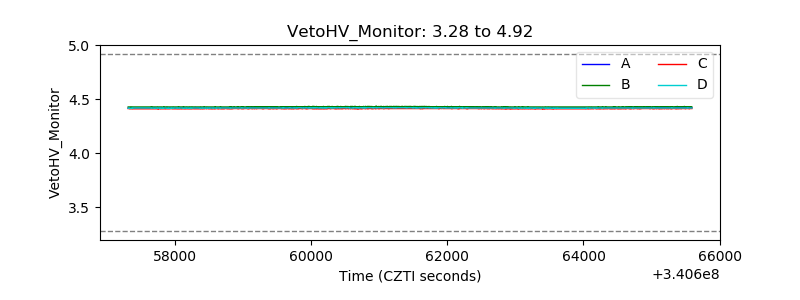 |
| Veto LLD | 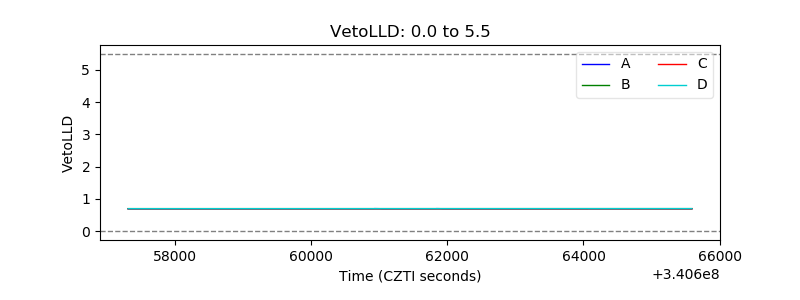 |
| Alpha Counter | 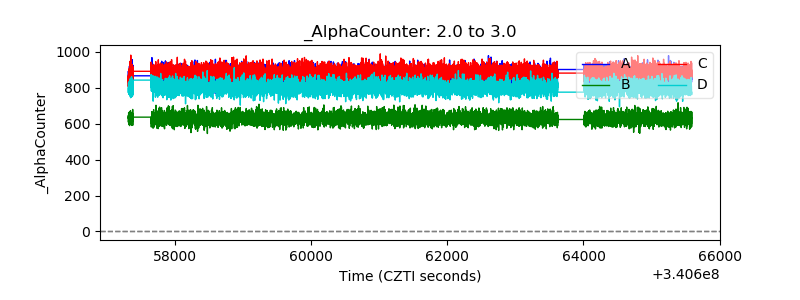 |
| _CPM_Rate | 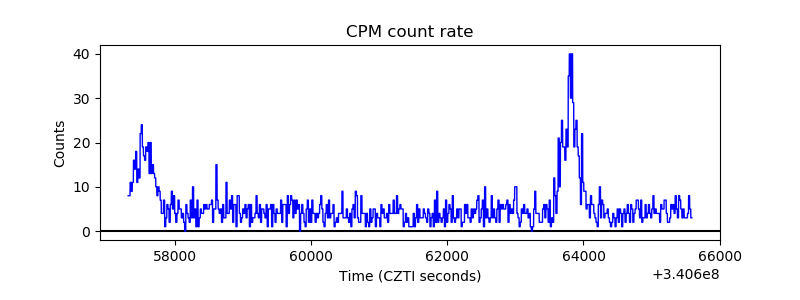 |
| CZT Counter | 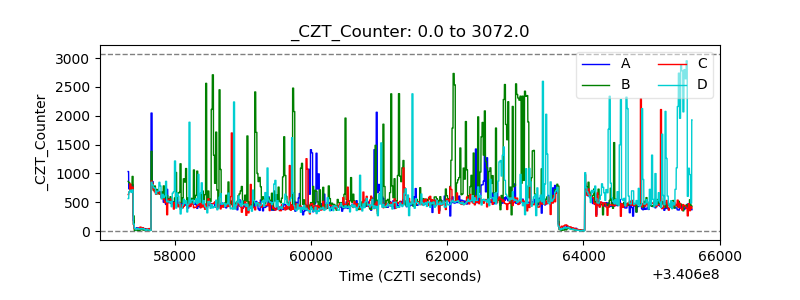 |
| +2.5 Volts monitor |  |
| +5 Volts monitor |  |
| _ROLL_ROT | 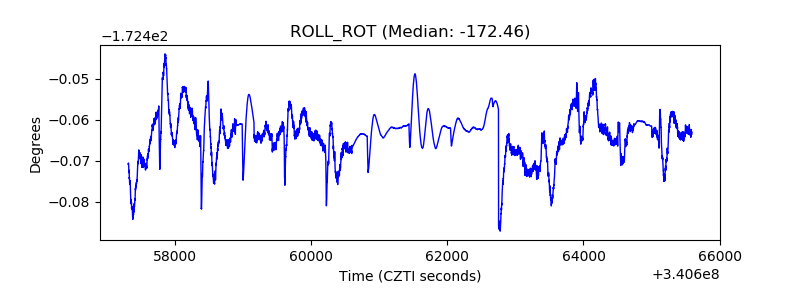 |
| _Roll_DEC |  |
| _Roll_RA | 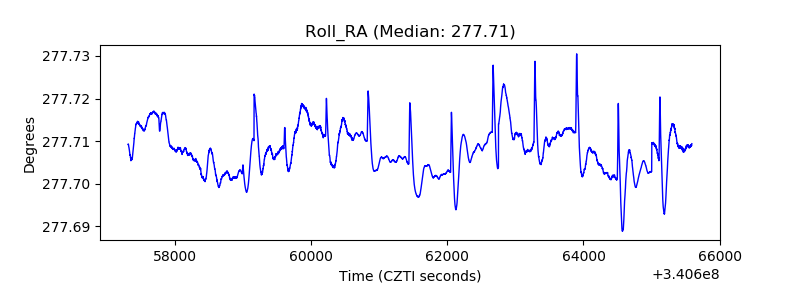 |
| Veto Counter | 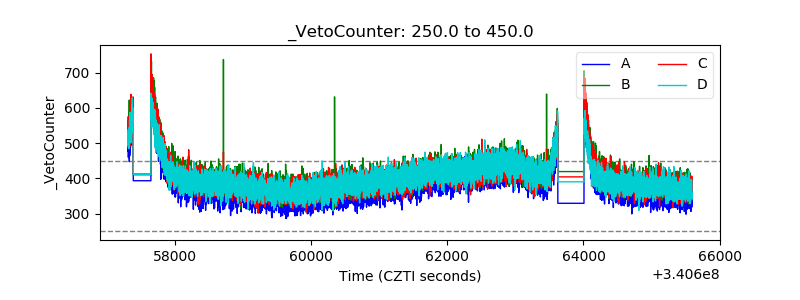 |