| Param | Original file | Final file |
|---|---|---|
| Filename | modeM0/AS1T03_255T01_9000003922_27337cztM0_level2.evt | modeM0/AS1T03_255T01_9000003922_27337cztM0_level2_quad_clean.evt |
| Size (bytes) | 1,444,046,400 | 212,135,040 |
| Size | 1.3 GB | 202.3 MB |
| Events in quadrant A | 8,901,929 | 1,337,731 |
| Events in quadrant B | 10,289,743 | 1,311,449 |
| Events in quadrant C | 10,422,408 | 1,269,864 |
| Events in quadrant D | 12,883,800 | 1,244,888 |
| Mode M9 | |||
|---|---|---|---|
| Quadrant | BADHDUFLAG | Total packets | Discarded packets |
| A | 0 | 20 | 0 |
| B | 0 | 21 | 0 |
| C | 0 | 21 | 0 |
| D | 0 | 21 | 0 |
| Mode M0 | |||
|---|---|---|---|
| Quadrant | BADHDUFLAG | Total packets | Discarded packets |
| A | 0 | 37949 | 0 |
| B | 0 | 41567 | 0 |
| C | 0 | 42609 | 0 |
| D | 0 | 50385 | 0 |
| Quadrant | Total seconds | Saturated seconds | Saturation percentage |
|---|---|---|---|
| A | 18290 | 141 | 0.770913% |
| B | 18290 | 580 | 3.171132% |
| C | 18290 | 522 | 2.854019% |
| D | 18289 | 1495 | 8.174312% |
Noise dominated data is calculated using 1-second bins in cleaned event files. If a bin has >2000 counts, and if more than 50% of those come from <1% of pixels, then it is considered to be noise-dominated and hence unusable.
| Quadrant | # 1 sec bins | Bins with >0 counts | Bins with >2000 counts | High rate bins dominated by noise | Noise dominated (total time) | Noise dominated (detector-on time) | Marked lightcurve |
|---|---|---|---|---|---|---|---|
| A | 20310 | 18293 | 26 | 26 | 0.13% | 0.14% | 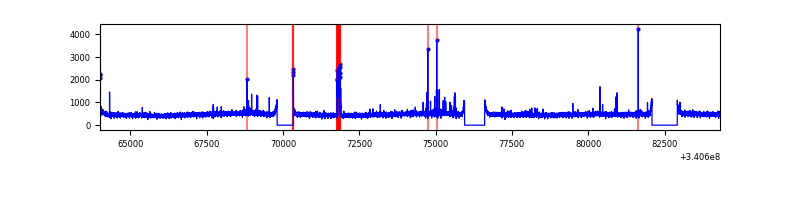 |
| B | 20310 | 18293 | 378 | 378 | 1.86% | 2.07% | 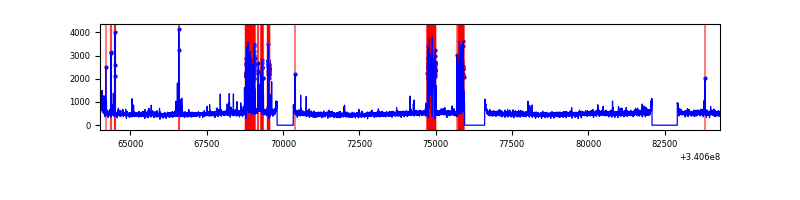 |
| C | 20310 | 18293 | 265 | 265 | 1.30% | 1.45% | 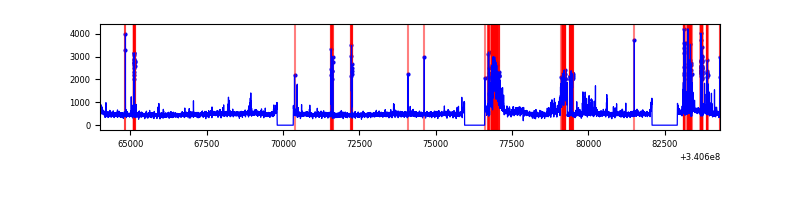 |
| D | 20309 | 18292 | 1343 | 1343 | 6.61% | 7.34% | 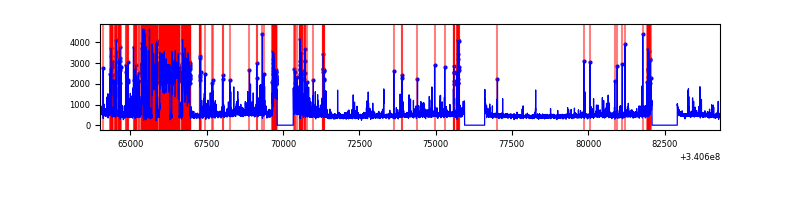 |
Top three noisy pixels from each quadrant. If the there are fewer than three noisy pixels in the level2.evt file, extra rows are filled as -1
| Pixel properties | Quadrant properties | ||||||
|---|---|---|---|---|---|---|---|
| Quadrant | DetID | PixID | Counts | Sigma | Mean | Median | Sigma |
| A | 15 | 174 | 142218 | 310.83 | 2240 | 2194 | 450.5 |
| A | 13 | 248 | 63158 | 135.33 | 2240 | 2194 | 450.5 |
| A | 14 | 235 | 30215 | 62.2 | 2240 | 2194 | 450.5 |
| B | 5 | 172 | 1080971 | 2578.47 | 2201 | 2149 | 418.4 |
| B | 7 | 205 | 246104 | 583.07 | 2201 | 2149 | 418.4 |
| B | 3 | 64 | 192170 | 454.17 | 2201 | 2149 | 418.4 |
| C | 8 | 208 | 1250073 | 2502.12 | 2118 | 2129 | 498.8 |
| C | 2 | 16 | 379335 | 756.3 | 2118 | 2129 | 498.8 |
| C | 14 | 238 | 334004 | 665.41 | 2118 | 2129 | 498.8 |
| D | 1 | 52 | 3829284 | 7449.65 | 2069 | 2020 | 513.8 |
| D | 2 | 250 | 381190 | 738.04 | 2069 | 2020 | 513.8 |
| D | 12 | 233 | 330843 | 640.04 | 2069 | 2020 | 513.8 |
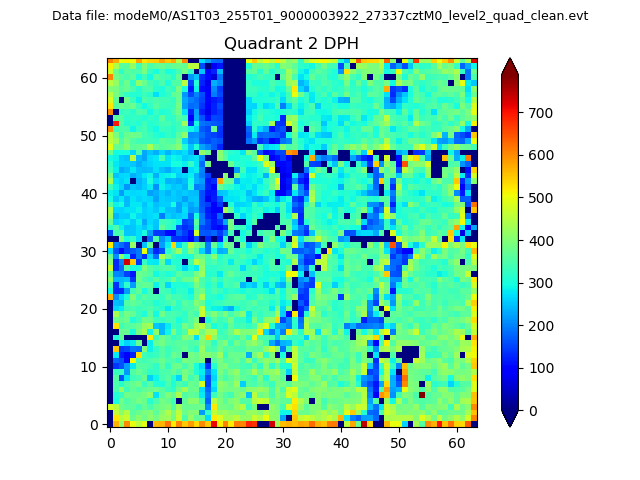
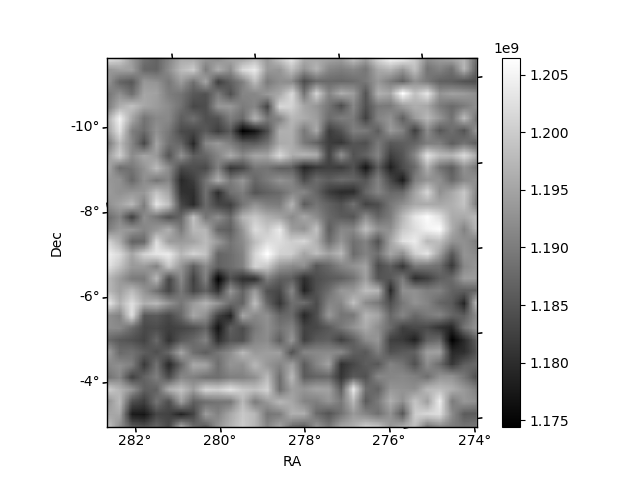
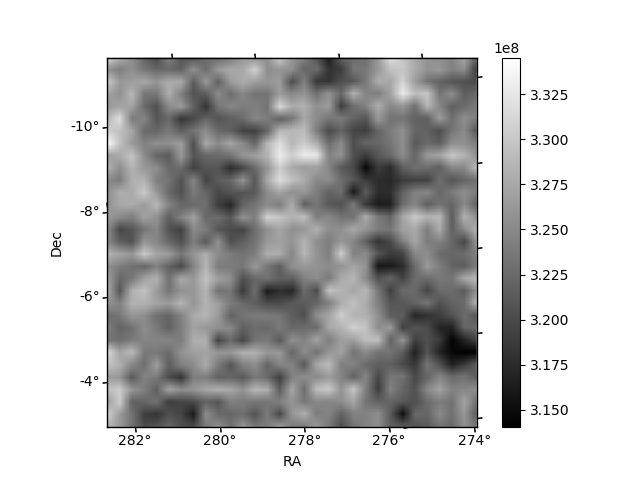
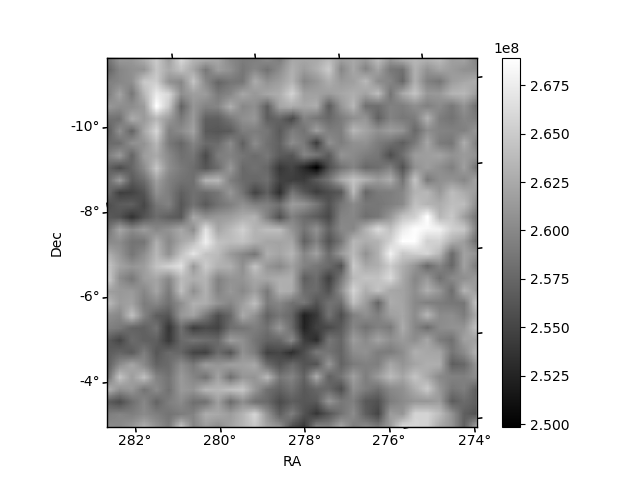
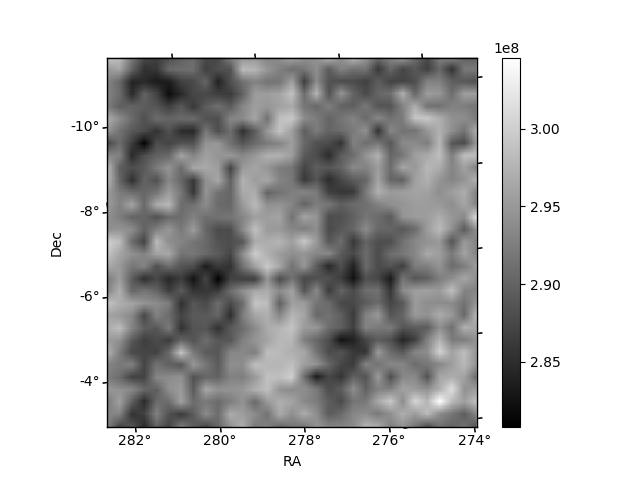
Histogram calculated using DETX and DETY for each event in the final _common_clean file
| Quadrant A | 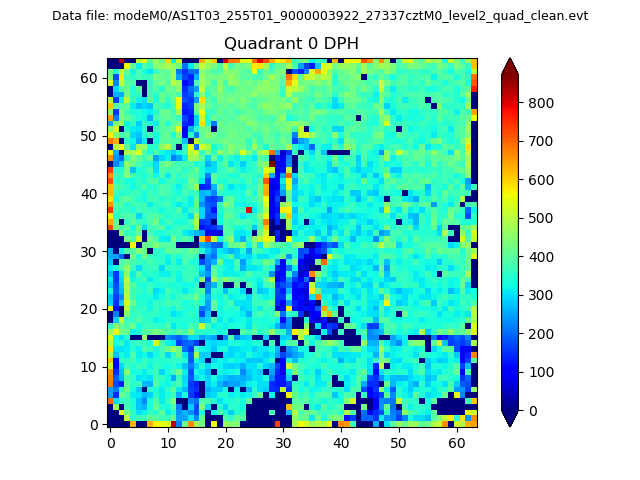 |
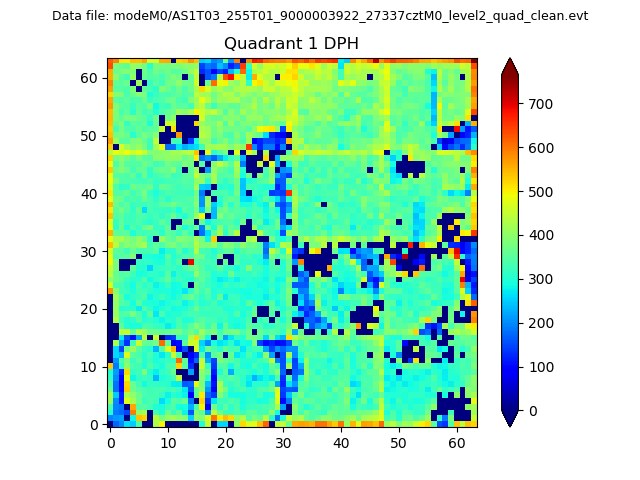 |
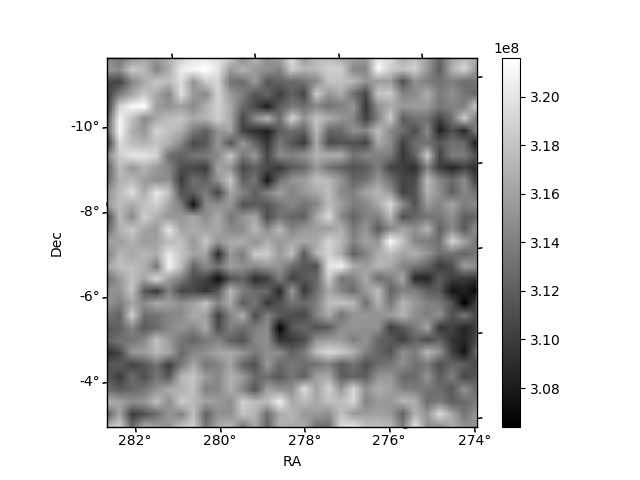
Quadrant B |
|---|---|---|---|
| Quadrant D | 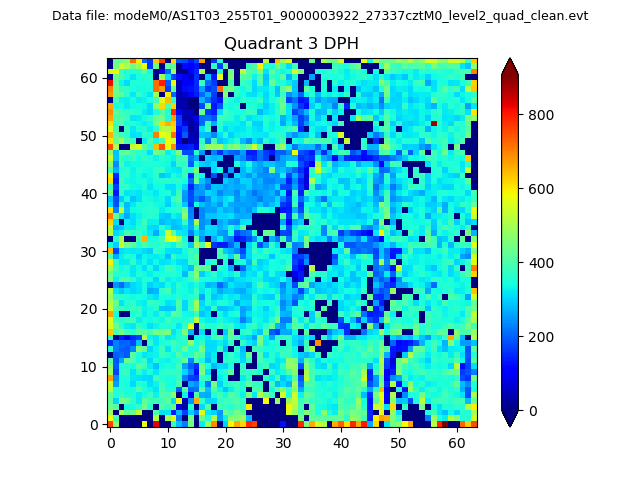 |
 |
Quadrant C |
| Plot type | Count rate plots | Images |
|---|---|---|
| Comparison with Poisson distribution Blue bars denote a histogram of data divided into 1 sec bins. Red curve is a Poisson curve with rate = median count rate of data. |
 |
 |
| Quadrant-wise count rates Data is divided into 100 sec bins |
 |
|
| Module-wise count rates for Quadrant A Data is divided into 100 sec bins |
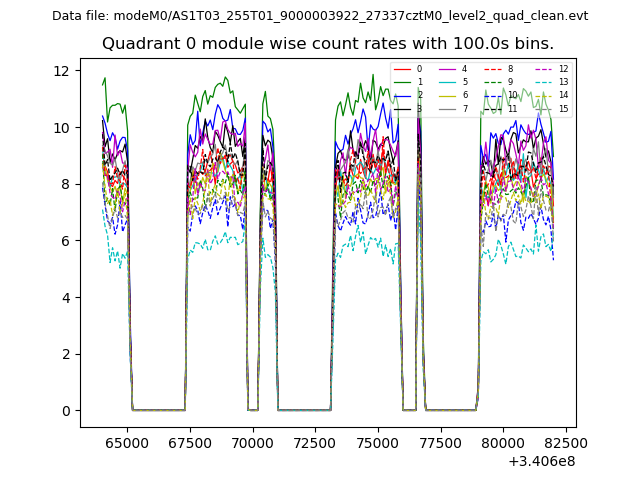 |
 |
| Module-wise count rates for Quadrant B Data is divided into 100 sec bins |
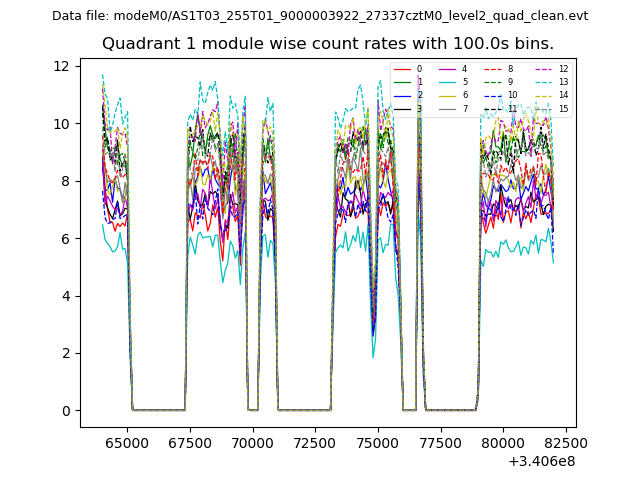 |
 |
| Module-wise count rates for Quadrant C Data is divided into 100 sec bins |
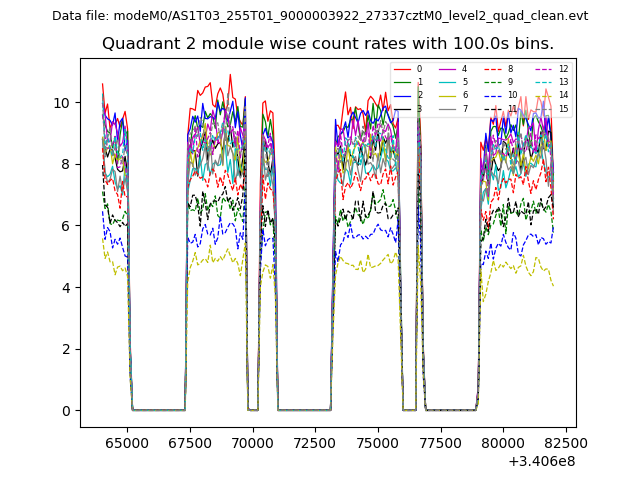 |
 |
| Module-wise count rates for Quadrant D Data is divided into 100 sec bins |
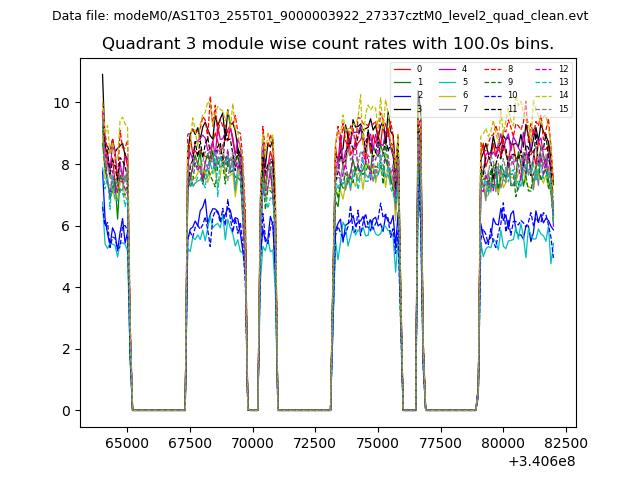 |
 |
| Parameter | Plot |
|---|---|
| CZT HV Monitor | 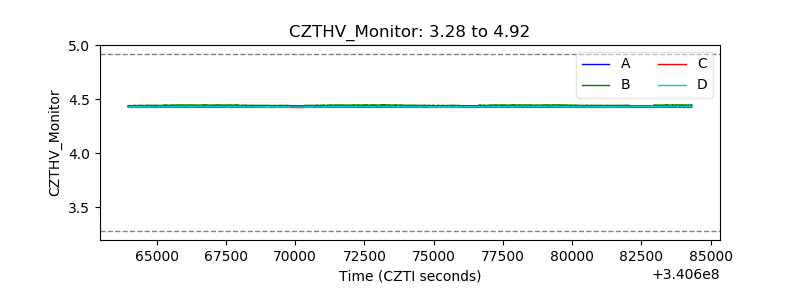 |
| D_VDD | 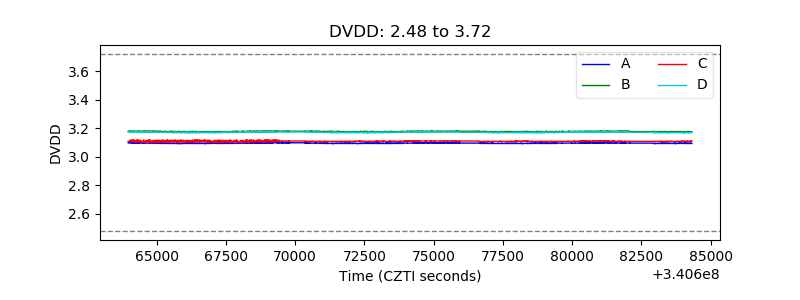 |
| Temperature 1 | 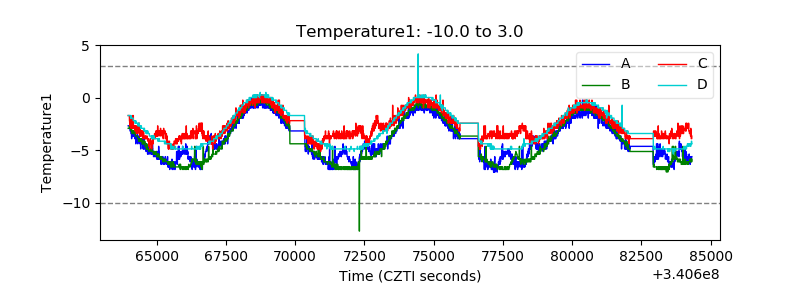 |
| Veto HV Monitor | 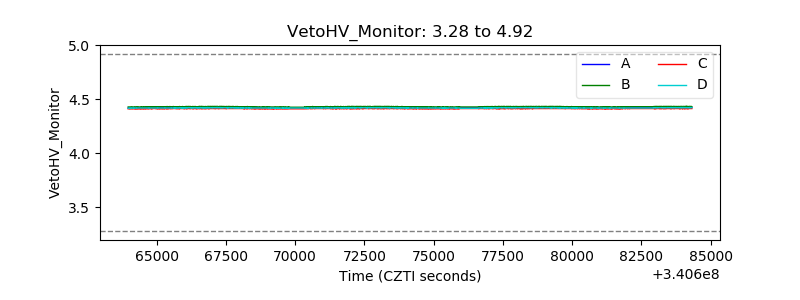 |
| Veto LLD | 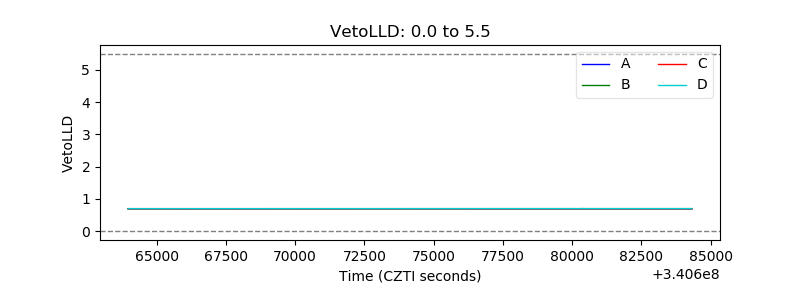 |
| Alpha Counter |  |
| _CPM_Rate | 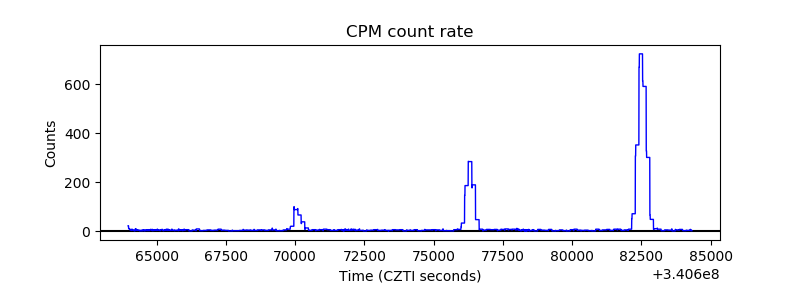 |
| CZT Counter | 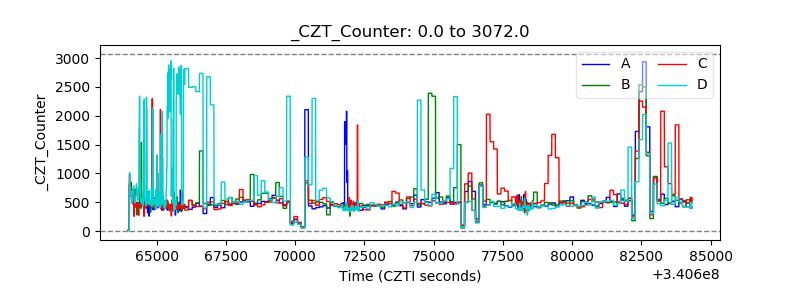 |
| +2.5 Volts monitor |  |
| +5 Volts monitor |  |
| _ROLL_ROT | 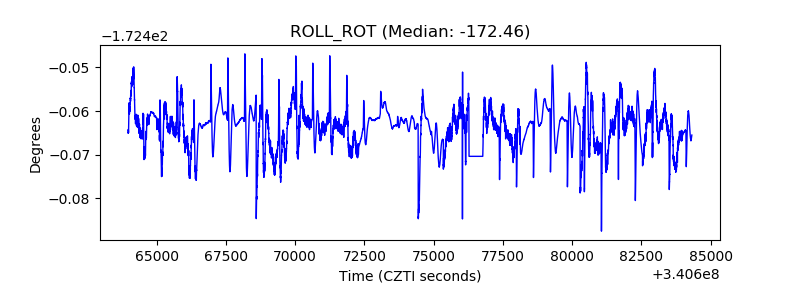 |
| _Roll_DEC | 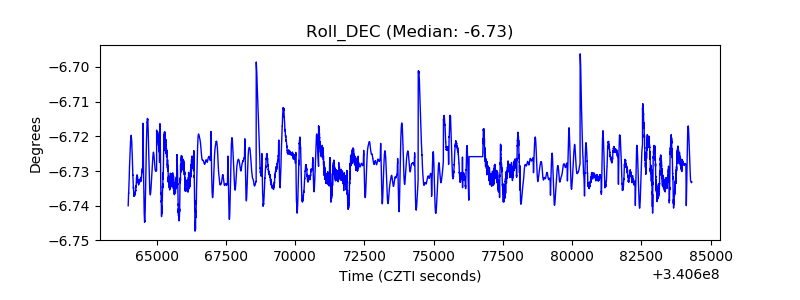 |
| _Roll_RA | 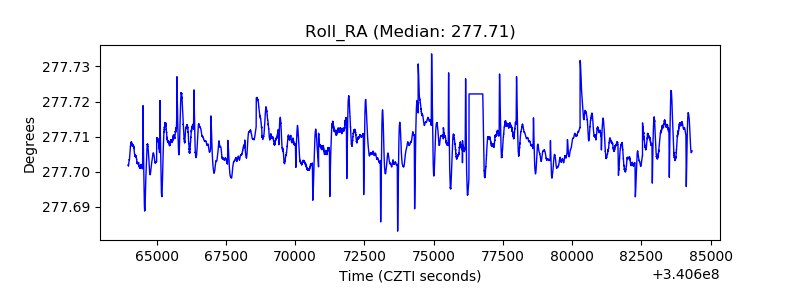 |
| Veto Counter | 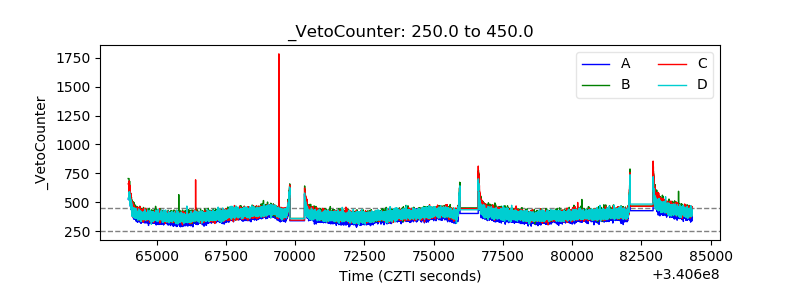 |