| Param | Original file | Final file |
|---|---|---|
| Filename | modeM0/AS1T03_255T01_9000003922_27338cztM0_level2.evt | modeM0/AS1T03_255T01_9000003922_27338cztM0_level2_quad_clean.evt |
| Size (bytes) | 547,925,760 | 71,017,920 |
| Size | 522.5 MB | 67.7 MB |
| Events in quadrant A | 3,303,231 | 442,913 |
| Events in quadrant B | 3,499,702 | 443,977 |
| Events in quadrant C | 5,418,262 | 391,826 |
| Events in quadrant D | 3,922,157 | 408,114 |
| Mode M9 | |||
|---|---|---|---|
| Quadrant | BADHDUFLAG | Total packets | Discarded packets |
| A | 0 | 18 | 0 |
| B | 0 | 18 | 0 |
| C | 0 | 18 | 0 |
| D | 0 | 18 | 0 |
| Mode M0 | |||
|---|---|---|---|
| Quadrant | BADHDUFLAG | Total packets | Discarded packets |
| A | 0 | 13801 | 0 |
| B | 0 | 14237 | 0 |
| C | 0 | 20455 | 0 |
| D | 0 | 15821 | 0 |
| Quadrant | Total seconds | Saturated seconds | Saturation percentage |
|---|---|---|---|
| A | 6640 | 46 | 0.692771% |
| B | 6640 | 74 | 1.114458% |
| C | 6640 | 783 | 11.792169% |
| D | 6641 | 132 | 1.987652% |
Noise dominated data is calculated using 1-second bins in cleaned event files. If a bin has >2000 counts, and if more than 50% of those come from <1% of pixels, then it is considered to be noise-dominated and hence unusable.
| Quadrant | # 1 sec bins | Bins with >0 counts | Bins with >2000 counts | High rate bins dominated by noise | Noise dominated (total time) | Noise dominated (detector-on time) | Marked lightcurve |
|---|---|---|---|---|---|---|---|
| A | 8465 | 6642 | 1 | 1 | 0.01% | 0.02% | 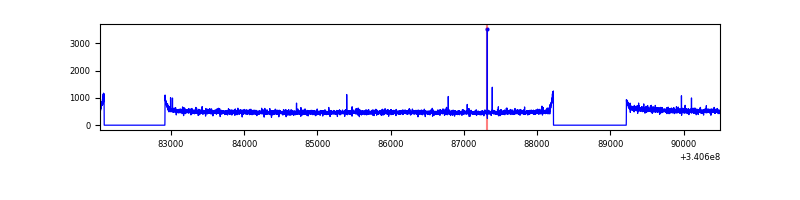 |
| B | 8465 | 6642 | 1 | 1 | 0.01% | 0.02% | 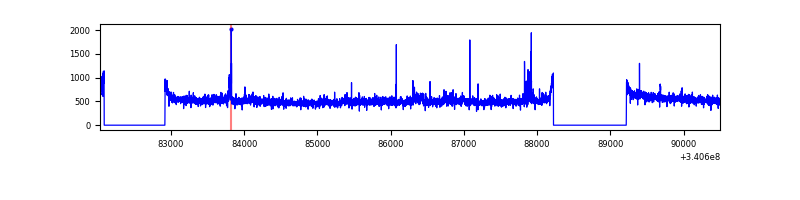 |
| C | 8465 | 6642 | 493 | 493 | 5.82% | 7.42% | 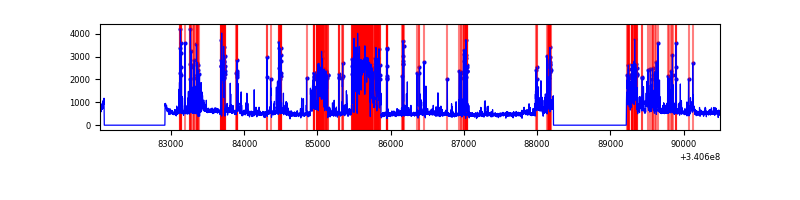 |
| D | 8466 | 6643 | 98 | 98 | 1.16% | 1.48% | 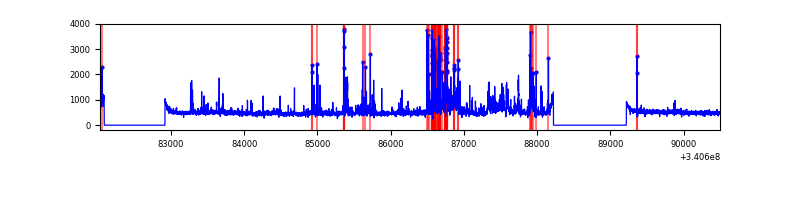 |
Top three noisy pixels from each quadrant. If the there are fewer than three noisy pixels in the level2.evt file, extra rows are filled as -1
| Pixel properties | Quadrant properties | ||||||
|---|---|---|---|---|---|---|---|
| Quadrant | DetID | PixID | Counts | Sigma | Mean | Median | Sigma |
| A | 13 | 254 | 9683 | 51.59 | 852 | 835 | 171.5 |
| A | 3 | 137 | 8125 | 42.51 | 852 | 835 | 171.5 |
| A | 13 | 248 | 7457 | 38.61 | 852 | 835 | 171.5 |
| B | 7 | 205 | 86561 | 525.71 | 848 | 827 | 163.1 |
| B | 10 | 245 | 35317 | 211.49 | 848 | 827 | 163.1 |
| B | 12 | 111 | 19774 | 116.18 | 848 | 827 | 163.1 |
| C | 8 | 208 | 1354382 | 7398.17 | 776 | 779 | 183.0 |
| C | 2 | 16 | 910713 | 4973.28 | 776 | 779 | 183.0 |
| C | 14 | 238 | 123669 | 671.66 | 776 | 779 | 183.0 |
| D | 1 | 52 | 649506 | 3281.57 | 808 | 789 | 197.7 |
| D | 2 | 250 | 120849 | 607.33 | 808 | 789 | 197.7 |
| D | 7 | 96 | 27514 | 135.19 | 808 | 789 | 197.7 |
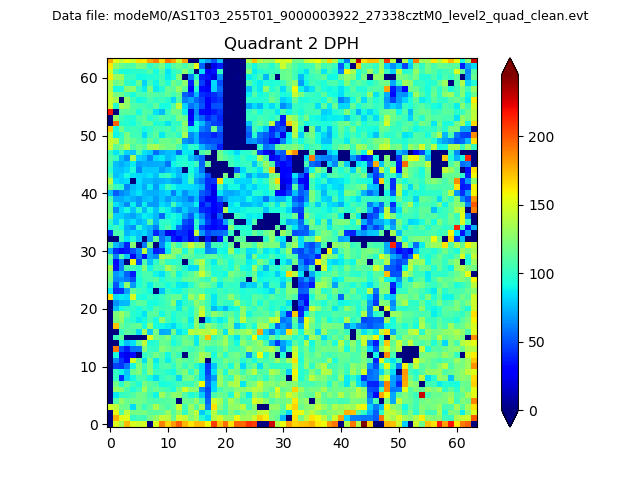
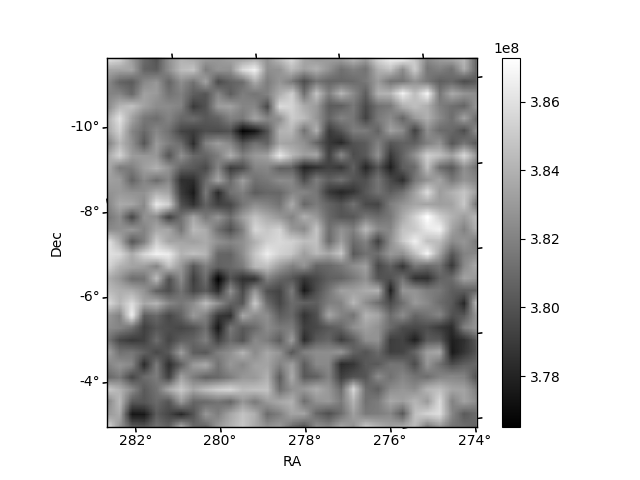
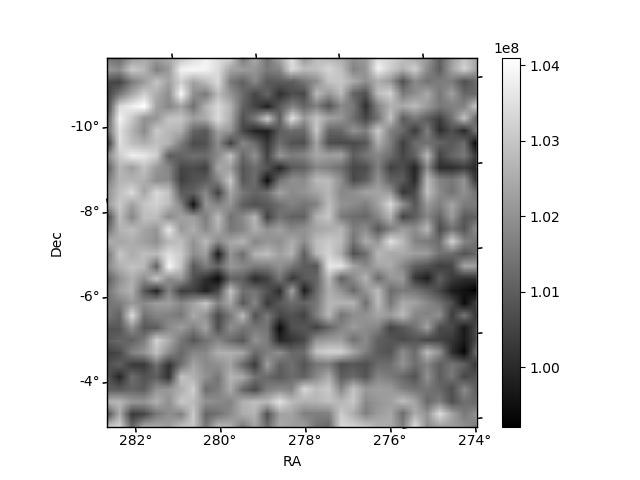
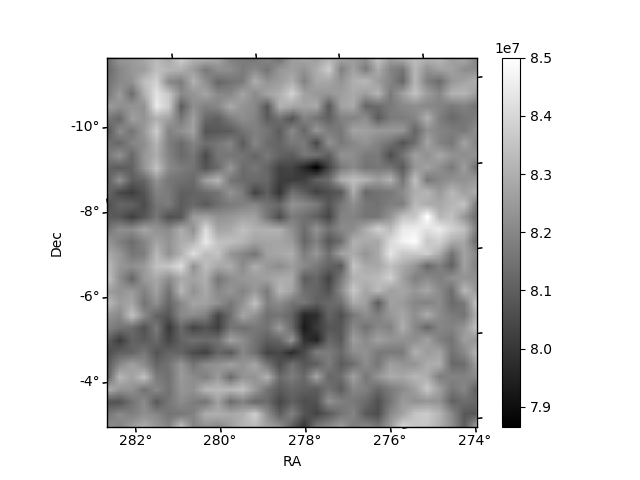
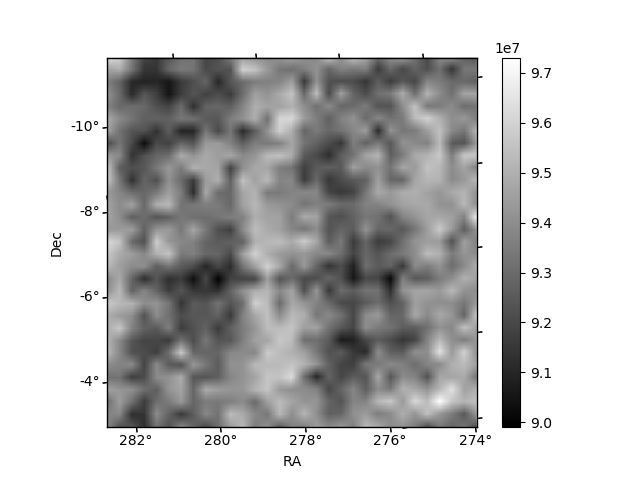
Histogram calculated using DETX and DETY for each event in the final _common_clean file
| Quadrant A | 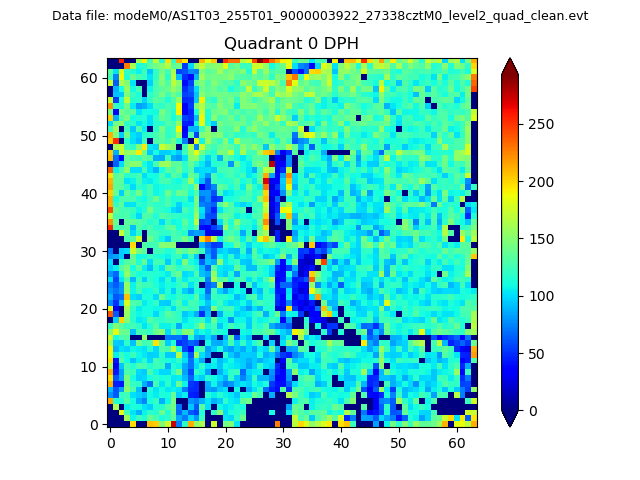 |
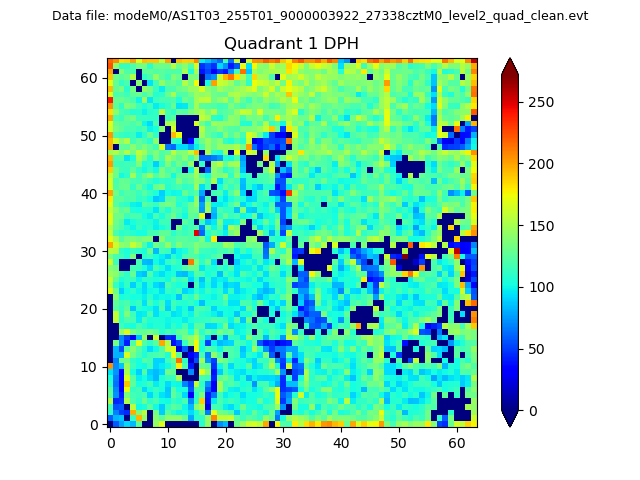 |
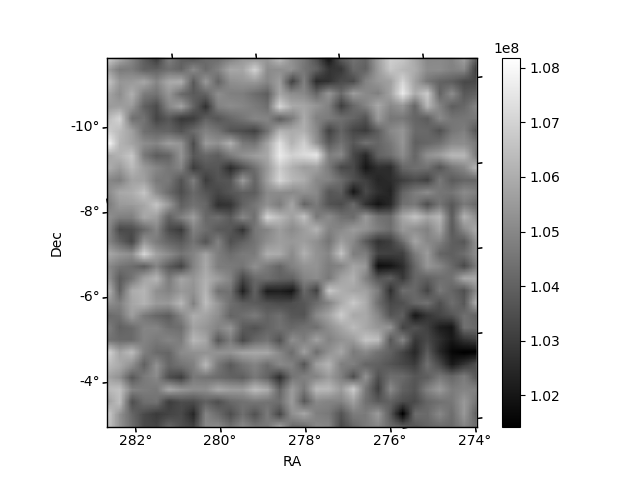
Quadrant B |
|---|---|---|---|
| Quadrant D | 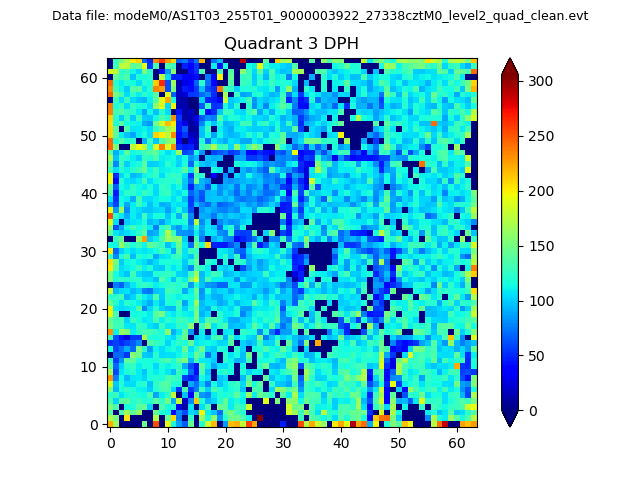 |
 |
Quadrant C |
| Plot type | Count rate plots | Images |
|---|---|---|
| Comparison with Poisson distribution Blue bars denote a histogram of data divided into 1 sec bins. Red curve is a Poisson curve with rate = median count rate of data. |
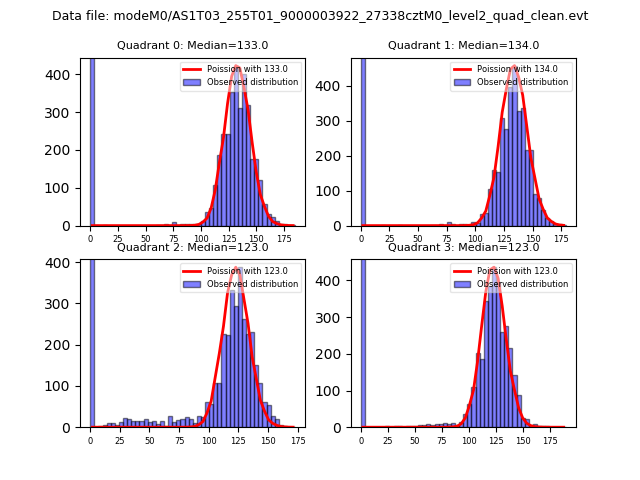 |
 |
| Quadrant-wise count rates Data is divided into 100 sec bins |
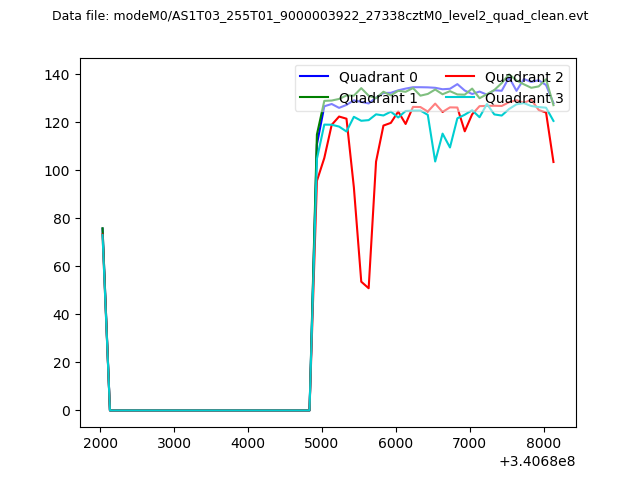 |
|
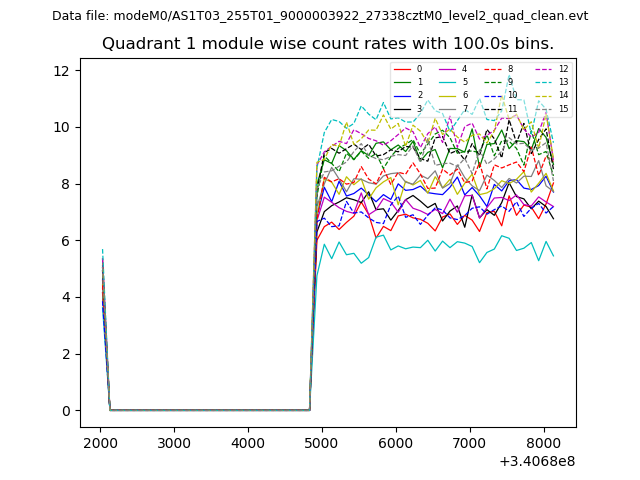
| Module-wise count rates for Quadrant A Data is divided into 100 sec bins |
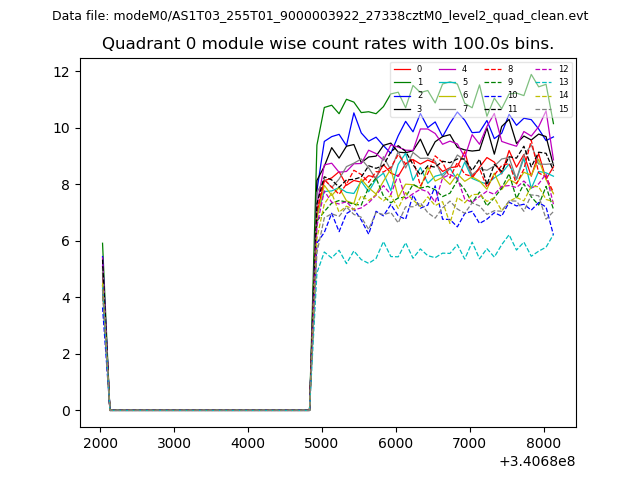 |
 |
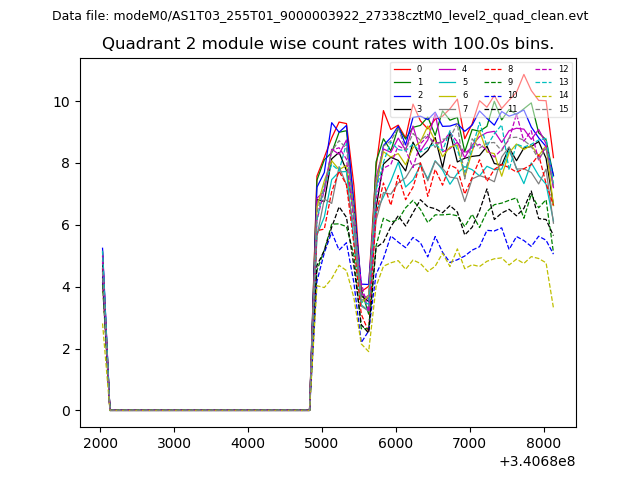
| Module-wise count rates for Quadrant B Data is divided into 100 sec bins |
 |
 |
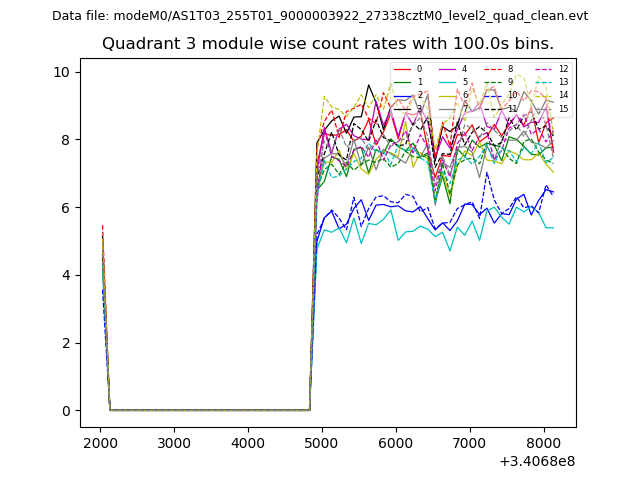
| Module-wise count rates for Quadrant C Data is divided into 100 sec bins |
 |
 |
| Module-wise count rates for Quadrant D Data is divided into 100 sec bins |
 |
 |
| Parameter | Plot |
|---|---|
| CZT HV Monitor | 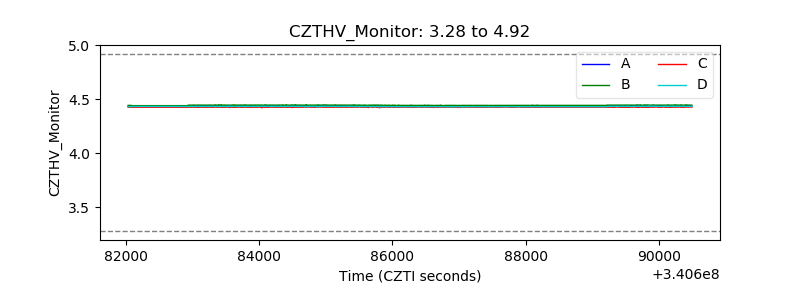 |
| D_VDD | 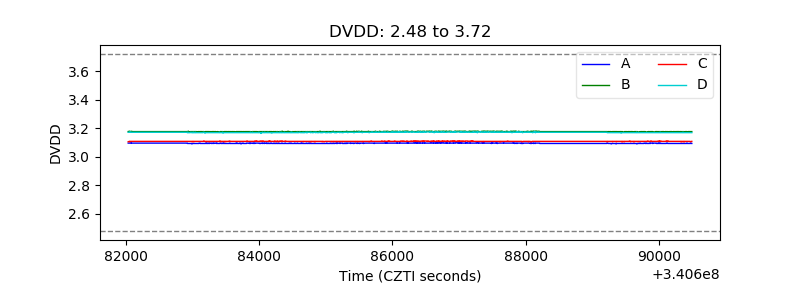 |
| Temperature 1 | 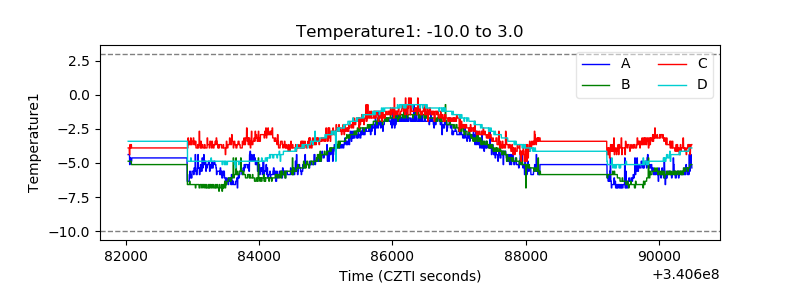 |
| Veto HV Monitor | 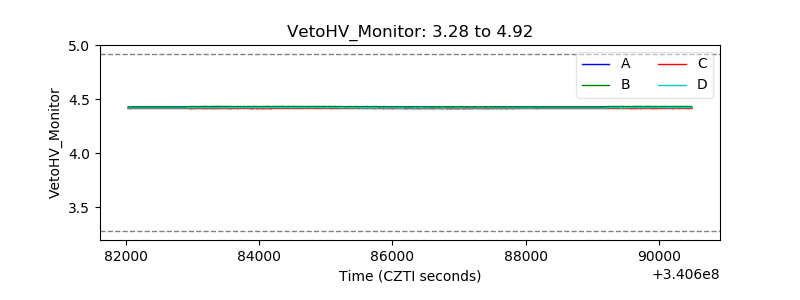 |
| Veto LLD | 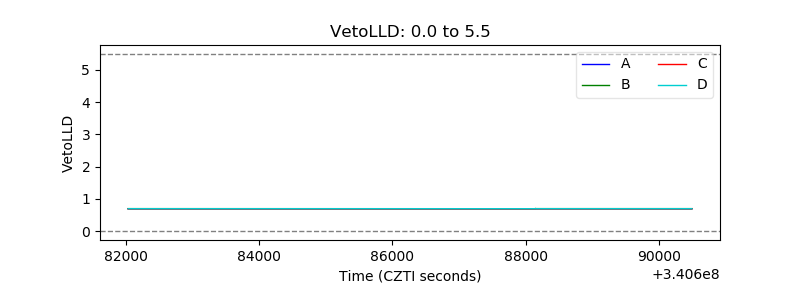 |
| Alpha Counter | 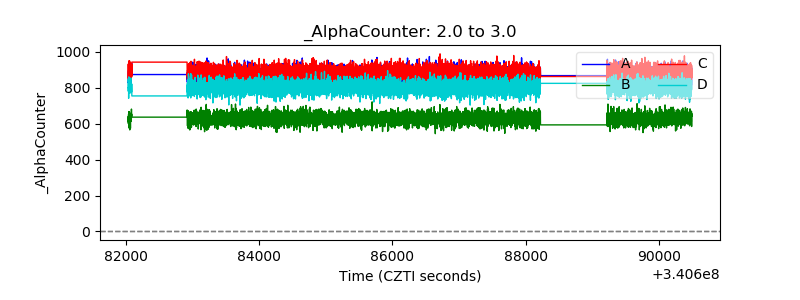 |
| _CPM_Rate | 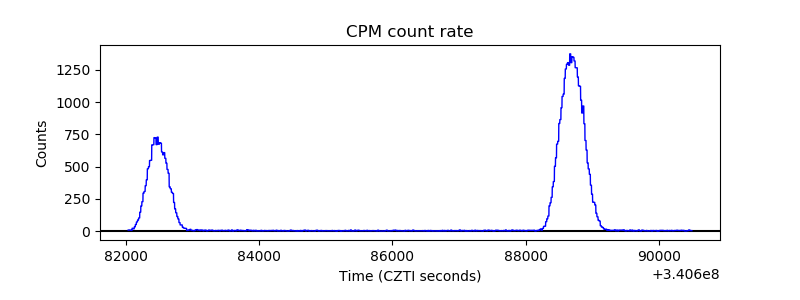 |
| CZT Counter | 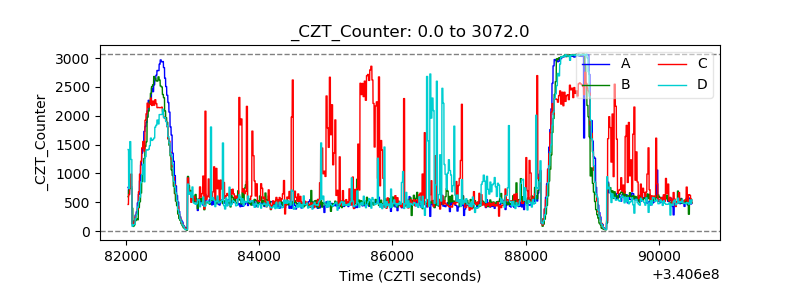 |
| +2.5 Volts monitor |  |
| +5 Volts monitor |  |
| _ROLL_ROT | 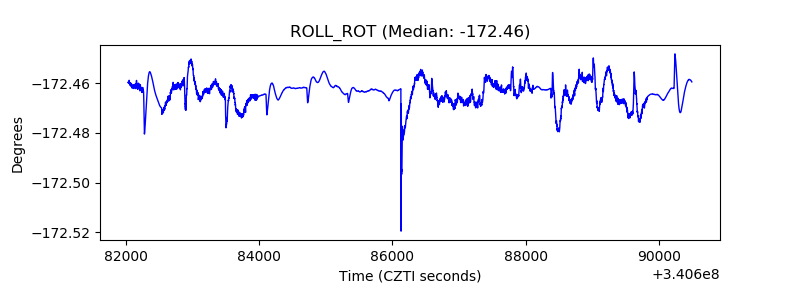 |
| _Roll_DEC | 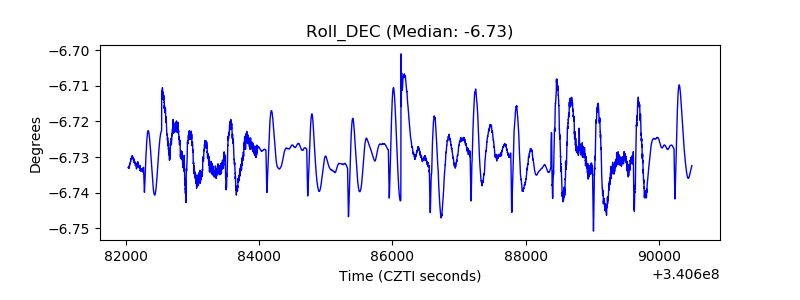 |
| _Roll_RA | 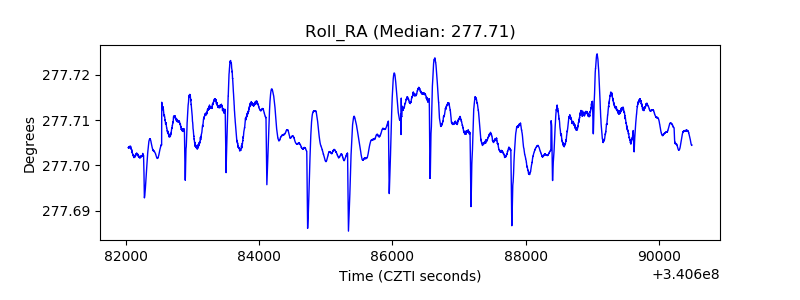 |
| Veto Counter | 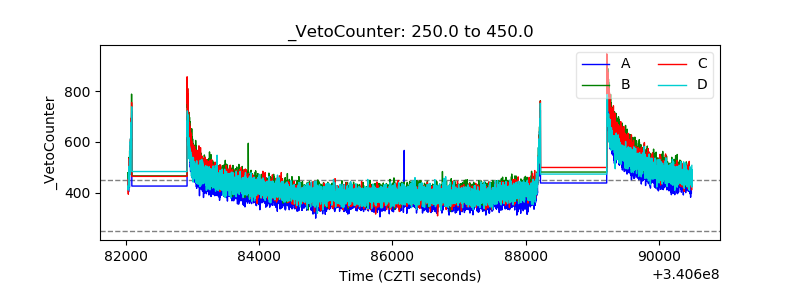 |