| Param | Original file | Final file |
|---|---|---|
| Filename | modeM0/AS1T03_255T01_9000003922_27340cztM0_level2.evt | modeM0/AS1T03_255T01_9000003922_27340cztM0_level2_quad_clean.evt |
| Size (bytes) | 571,196,160 | 79,404,480 |
| Size | 544.7 MB | 75.7 MB |
| Events in quadrant A | 3,330,444 | 512,929 |
| Events in quadrant B | 3,478,540 | 518,310 |
| Events in quadrant C | 6,010,316 | 451,521 |
| Events in quadrant D | 4,045,530 | 474,810 |
| Mode M9 | |||
|---|---|---|---|
| Quadrant | BADHDUFLAG | Total packets | Discarded packets |
| A | 0 | 11 | 0 |
| B | 0 | 11 | 0 |
| C | 0 | 11 | 0 |
| D | 0 | 11 | 0 |
| Mode M0 | |||
|---|---|---|---|
| Quadrant | BADHDUFLAG | Total packets | Discarded packets |
| A | 0 | 13833 | 0 |
| B | 0 | 14130 | 0 |
| C | 0 | 22094 | 0 |
| D | 0 | 16247 | 0 |
| Quadrant | Total seconds | Saturated seconds | Saturation percentage |
|---|---|---|---|
| A | 6402 | 63 | 0.984067% |
| B | 6402 | 73 | 1.140269% |
| C | 6402 | 997 | 15.573258% |
| D | 6402 | 158 | 2.467979% |
Noise dominated data is calculated using 1-second bins in cleaned event files. If a bin has >2000 counts, and if more than 50% of those come from <1% of pixels, then it is considered to be noise-dominated and hence unusable.
| Quadrant | # 1 sec bins | Bins with >0 counts | Bins with >2000 counts | High rate bins dominated by noise | Noise dominated (total time) | Noise dominated (detector-on time) | Marked lightcurve |
|---|---|---|---|---|---|---|---|
| A | 7527 | 6402 | 1 | 1 | 0.01% | 0.02% | 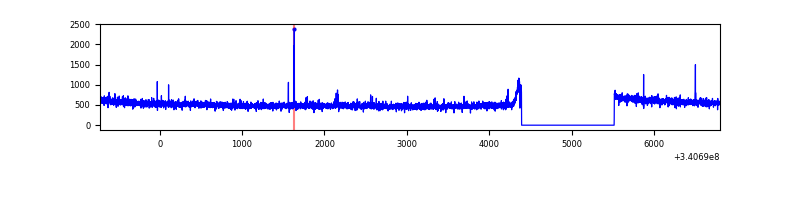 |
| B | 7527 | 6402 | 1 | 1 | 0.01% | 0.02% | 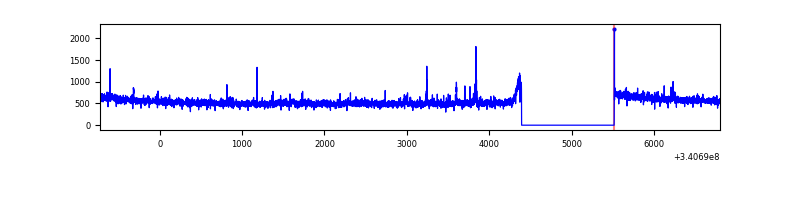 |
| C | 7527 | 6402 | 611 | 611 | 8.12% | 9.54% | 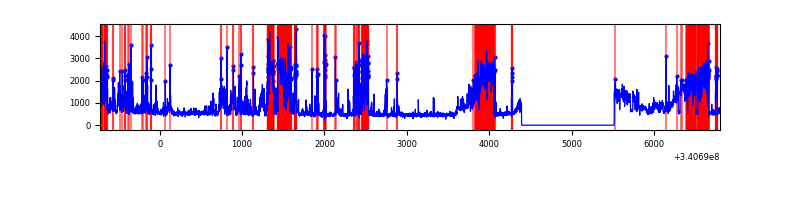 |
| D | 7527 | 6402 | 107 | 107 | 1.42% | 1.67% | 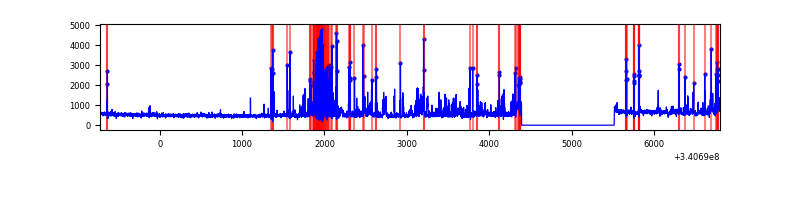 |
Top three noisy pixels from each quadrant. If the there are fewer than three noisy pixels in the level2.evt file, extra rows are filled as -1
| Pixel properties | Quadrant properties | ||||||
|---|---|---|---|---|---|---|---|
| Quadrant | DetID | PixID | Counts | Sigma | Mean | Median | Sigma |
| A | 15 | 174 | 19875 | 111.34 | 856 | 842 | 170.9 |
| A | 13 | 254 | 9896 | 52.97 | 856 | 842 | 170.9 |
| A | 3 | 137 | 7598 | 39.52 | 856 | 842 | 170.9 |
| B | 7 | 205 | 81104 | 498.97 | 850 | 831 | 160.9 |
| B | 0 | 219 | 28680 | 173.11 | 850 | 831 | 160.9 |
| B | 12 | 111 | 19213 | 114.26 | 850 | 831 | 160.9 |
| C | 8 | 208 | 2294714 | 12701.42 | 771 | 775 | 180.6 |
| C | 2 | 16 | 580147 | 3207.95 | 771 | 775 | 180.6 |
| C | 14 | 238 | 123616 | 680.16 | 771 | 775 | 180.6 |
| D | 1 | 52 | 697426 | 3648.84 | 807 | 792 | 190.9 |
| D | 2 | 250 | 163557 | 852.53 | 807 | 792 | 190.9 |
| D | 7 | 96 | 55444 | 286.26 | 807 | 792 | 190.9 |
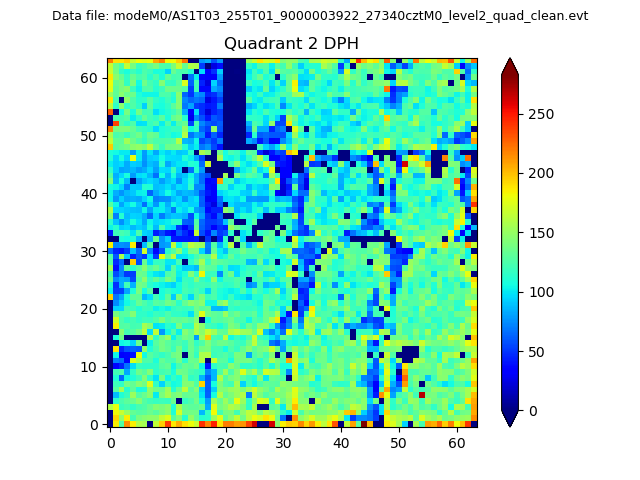
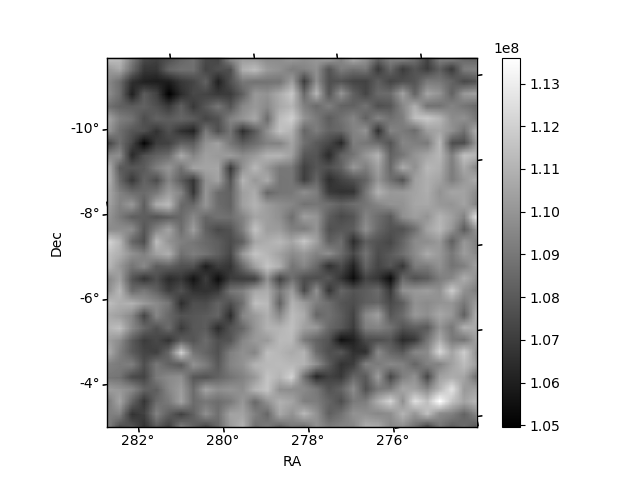
Histogram calculated using DETX and DETY for each event in the final _common_clean file
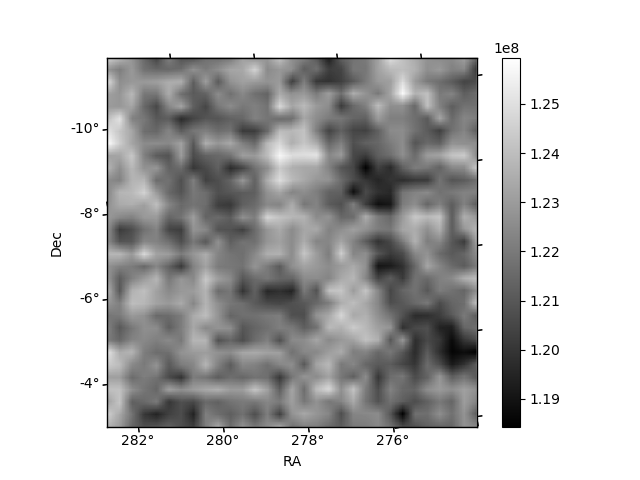
| Quadrant A | 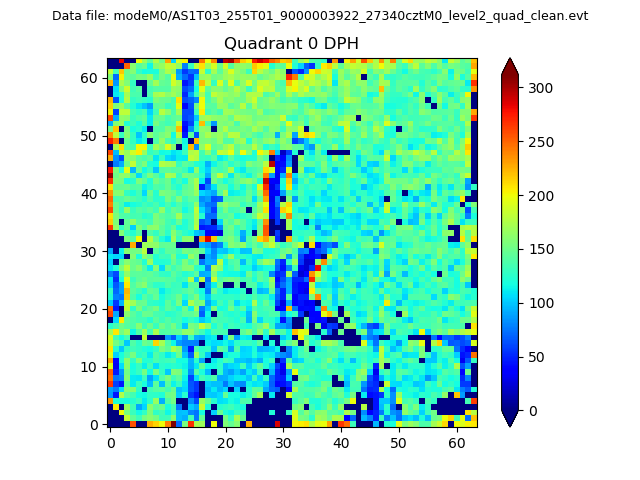 |
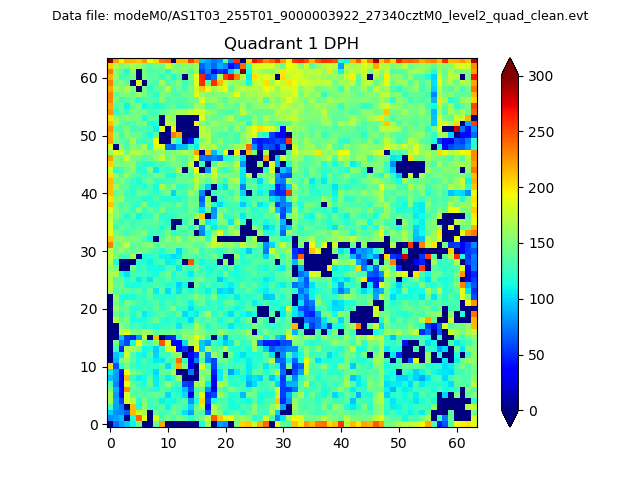 |
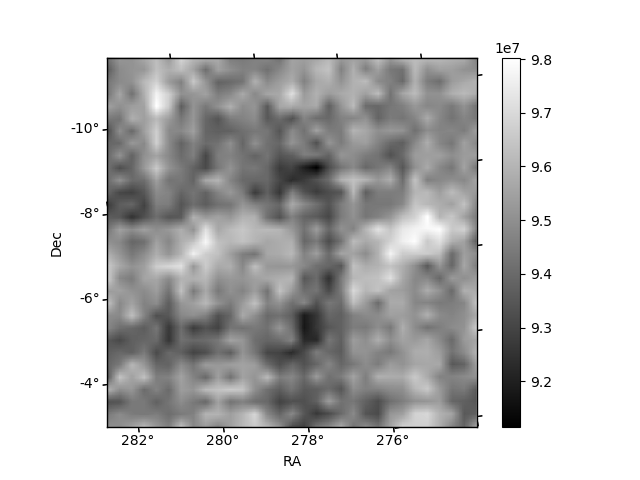
Quadrant B |
|---|---|---|---|
| Quadrant D | 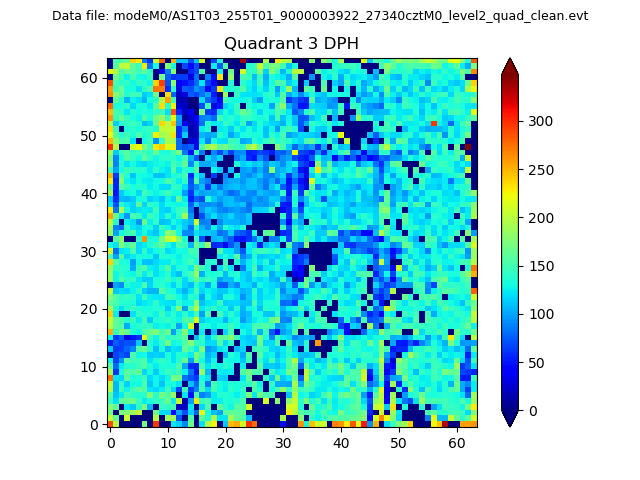 |
 |
Quadrant C |
| Plot type | Count rate plots | Images |
|---|---|---|
| Comparison with Poisson distribution Blue bars denote a histogram of data divided into 1 sec bins. Red curve is a Poisson curve with rate = median count rate of data. |
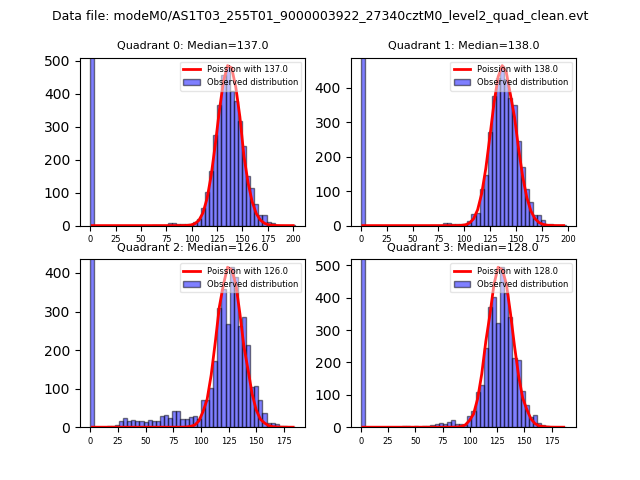 |
 |
| Quadrant-wise count rates Data is divided into 100 sec bins |
 |
|
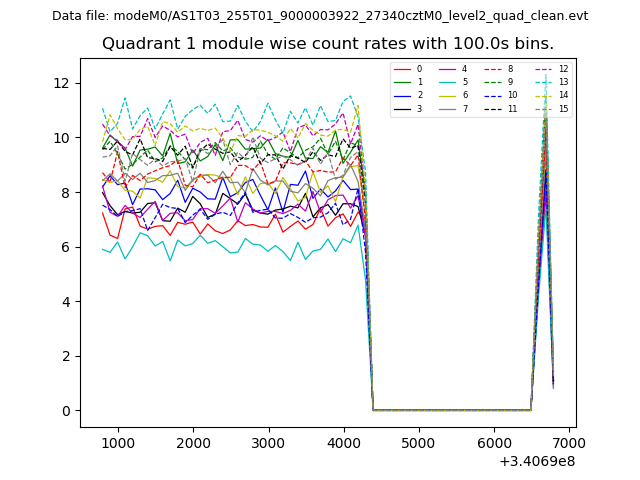
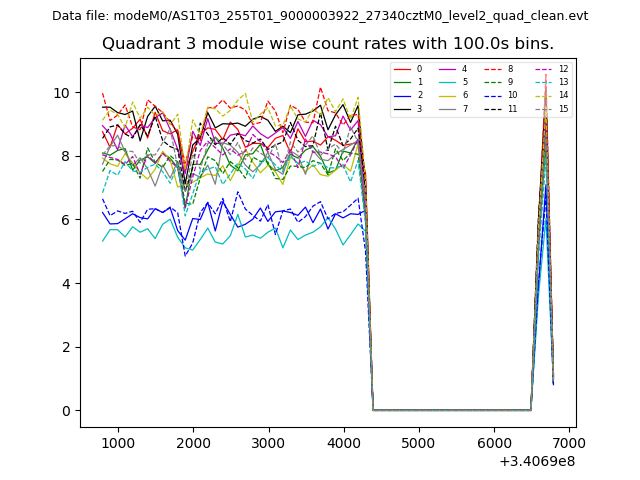
| Module-wise count rates for Quadrant A Data is divided into 100 sec bins |
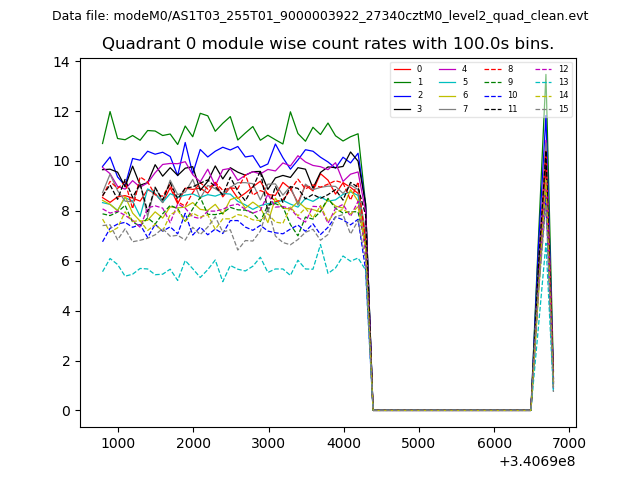 |
 |
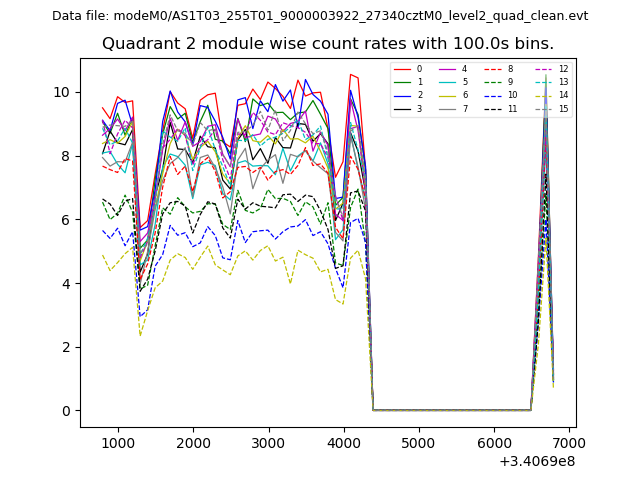
| Module-wise count rates for Quadrant B Data is divided into 100 sec bins |
 |
 |
| Module-wise count rates for Quadrant C Data is divided into 100 sec bins |
 |
 |
| Module-wise count rates for Quadrant D Data is divided into 100 sec bins |
 |
 |
| Parameter | Plot |
|---|---|
| CZT HV Monitor | 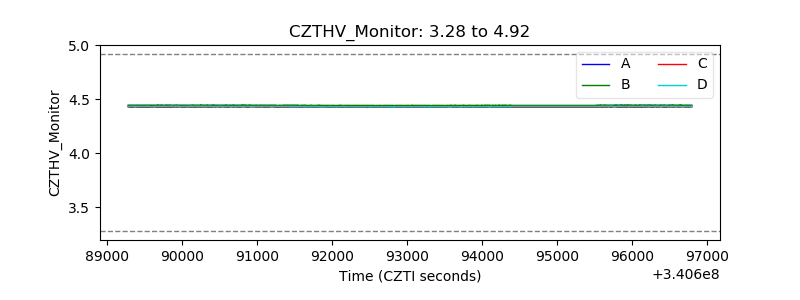 |
| D_VDD | 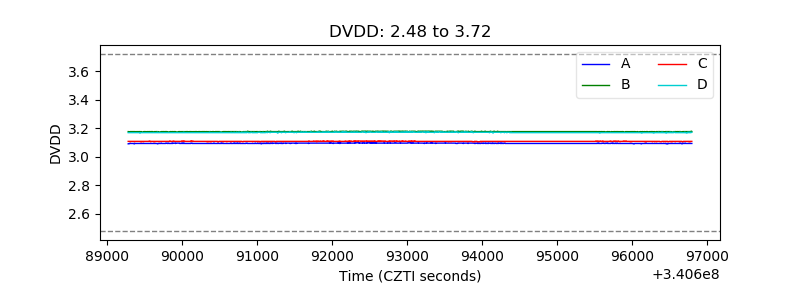 |
| Temperature 1 | 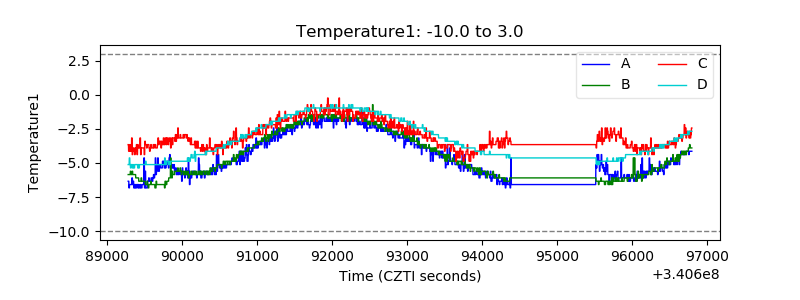 |
| Veto HV Monitor | 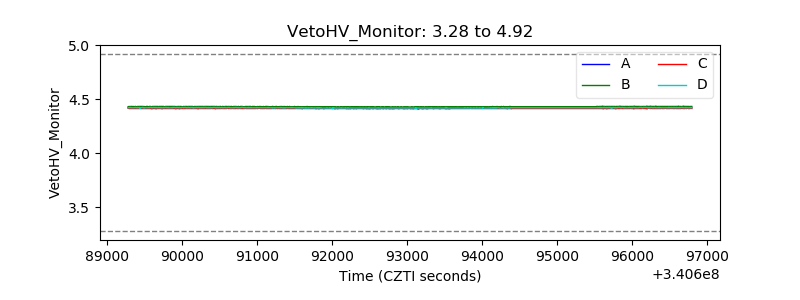 |
| Veto LLD | 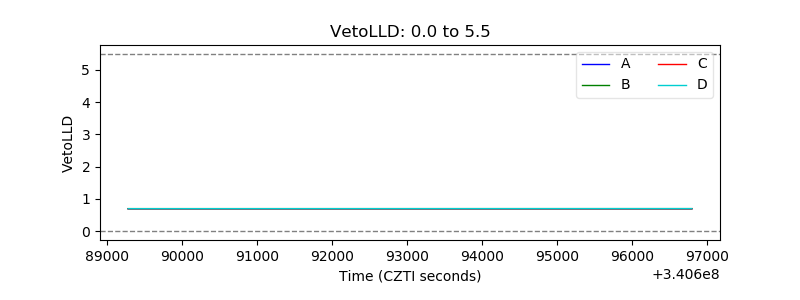 |
| Alpha Counter |  |
| _CPM_Rate |  |
| CZT Counter | 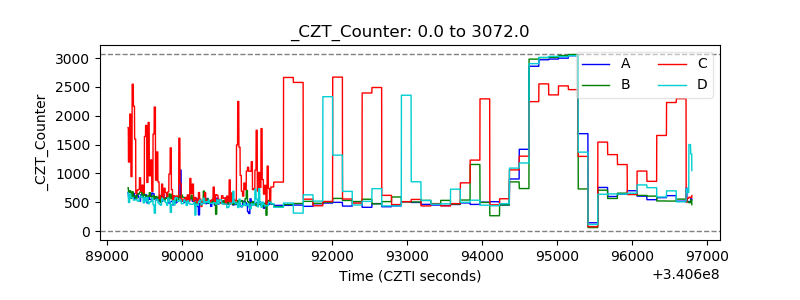 |
| +2.5 Volts monitor |  |
| +5 Volts monitor |  |
| _ROLL_ROT | 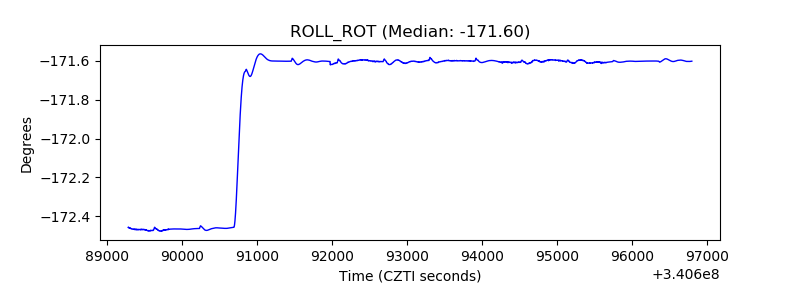 |
| _Roll_DEC | 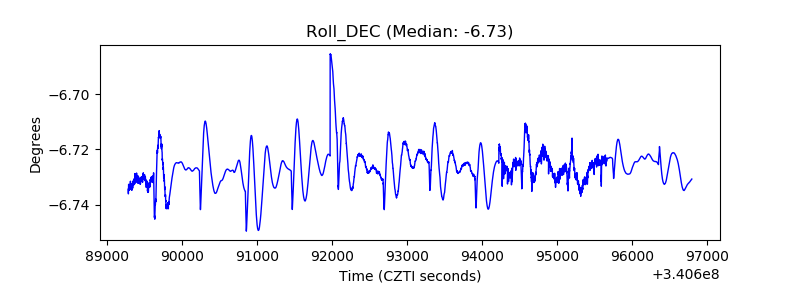 |
| _Roll_RA | 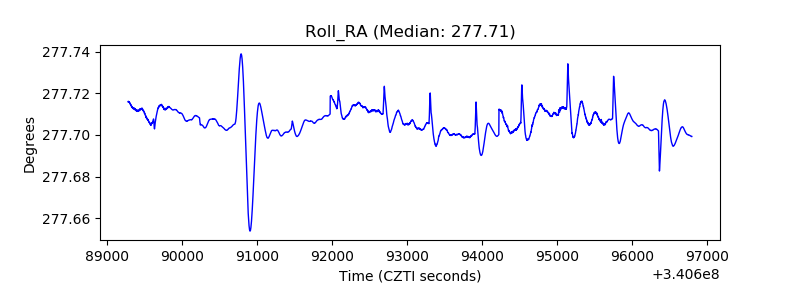 |
| Veto Counter | 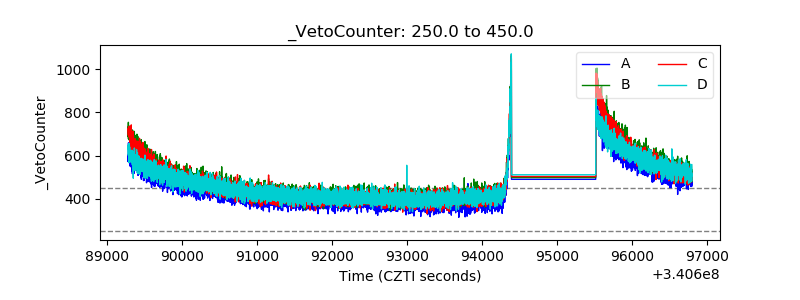 |