| Param | Original file | Final file |
|---|---|---|
| Filename | modeM0/AS1T03_255T01_9000003922_27341cztM0_level2.evt | modeM0/AS1T03_255T01_9000003922_27341cztM0_level2_quad_clean.evt |
| Size (bytes) | 800,285,760 | 86,889,600 |
| Size | 763.2 MB | 82.9 MB |
| Events in quadrant A | 3,366,873 | 626,636 |
| Events in quadrant B | 3,639,315 | 630,064 |
| Events in quadrant C | 6,490,735 | 536,610 |
| Events in quadrant D | 10,323,580 | 406,317 |
| Mode M9 | |||
|---|---|---|---|
| Quadrant | BADHDUFLAG | Total packets | Discarded packets |
| A | 0 | 12 | 0 |
| B | 0 | 12 | 0 |
| C | 0 | 12 | 0 |
| D | 0 | 12 | 0 |
| Mode M0 | |||
|---|---|---|---|
| Quadrant | BADHDUFLAG | Total packets | Discarded packets |
| A | 0 | 13953 | 0 |
| B | 0 | 14966 | 0 |
| C | 0 | 23474 | 0 |
| D | 0 | 34928 | 0 |
| Quadrant | Total seconds | Saturated seconds | Saturation percentage |
|---|---|---|---|
| A | 6161 | 87 | 1.412108% |
| B | 6162 | 116 | 1.882506% |
| C | 6162 | 1345 | 21.827329% |
| D | 6162 | 3014 | 48.912691% |
Noise dominated data is calculated using 1-second bins in cleaned event files. If a bin has >2000 counts, and if more than 50% of those come from <1% of pixels, then it is considered to be noise-dominated and hence unusable.
| Quadrant | # 1 sec bins | Bins with >0 counts | Bins with >2000 counts | High rate bins dominated by noise | Noise dominated (total time) | Noise dominated (detector-on time) | Marked lightcurve |
|---|---|---|---|---|---|---|---|
| A | 7361 | 6161 | 1 | 1 | 0.01% | 0.02% | 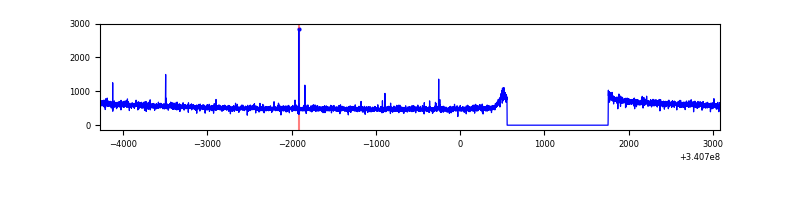 |
| B | 7362 | 6162 | 4 | 4 | 0.05% | 0.06% | 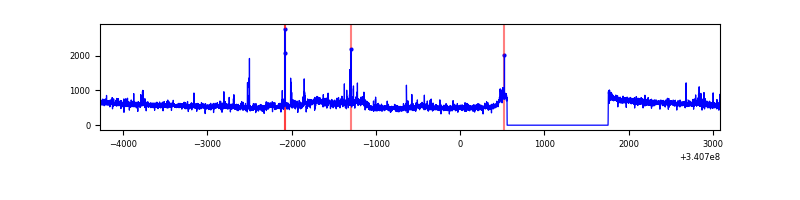 |
| C | 7362 | 6162 | 843 | 843 | 11.45% | 13.68% | 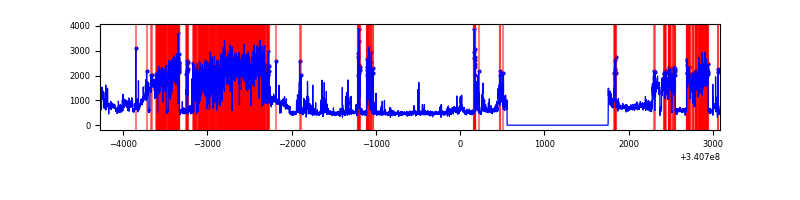 |
| D | 7362 | 6162 | 2940 | 2940 | 39.93% | 47.71% | 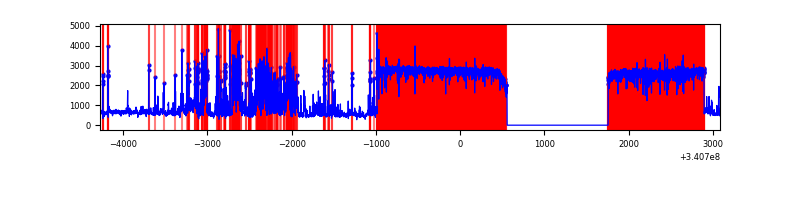 |
Top three noisy pixels from each quadrant. If the there are fewer than three noisy pixels in the level2.evt file, extra rows are filled as -1
| Pixel properties | Quadrant properties | ||||||
|---|---|---|---|---|---|---|---|
| Quadrant | DetID | PixID | Counts | Sigma | Mean | Median | Sigma |
| A | 13 | 254 | 9973 | 53.32 | 868 | 854 | 171.0 |
| A | 0 | 226 | 7562 | 39.22 | 868 | 854 | 171.0 |
| A | 3 | 137 | 7519 | 38.97 | 868 | 854 | 171.0 |
| B | 7 | 205 | 228678 | 1433.15 | 854 | 836 | 159.0 |
| B | 10 | 245 | 22202 | 134.39 | 854 | 836 | 159.0 |
| B | 12 | 111 | 18499 | 111.1 | 854 | 836 | 159.0 |
| C | 8 | 208 | 2605271 | 14571.12 | 767 | 776 | 178.7 |
| C | 2 | 16 | 759790 | 4246.38 | 767 | 776 | 178.7 |
| C | 14 | 238 | 125491 | 697.73 | 767 | 776 | 178.7 |
| D | 1 | 52 | 7937415 | 56622.94 | 591 | 578 | 140.2 |
| D | 2 | 250 | 124840 | 886.51 | 591 | 578 | 140.2 |
| D | 2 | 234 | 19143 | 132.45 | 591 | 578 | 140.2 |
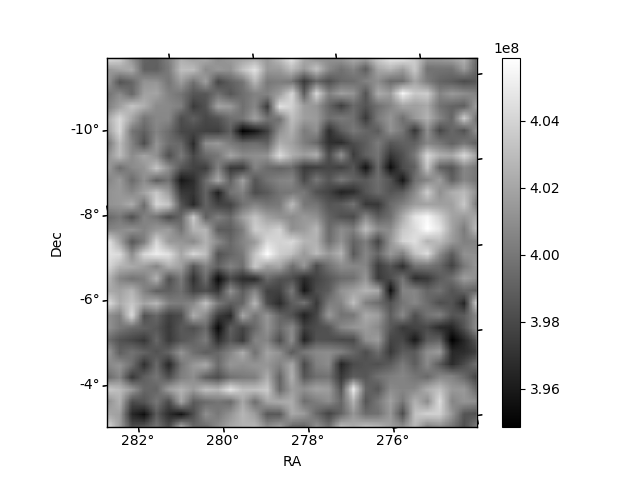
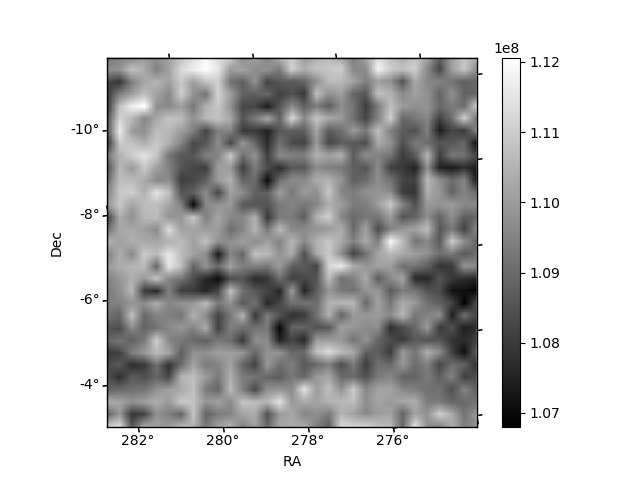
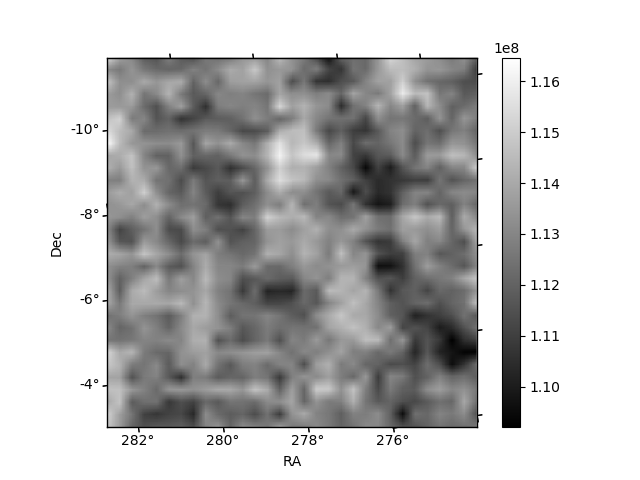
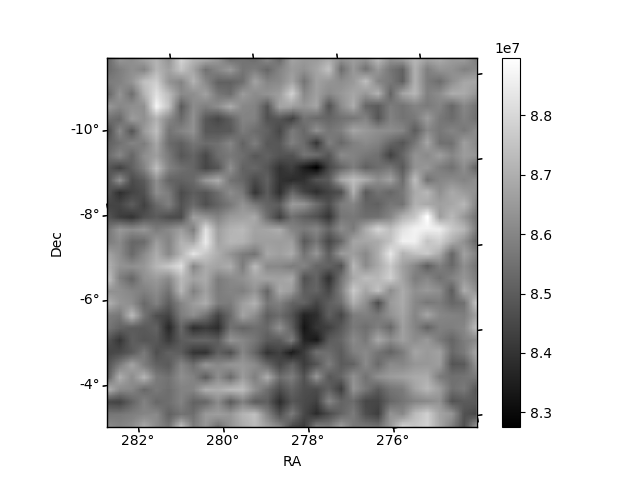
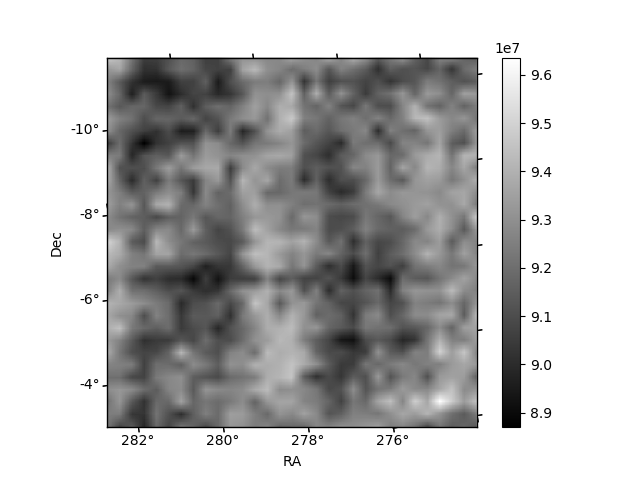
Histogram calculated using DETX and DETY for each event in the final _common_clean file
| Quadrant A | 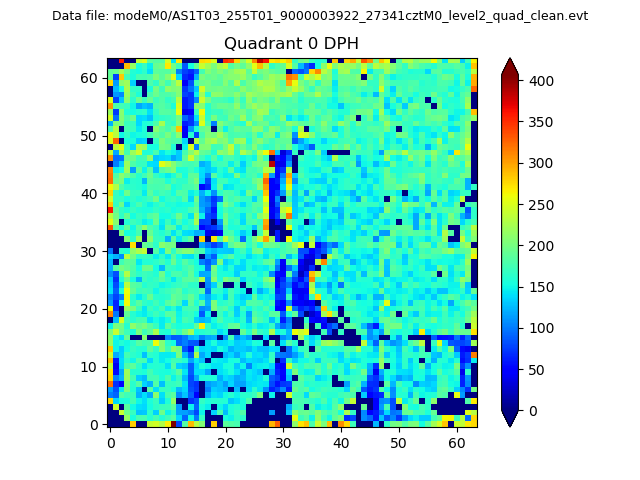 |
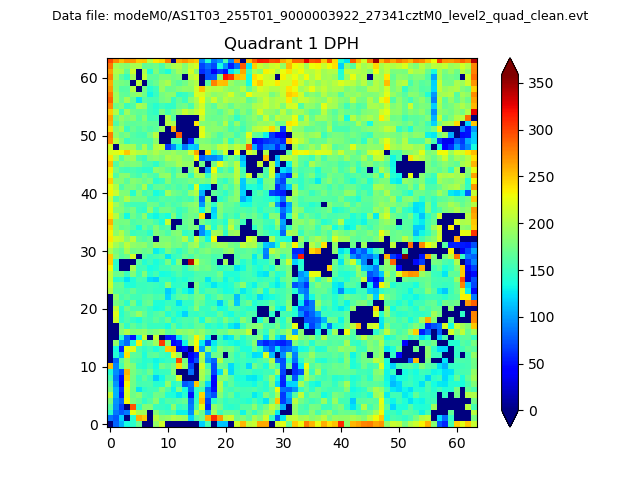 |
Quadrant B |
|---|---|---|---|
| Quadrant D |  |
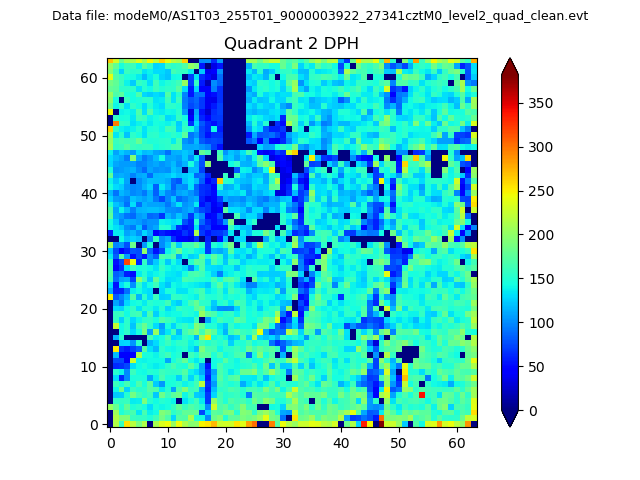 |
Quadrant C |
| Plot type | Count rate plots | Images |
|---|---|---|
| Comparison with Poisson distribution Blue bars denote a histogram of data divided into 1 sec bins. Red curve is a Poisson curve with rate = median count rate of data. |
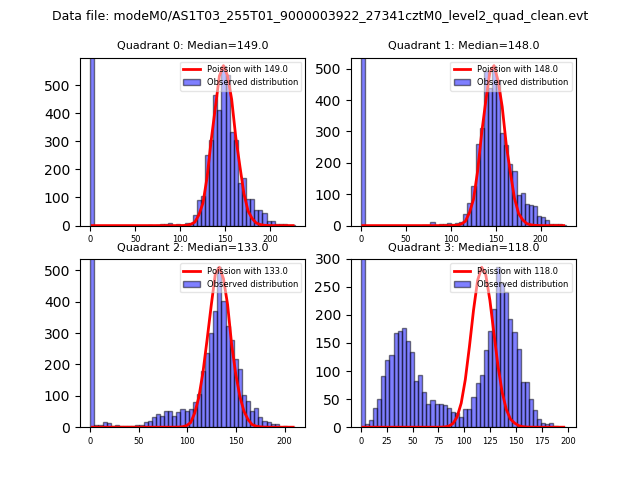 |
 |
| Quadrant-wise count rates Data is divided into 100 sec bins |
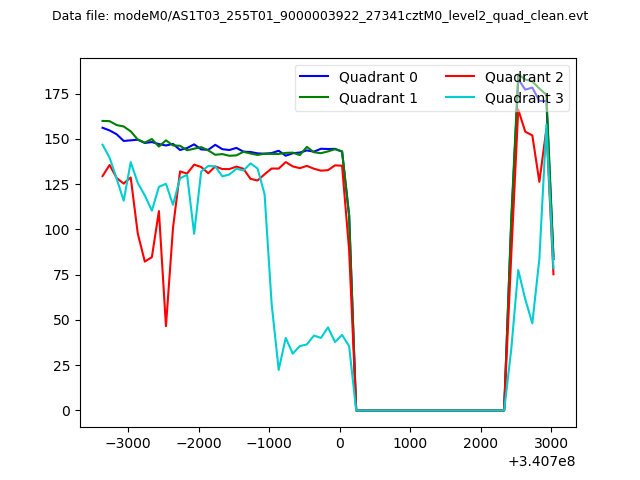 |
|
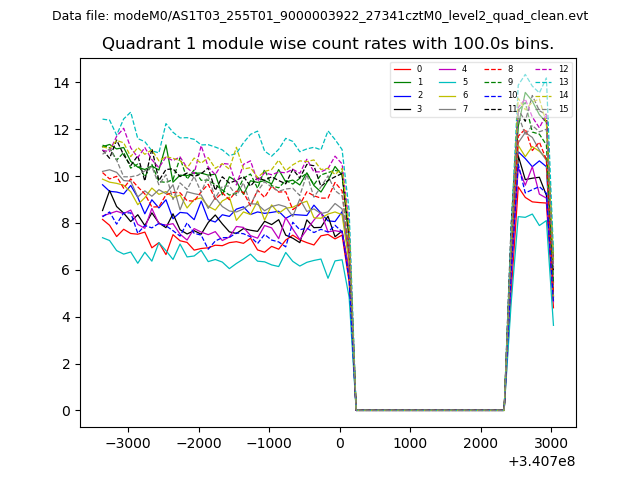
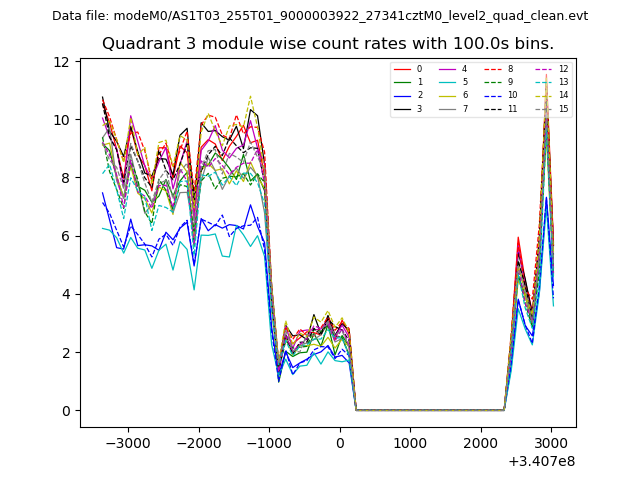
| Module-wise count rates for Quadrant A Data is divided into 100 sec bins |
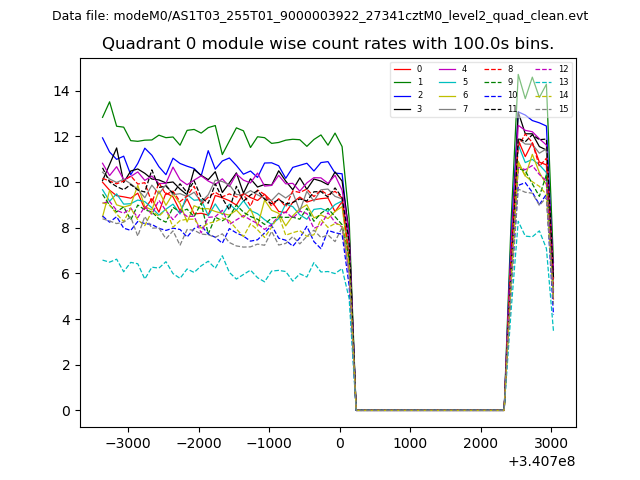 |
 |
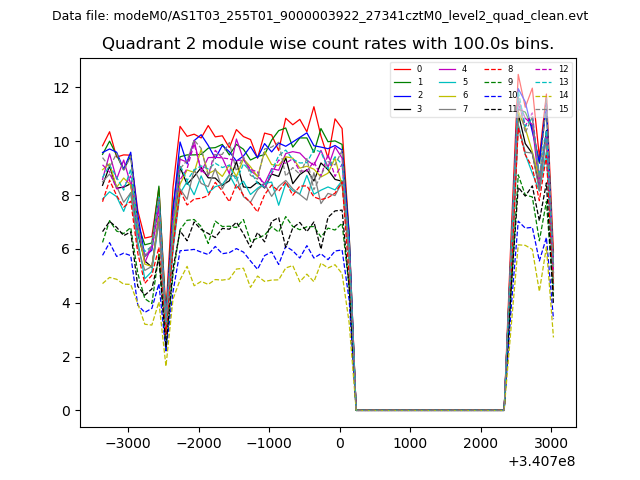
| Module-wise count rates for Quadrant B Data is divided into 100 sec bins |
 |
 |
| Module-wise count rates for Quadrant C Data is divided into 100 sec bins |
 |
 |
| Module-wise count rates for Quadrant D Data is divided into 100 sec bins |
 |
 |
| Parameter | Plot |
|---|---|
| CZT HV Monitor | 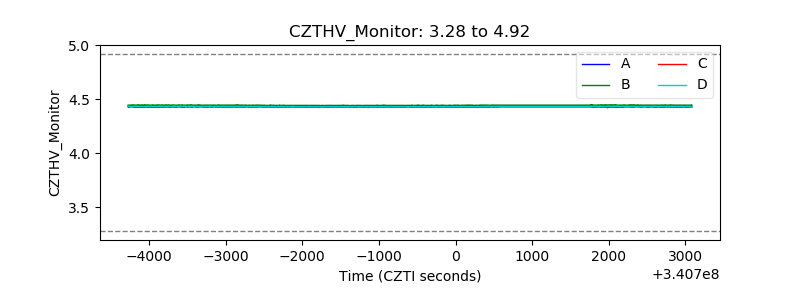 |
| D_VDD | 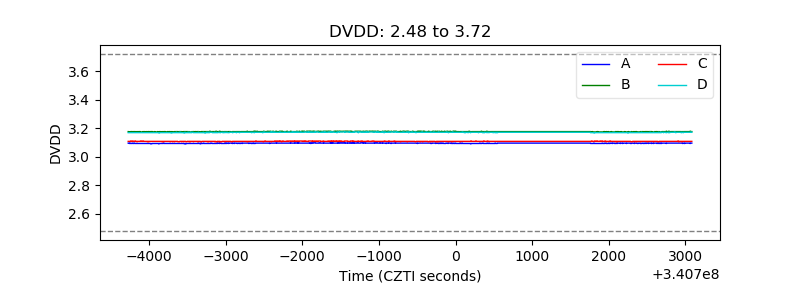 |
| Temperature 1 | 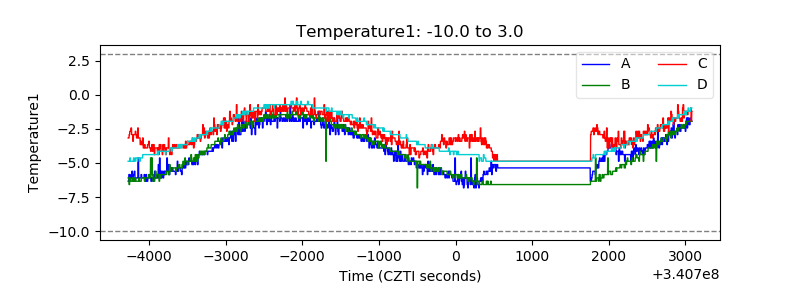 |
| Veto HV Monitor |  |
| Veto LLD | 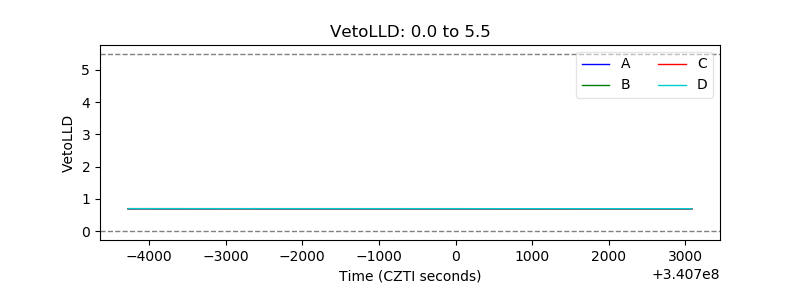 |
| Alpha Counter | 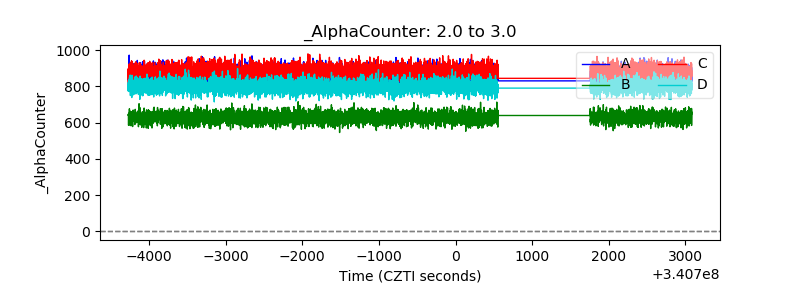 |
| _CPM_Rate | 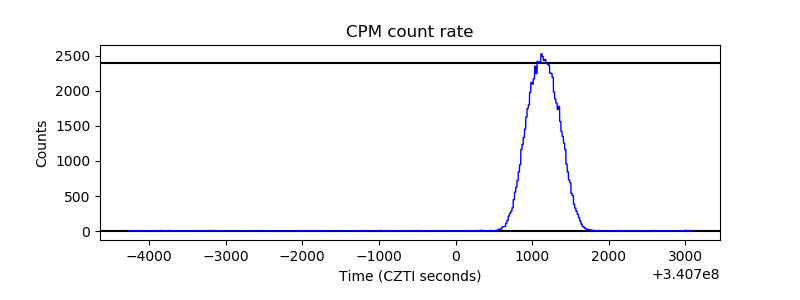 |
| CZT Counter | 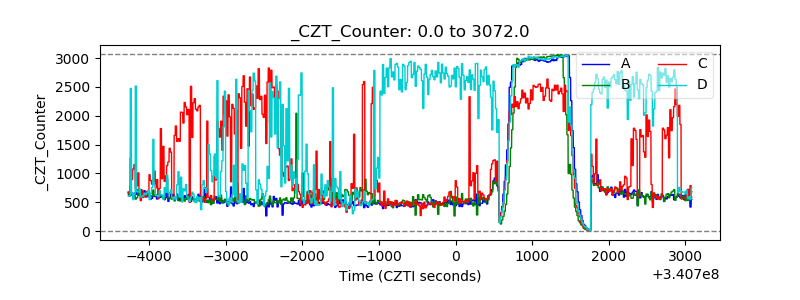 |
| +2.5 Volts monitor |  |
| +5 Volts monitor |  |
| _ROLL_ROT | 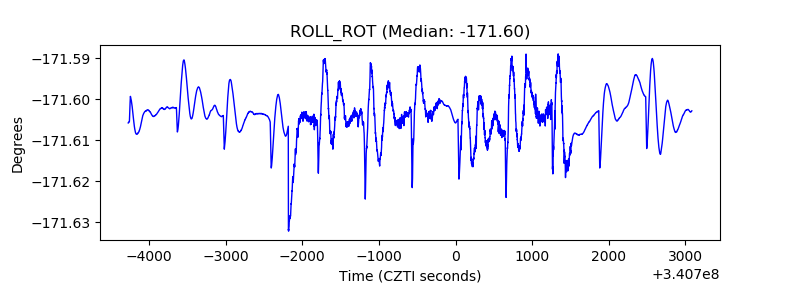 |
| _Roll_DEC | 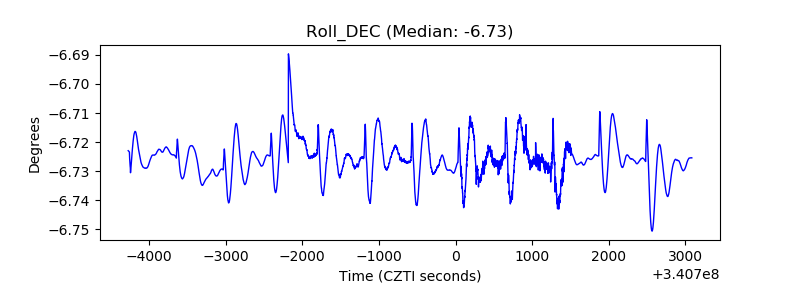 |
| _Roll_RA | 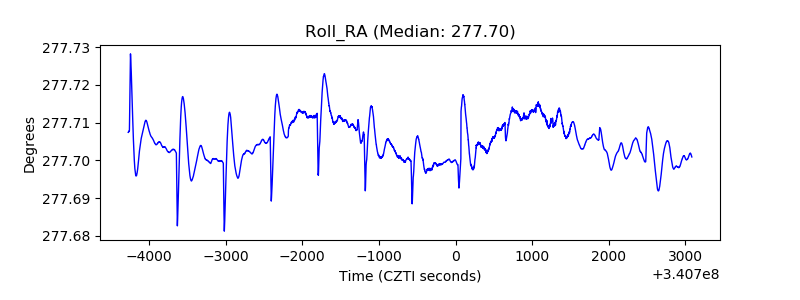 |
| Veto Counter | 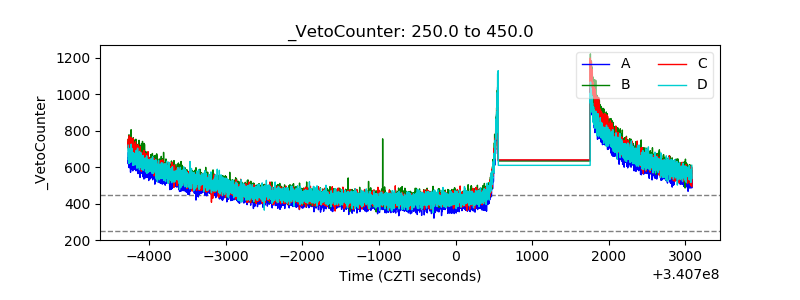 |