| Param | Original file | Final file |
|---|---|---|
| Filename | modeM0/AS1T03_255T01_9000003922_27342cztM0_level2.evt | modeM0/AS1T03_255T01_9000003922_27342cztM0_level2_quad_clean.evt |
| Size (bytes) | 653,034,240 | 105,865,920 |
| Size | 622.8 MB | 101.0 MB |
| Events in quadrant A | 3,517,883 | 750,253 |
| Events in quadrant B | 3,725,533 | 745,653 |
| Events in quadrant C | 6,626,960 | 634,509 |
| Events in quadrant D | 5,498,741 | 654,273 |
| Mode M9 | |||
|---|---|---|---|
| Quadrant | BADHDUFLAG | Total packets | Discarded packets |
| A | 0 | 13 | 0 |
| B | 0 | 13 | 0 |
| C | 0 | 13 | 0 |
| D | 0 | 13 | 0 |
| Mode M0 | |||
|---|---|---|---|
| Quadrant | BADHDUFLAG | Total packets | Discarded packets |
| A | 0 | 14459 | 0 |
| B | 0 | 15140 | 0 |
| C | 0 | 23642 | 0 |
| D | 0 | 20408 | 0 |
| Quadrant | Total seconds | Saturated seconds | Saturation percentage |
|---|---|---|---|
| A | 6031 | 106 | 1.757586% |
| B | 6031 | 174 | 2.885094% |
| C | 6031 | 1533 | 25.418670% |
| D | 6031 | 998 | 16.547836% |
Noise dominated data is calculated using 1-second bins in cleaned event files. If a bin has >2000 counts, and if more than 50% of those come from <1% of pixels, then it is considered to be noise-dominated and hence unusable.
| Quadrant | # 1 sec bins | Bins with >0 counts | Bins with >2000 counts | High rate bins dominated by noise | Noise dominated (total time) | Noise dominated (detector-on time) | Marked lightcurve |
|---|---|---|---|---|---|---|---|
| A | 7326 | 6031 | 12 | 12 | 0.16% | 0.20% | 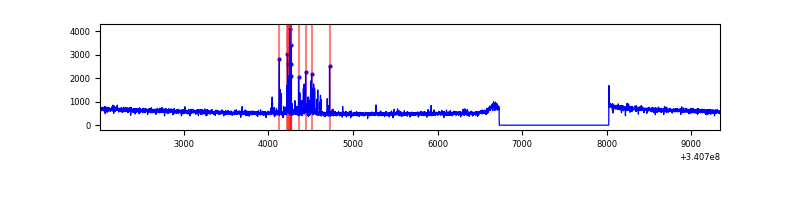 |
| B | 7326 | 6031 | 65 | 65 | 0.89% | 1.08% | 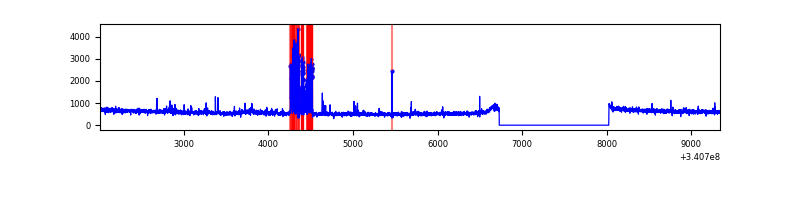 |
| C | 7326 | 6031 | 1020 | 1020 | 13.92% | 16.91% | 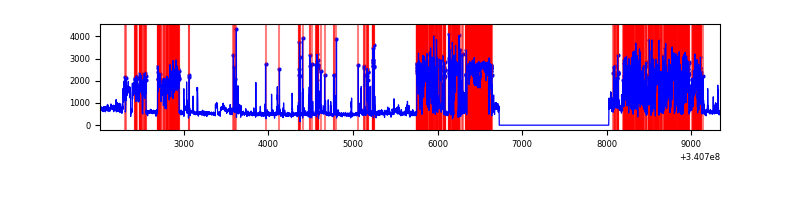 |
| D | 7326 | 6031 | 892 | 892 | 12.18% | 14.79% | 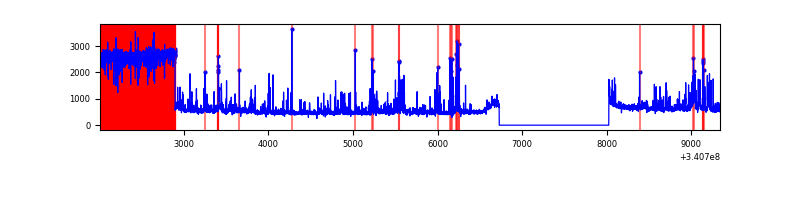 |
Top three noisy pixels from each quadrant. If the there are fewer than three noisy pixels in the level2.evt file, extra rows are filled as -1
| Pixel properties | Quadrant properties | ||||||
|---|---|---|---|---|---|---|---|
| Quadrant | DetID | PixID | Counts | Sigma | Mean | Median | Sigma |
| A | 13 | 248 | 110874 | 635.6 | 877 | 864 | 173.1 |
| A | 14 | 235 | 24302 | 135.42 | 877 | 864 | 173.1 |
| A | 13 | 254 | 9439 | 49.54 | 877 | 864 | 173.1 |
| B | 5 | 172 | 243055 | 1512.27 | 853 | 835 | 160.2 |
| B | 7 | 205 | 95171 | 588.97 | 853 | 835 | 160.2 |
| B | 10 | 245 | 20219 | 121.02 | 853 | 835 | 160.2 |
| C | 2 | 16 | 2063419 | 12420.61 | 722 | 729 | 166.1 |
| C | 8 | 208 | 1593655 | 9591.9 | 722 | 729 | 166.1 |
| C | 14 | 238 | 118077 | 706.62 | 722 | 729 | 166.1 |
| D | 1 | 52 | 2441575 | 13397.17 | 758 | 743 | 182.2 |
| D | 2 | 250 | 138419 | 755.67 | 758 | 743 | 182.2 |
| D | 2 | 234 | 25938 | 138.29 | 758 | 743 | 182.2 |
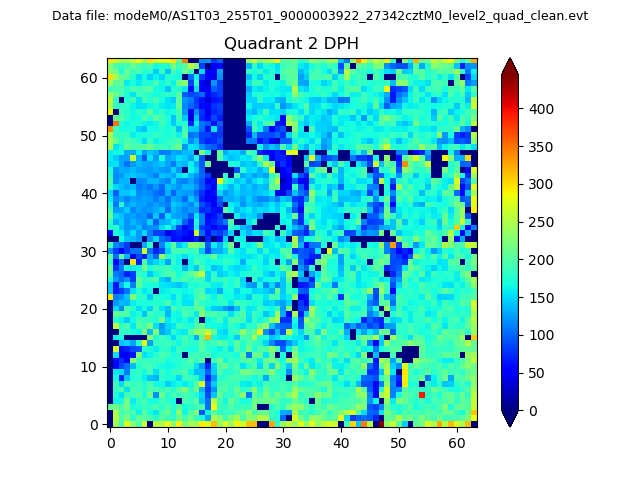
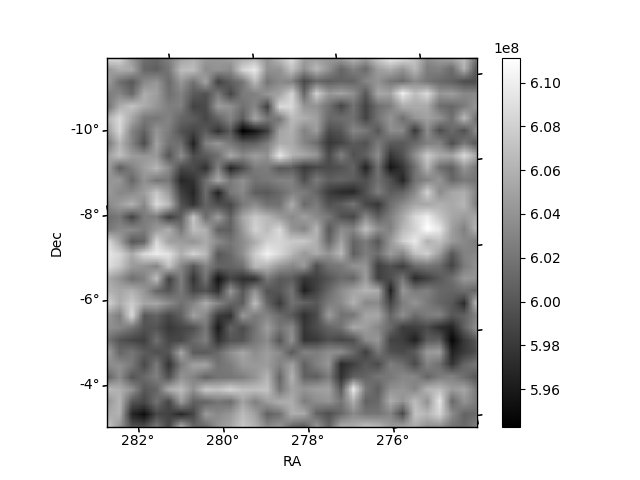
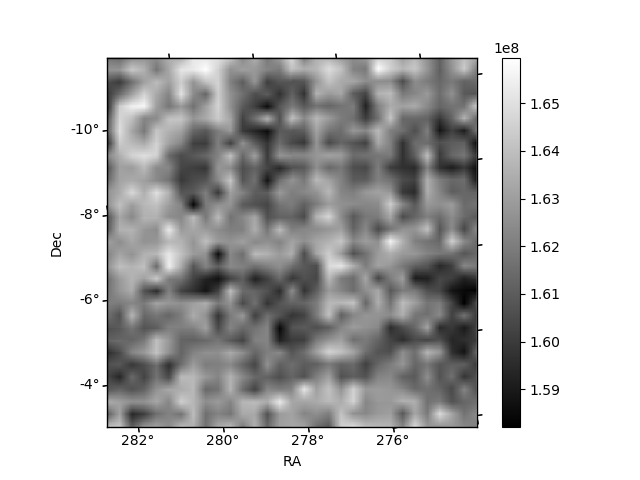
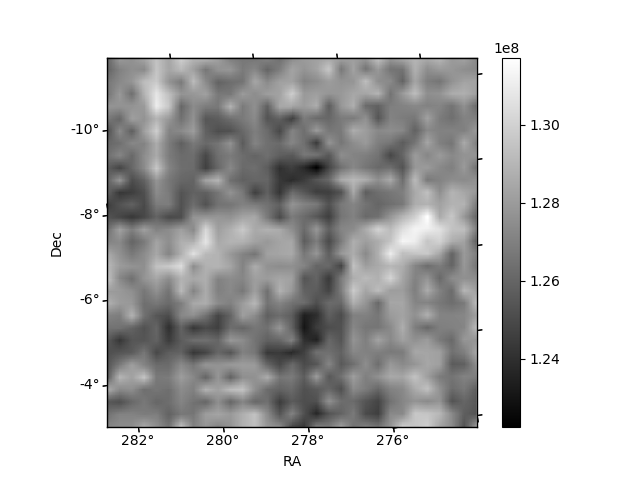
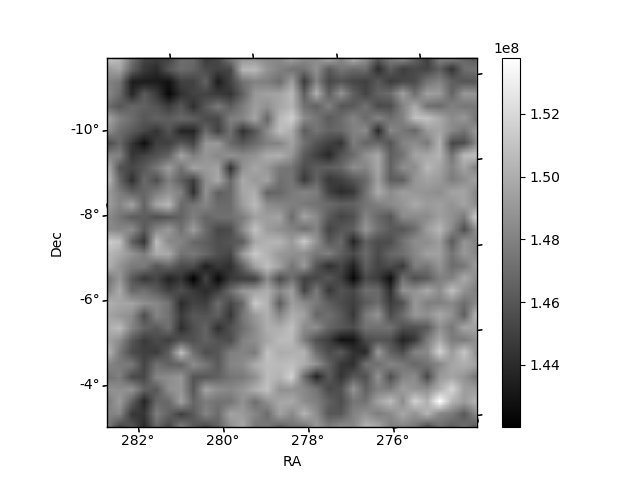
Histogram calculated using DETX and DETY for each event in the final _common_clean file
| Quadrant A | 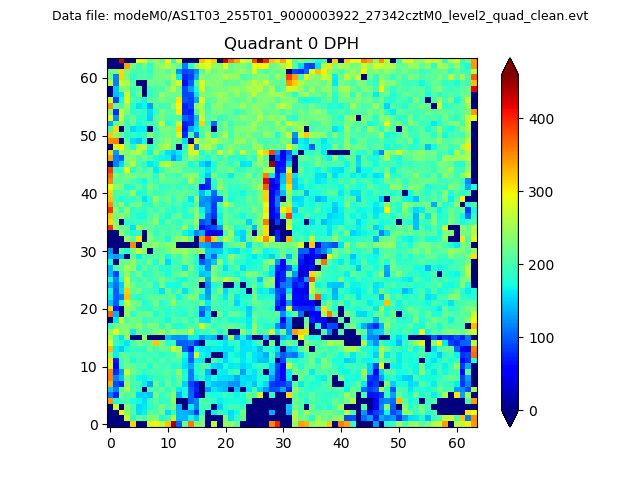 |
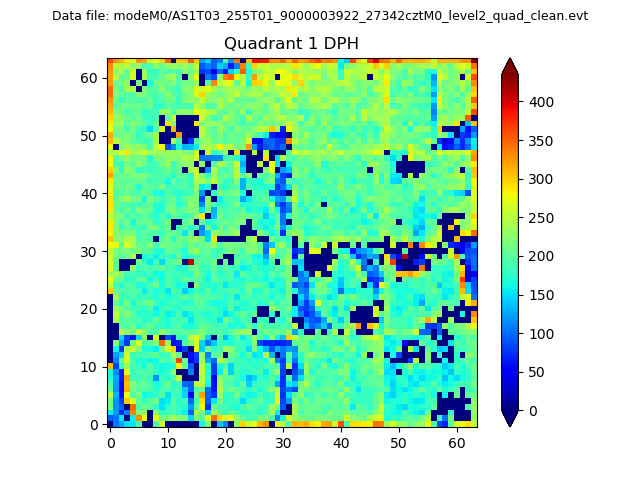 |
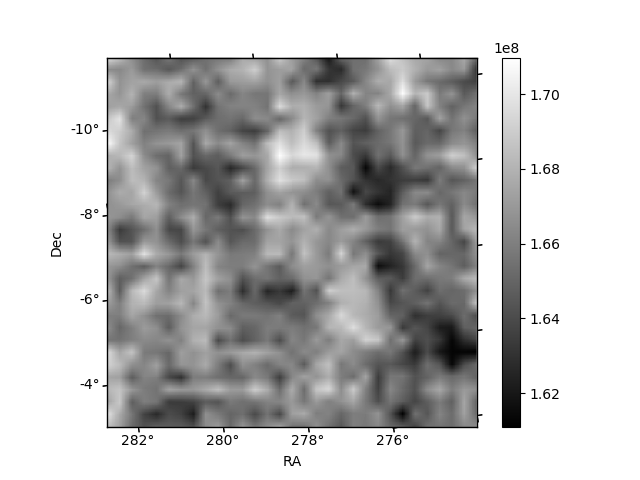
Quadrant B |
|---|---|---|---|
| Quadrant D | 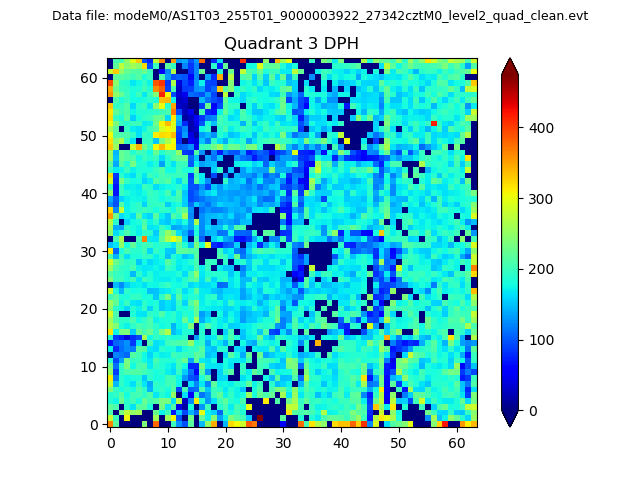 |
 |
Quadrant C |
| Plot type | Count rate plots | Images |
|---|---|---|
| Comparison with Poisson distribution Blue bars denote a histogram of data divided into 1 sec bins. Red curve is a Poisson curve with rate = median count rate of data. |
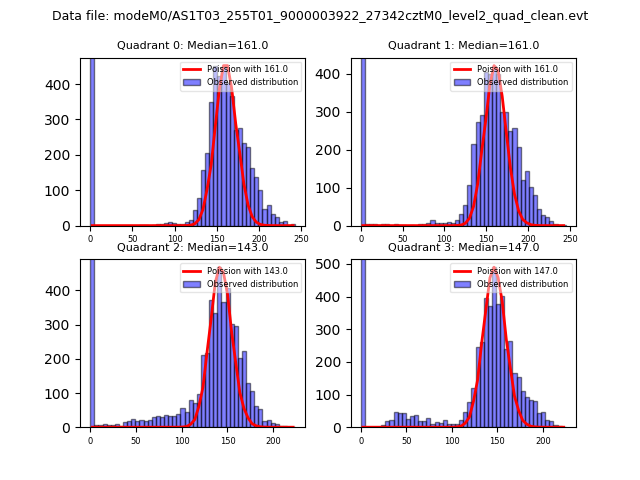 |
 |
| Quadrant-wise count rates Data is divided into 100 sec bins |
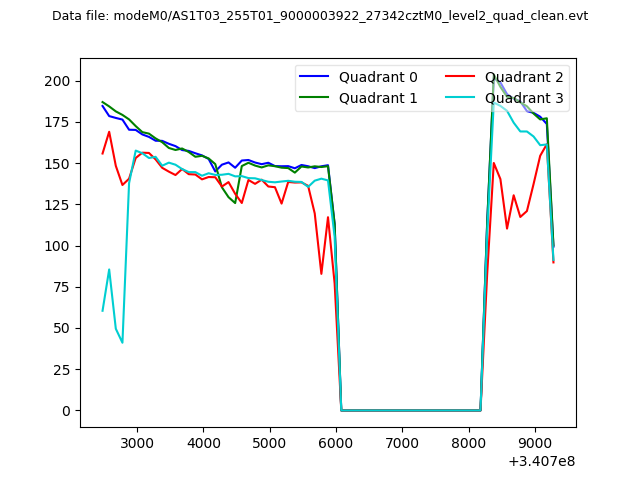 |
|
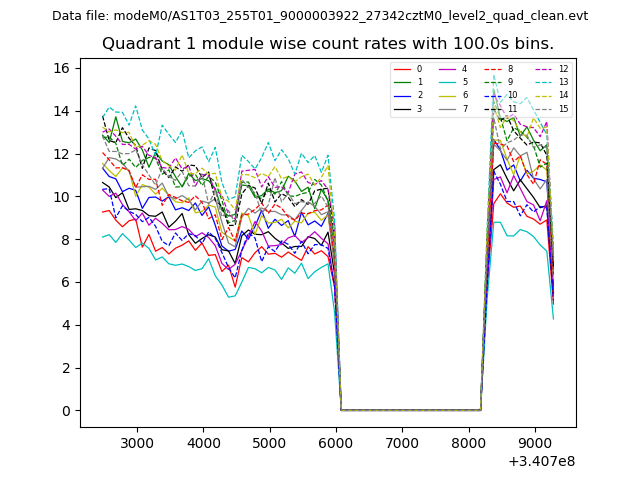
| Module-wise count rates for Quadrant A Data is divided into 100 sec bins |
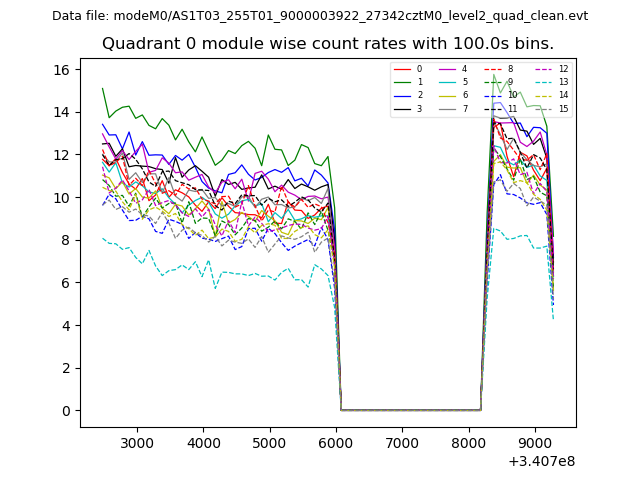 |
 |
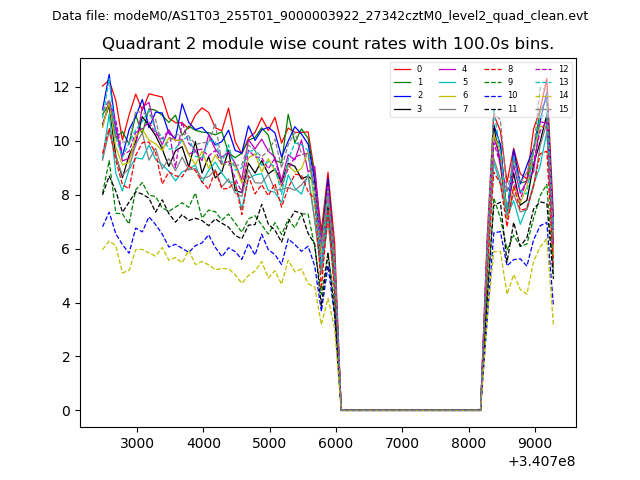
| Module-wise count rates for Quadrant B Data is divided into 100 sec bins |
 |
 |
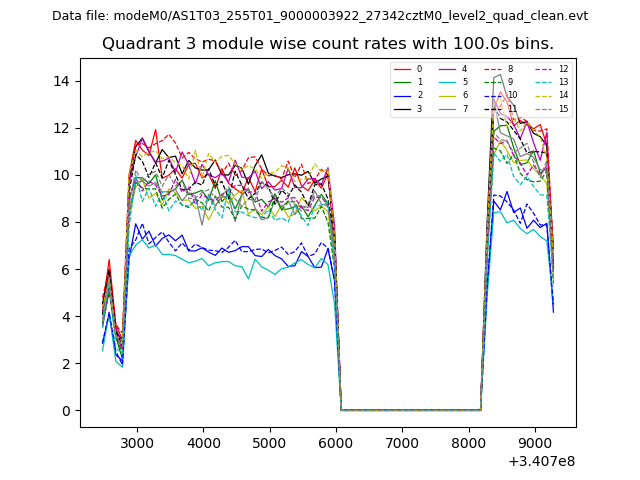
| Module-wise count rates for Quadrant C Data is divided into 100 sec bins |
 |
 |
| Module-wise count rates for Quadrant D Data is divided into 100 sec bins |
 |
 |
| Parameter | Plot |
|---|---|
| CZT HV Monitor | 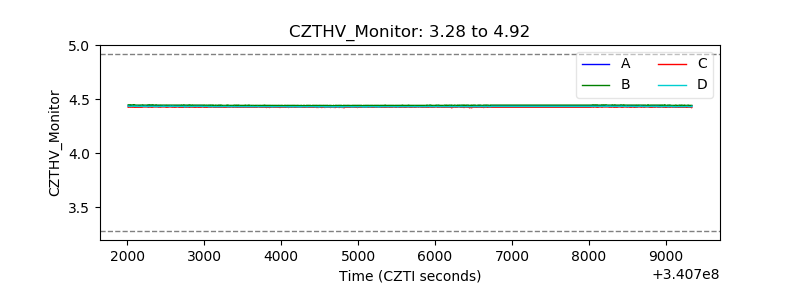 |
| D_VDD | 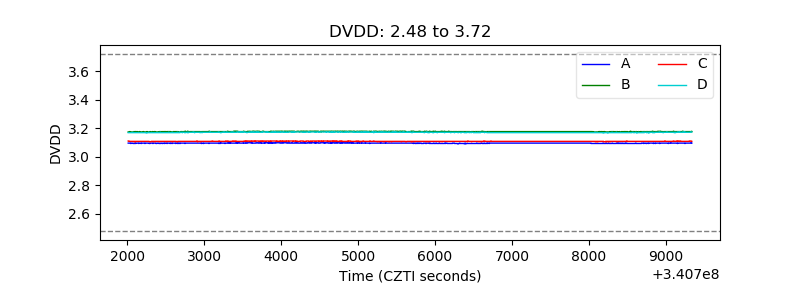 |
| Temperature 1 | 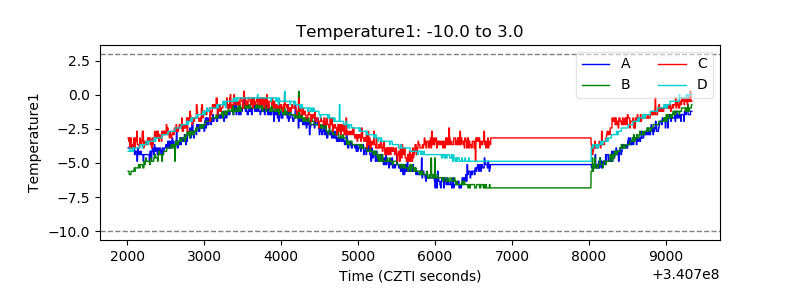 |
| Veto HV Monitor | 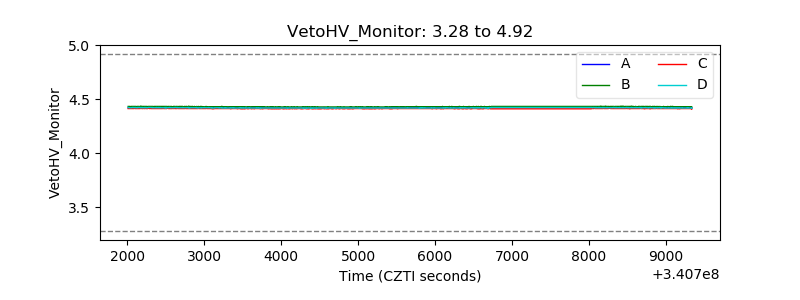 |
| Veto LLD |  |
| Alpha Counter | 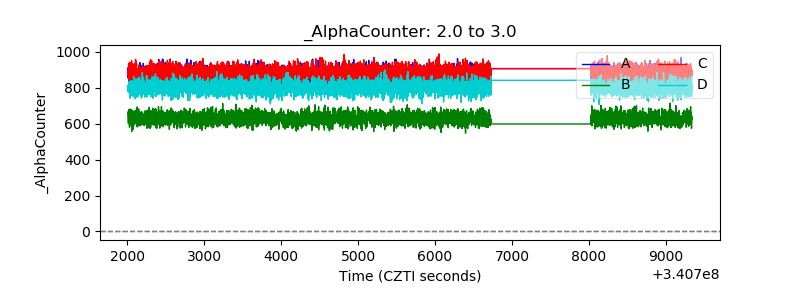 |
| _CPM_Rate | 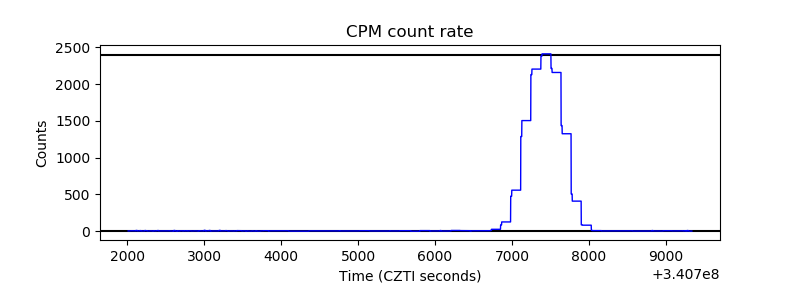 |
| CZT Counter | 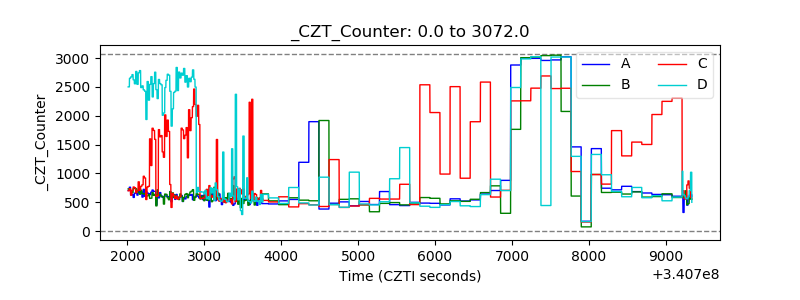 |
| +2.5 Volts monitor |  |
| +5 Volts monitor |  |
| _ROLL_ROT | 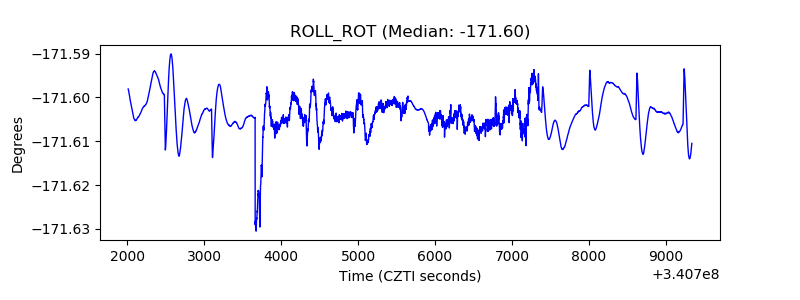 |
| _Roll_DEC | 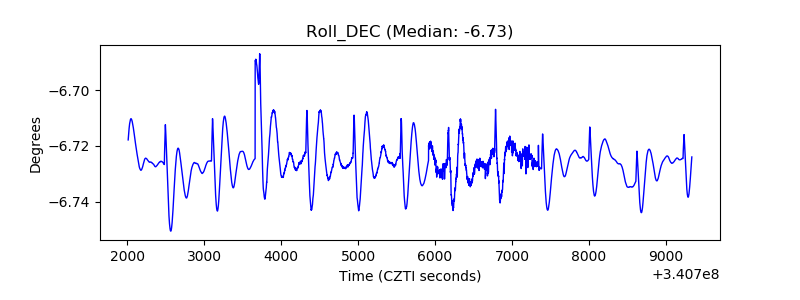 |
| _Roll_RA | 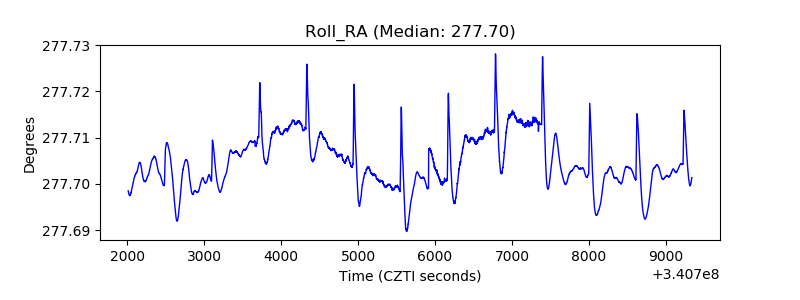 |
| Veto Counter | 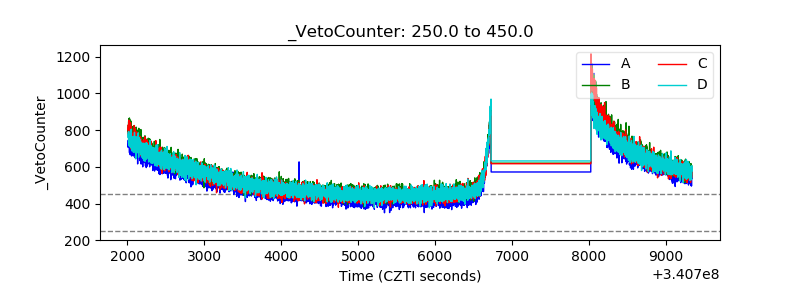 |