| Param | Original file | Final file |
|---|---|---|
| Filename | modeM0/AS1T03_255T01_9000003922_27343cztM0_level2.evt | modeM0/AS1T03_255T01_9000003922_27343cztM0_level2_quad_clean.evt |
| Size (bytes) | 501,356,160 | 108,040,320 |
| Size | 478.1 MB | 103.0 MB |
| Events in quadrant A | 3,125,689 | 758,836 |
| Events in quadrant B | 3,296,225 | 757,262 |
| Events in quadrant C | 4,879,061 | 666,051 |
| Events in quadrant D | 3,502,729 | 698,381 |
| Mode M9 | |||
|---|---|---|---|
| Quadrant | BADHDUFLAG | Total packets | Discarded packets |
| A | 0 | 13 | 0 |
| B | 0 | 13 | 0 |
| C | 0 | 13 | 0 |
| D | 0 | 13 | 0 |
| Mode M0 | |||
|---|---|---|---|
| Quadrant | BADHDUFLAG | Total packets | Discarded packets |
| A | 0 | 12898 | 0 |
| B | 0 | 13367 | 0 |
| C | 0 | 18175 | 0 |
| D | 0 | 14067 | 0 |
| Quadrant | Total seconds | Saturated seconds | Saturation percentage |
|---|---|---|---|
| A | 5597 | 128 | 2.286939% |
| B | 5598 | 144 | 2.572347% |
| C | 5598 | 816 | 14.576635% |
| D | 5598 | 168 | 3.001072% |
Noise dominated data is calculated using 1-second bins in cleaned event files. If a bin has >2000 counts, and if more than 50% of those come from <1% of pixels, then it is considered to be noise-dominated and hence unusable.
| Quadrant | # 1 sec bins | Bins with >0 counts | Bins with >2000 counts | High rate bins dominated by noise | Noise dominated (total time) | Noise dominated (detector-on time) | Marked lightcurve |
|---|---|---|---|---|---|---|---|
| A | 6897 | 5597 | 6 | 6 | 0.09% | 0.11% | 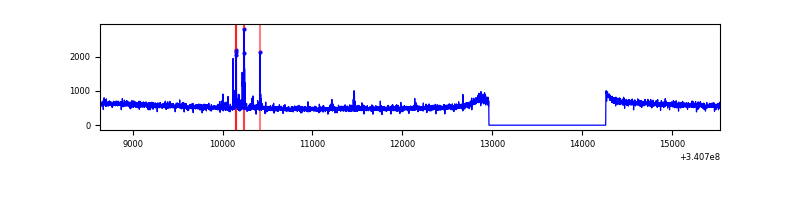 |
| B | 6898 | 5598 | 14 | 14 | 0.20% | 0.25% | 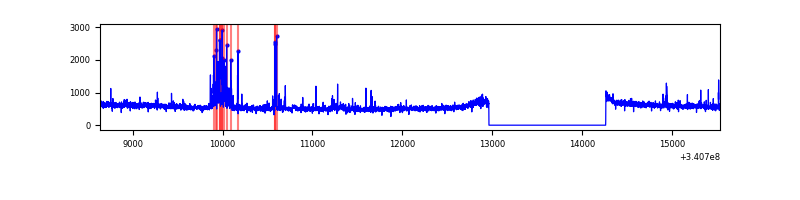 |
| C | 6898 | 5598 | 474 | 474 | 6.87% | 8.47% | 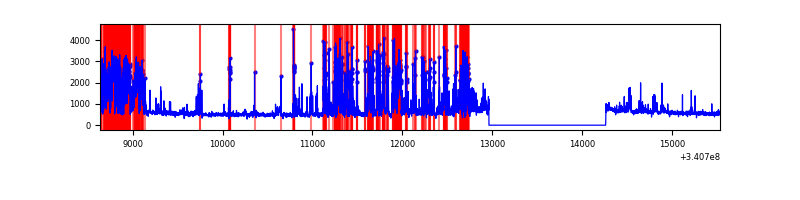 |
| D | 6898 | 5598 | 56 | 56 | 0.81% | 1.00% |  |
Top three noisy pixels from each quadrant. If the there are fewer than three noisy pixels in the level2.evt file, extra rows are filled as -1
| Pixel properties | Quadrant properties | ||||||
|---|---|---|---|---|---|---|---|
| Quadrant | DetID | PixID | Counts | Sigma | Mean | Median | Sigma |
| A | 14 | 235 | 48694 | 302.62 | 797 | 786 | 158.3 |
| A | 13 | 254 | 9334 | 53.99 | 797 | 786 | 158.3 |
| A | 0 | 226 | 6891 | 38.56 | 797 | 786 | 158.3 |
| B | 5 | 172 | 140631 | 950.88 | 777 | 759 | 147.1 |
| B | 7 | 205 | 73515 | 494.61 | 777 | 759 | 147.1 |
| B | 0 | 190 | 23651 | 155.62 | 777 | 759 | 147.1 |
| C | 2 | 16 | 1282944 | 7864.45 | 704 | 709 | 163.0 |
| C | 8 | 208 | 726507 | 4451.6 | 704 | 709 | 163.0 |
| C | 14 | 238 | 114996 | 700.97 | 704 | 709 | 163.0 |
| D | 1 | 52 | 315003 | 1677.97 | 755 | 738 | 187.3 |
| D | 2 | 250 | 208072 | 1107.03 | 755 | 738 | 187.3 |
| D | 2 | 120 | 44820 | 235.37 | 755 | 738 | 187.3 |
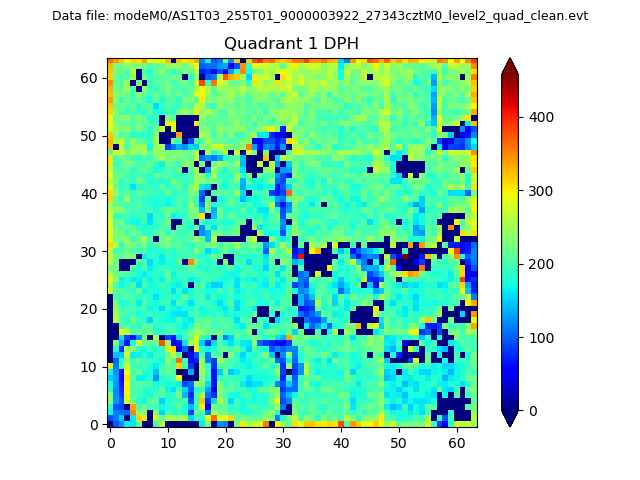
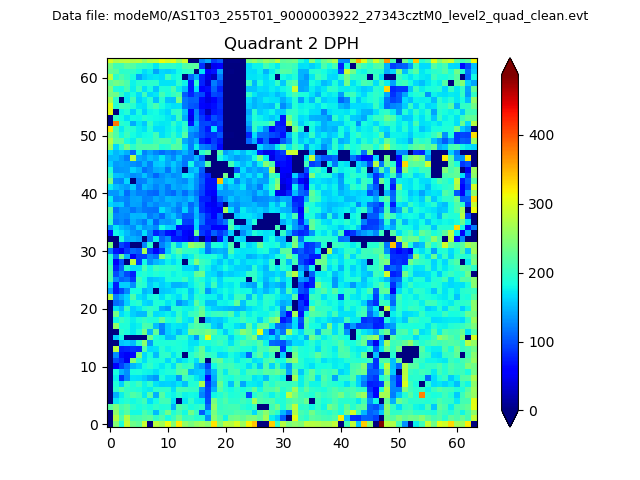
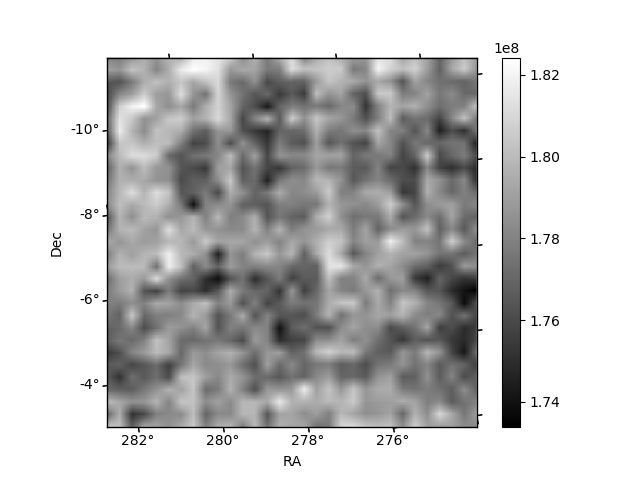
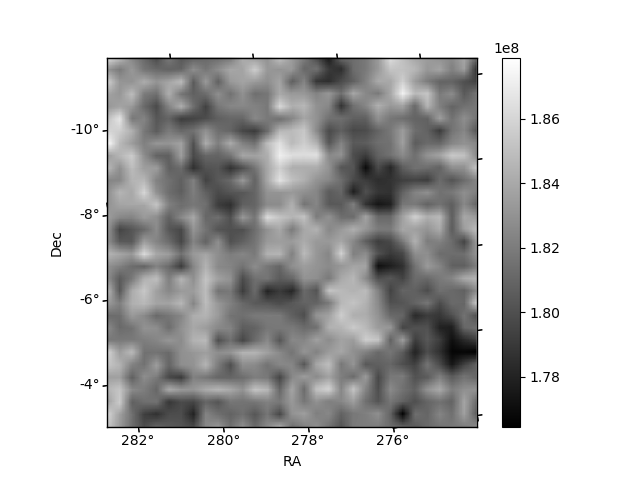
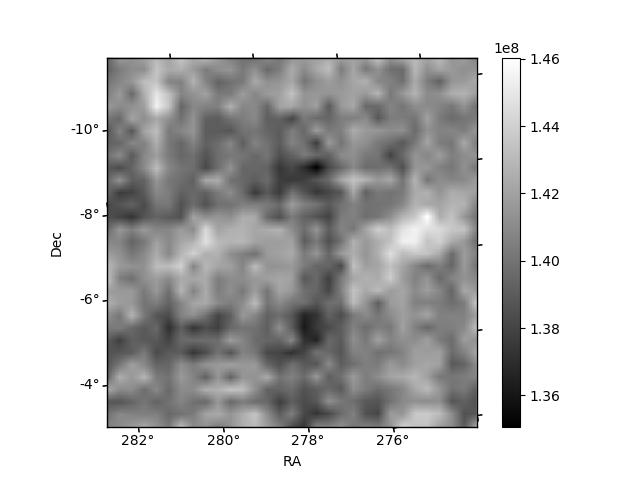
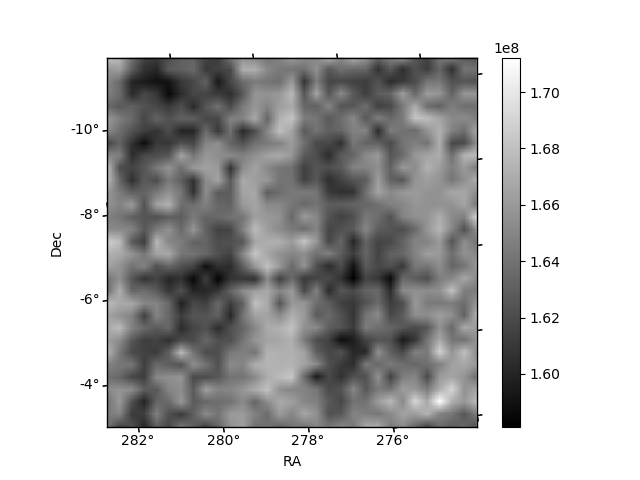
Histogram calculated using DETX and DETY for each event in the final _common_clean file
| Quadrant A | 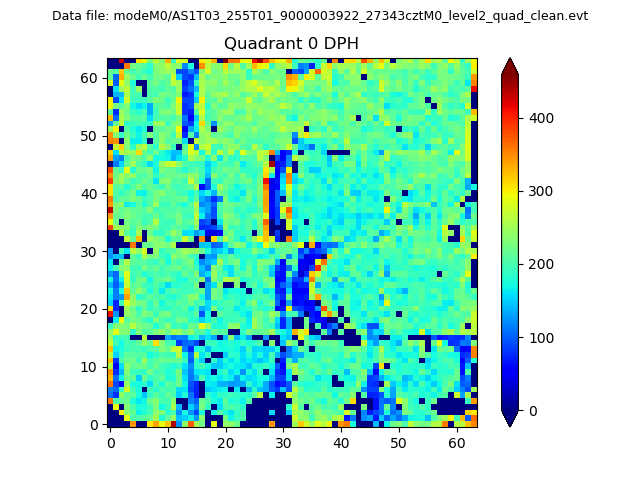 |
 |
Quadrant B |
|---|---|---|---|
| Quadrant D | 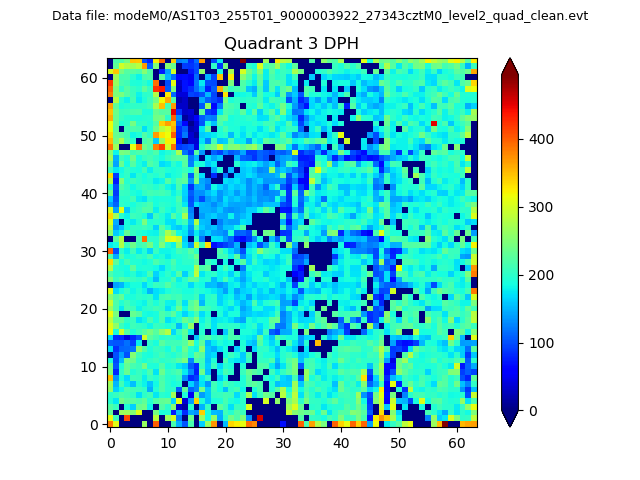 |
 |
Quadrant C |
| Plot type | Count rate plots | Images |
|---|---|---|
| Comparison with Poisson distribution Blue bars denote a histogram of data divided into 1 sec bins. Red curve is a Poisson curve with rate = median count rate of data. |
 |
 |
| Quadrant-wise count rates Data is divided into 100 sec bins |
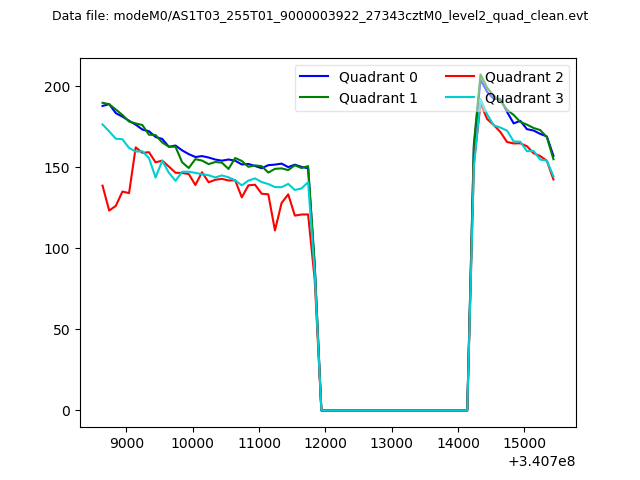 |
|
| Module-wise count rates for Quadrant A Data is divided into 100 sec bins |
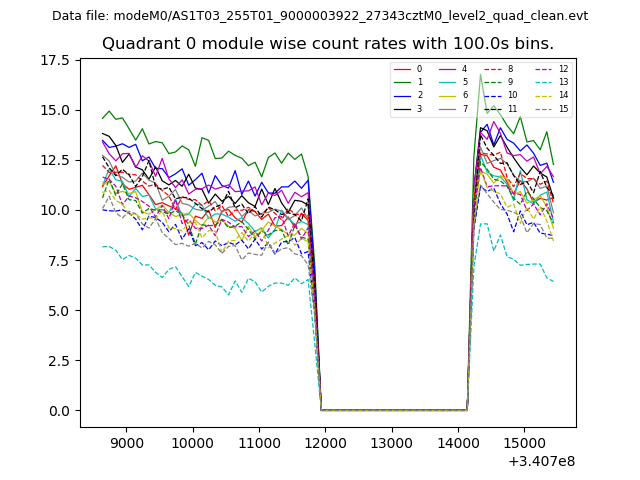 |
 |
| Module-wise count rates for Quadrant B Data is divided into 100 sec bins |
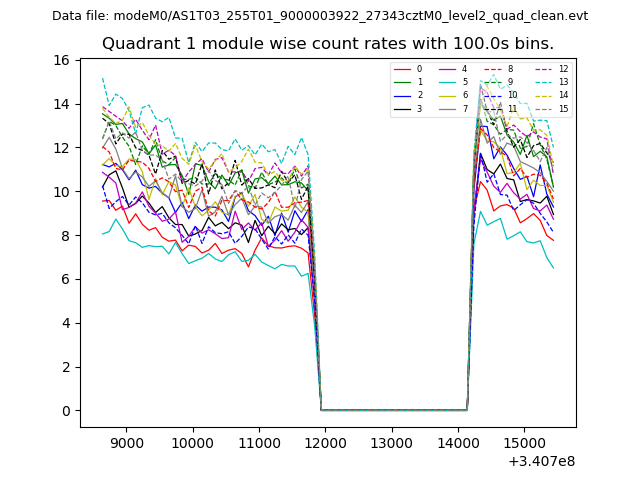 |
 |
| Module-wise count rates for Quadrant C Data is divided into 100 sec bins |
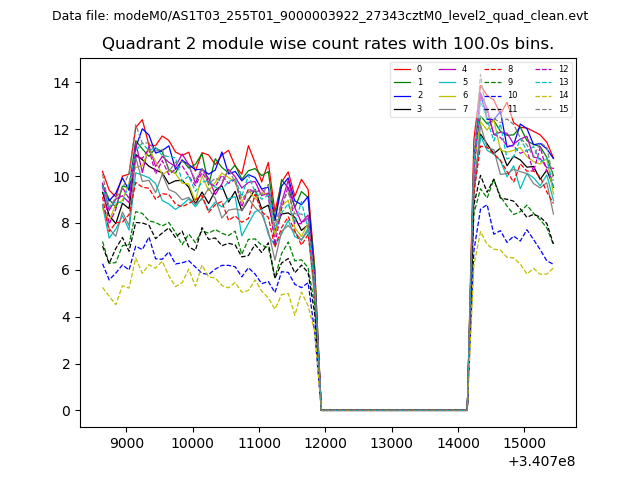 |
 |
| Module-wise count rates for Quadrant D Data is divided into 100 sec bins |
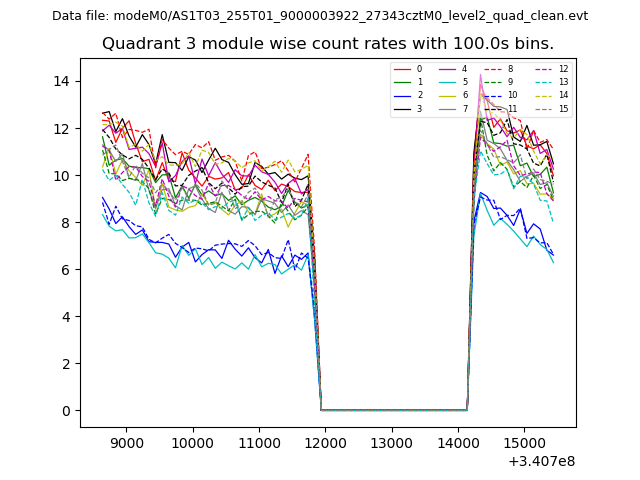 |
 |
| Parameter | Plot |
|---|---|
| CZT HV Monitor | 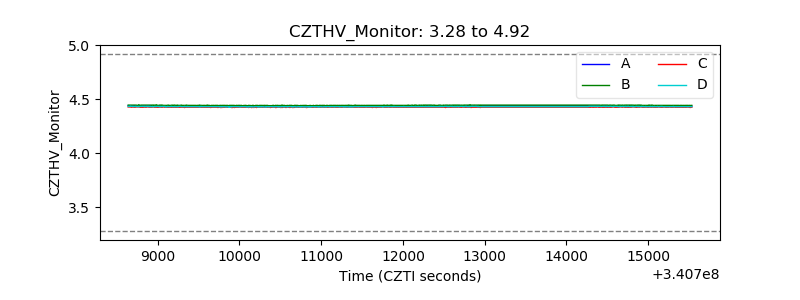 |
| D_VDD | 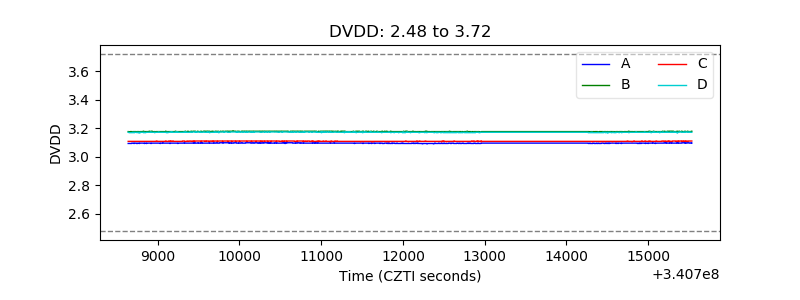 |
| Temperature 1 | 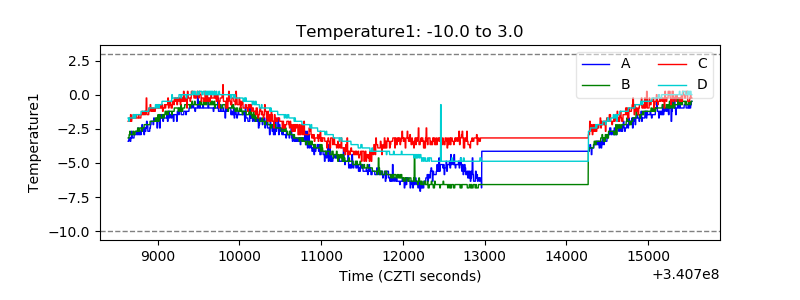 |
| Veto HV Monitor | 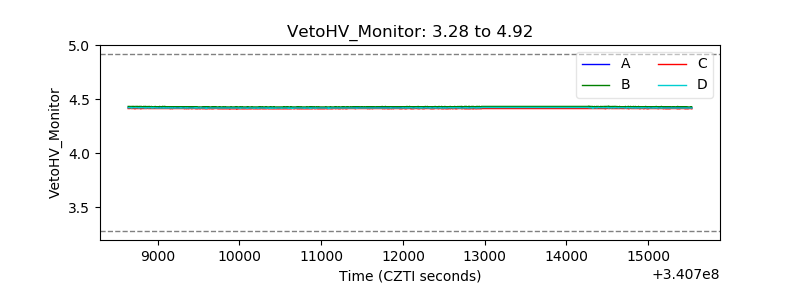 |
| Veto LLD | 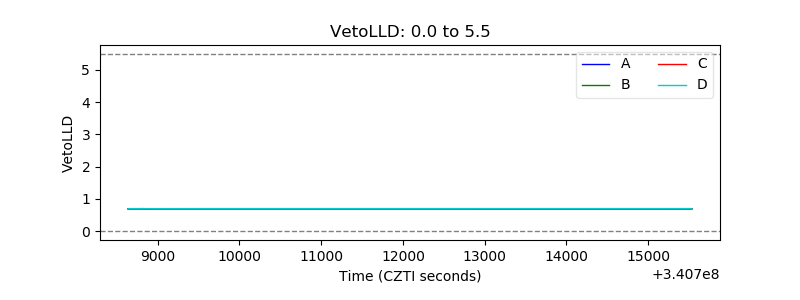 |
| Alpha Counter | 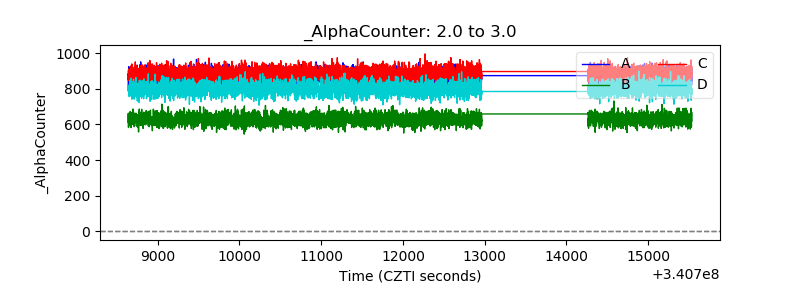 |
| _CPM_Rate | 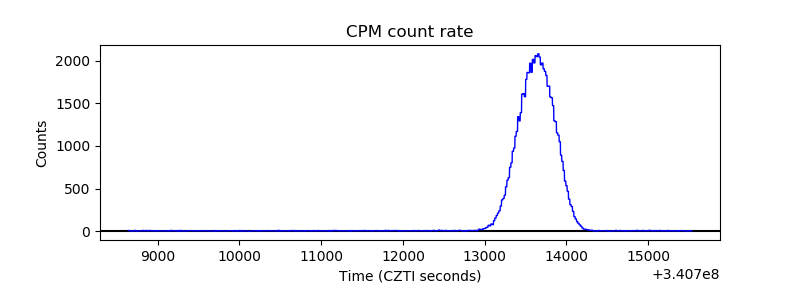 |
| CZT Counter | 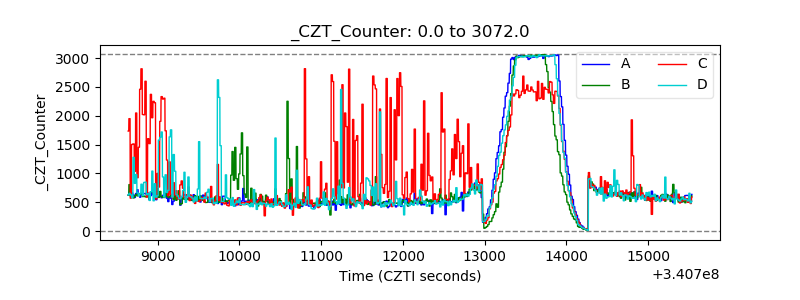 |
| +2.5 Volts monitor |  |
| +5 Volts monitor |  |
| _ROLL_ROT | 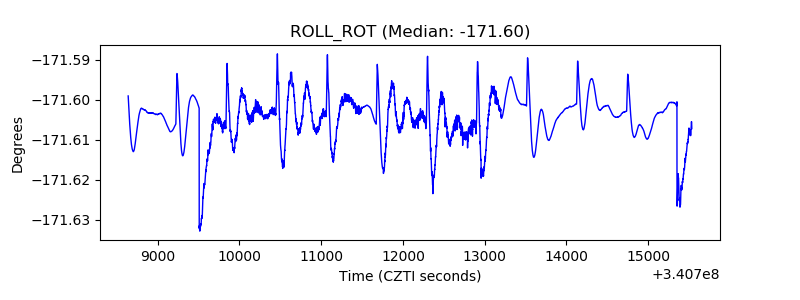 |
| _Roll_DEC | 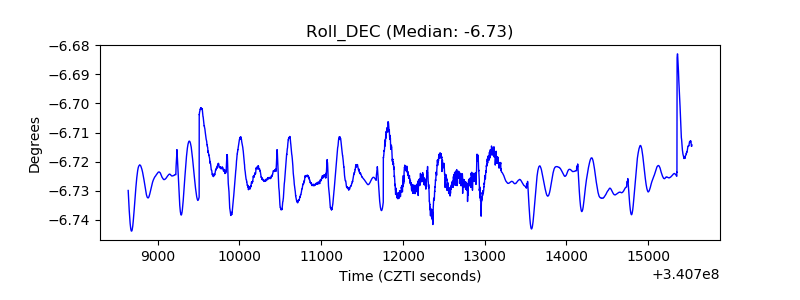 |
| _Roll_RA | 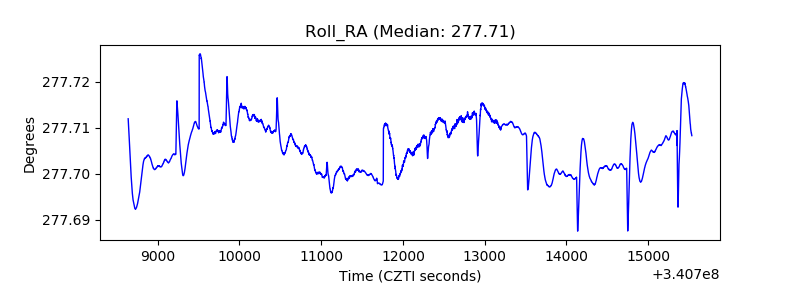 |
| Veto Counter | 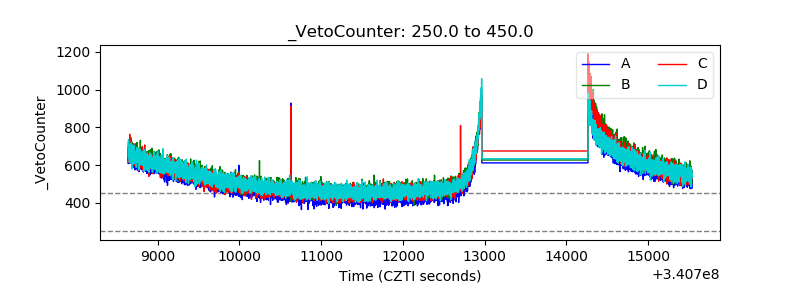 |