| Param | Original file | Final file |
|---|---|---|
| Filename | modeM0/AS1T03_255T01_9000003922_27344cztM0_level2.evt | modeM0/AS1T03_255T01_9000003922_27344cztM0_level2_quad_clean.evt |
| Size (bytes) | 520,436,160 | 110,482,560 |
| Size | 496.3 MB | 105.4 MB |
| Events in quadrant A | 3,361,777 | 762,621 |
| Events in quadrant B | 3,461,577 | 762,043 |
| Events in quadrant C | 4,250,909 | 691,279 |
| Events in quadrant D | 4,264,254 | 695,030 |
| Mode M9 | |||
|---|---|---|---|
| Quadrant | BADHDUFLAG | Total packets | Discarded packets |
| A | 0 | 13 | 0 |
| B | 0 | 13 | 0 |
| C | 0 | 13 | 0 |
| D | 0 | 13 | 0 |
| Mode M0 | |||
|---|---|---|---|
| Quadrant | BADHDUFLAG | Total packets | Discarded packets |
| A | 0 | 13865 | 0 |
| B | 0 | 14117 | 0 |
| C | 0 | 16585 | 0 |
| D | 0 | 16690 | 0 |
| Quadrant | Total seconds | Saturated seconds | Saturation percentage |
|---|---|---|---|
| A | 6231 | 92 | 1.476489% |
| B | 6230 | 108 | 1.733547% |
| C | 6230 | 496 | 7.961477% |
| D | 6230 | 260 | 4.173355% |
Noise dominated data is calculated using 1-second bins in cleaned event files. If a bin has >2000 counts, and if more than 50% of those come from <1% of pixels, then it is considered to be noise-dominated and hence unusable.
| Quadrant | # 1 sec bins | Bins with >0 counts | Bins with >2000 counts | High rate bins dominated by noise | Noise dominated (total time) | Noise dominated (detector-on time) | Marked lightcurve |
|---|---|---|---|---|---|---|---|
| A | 7531 | 6231 | 5 | 5 | 0.07% | 0.08% | 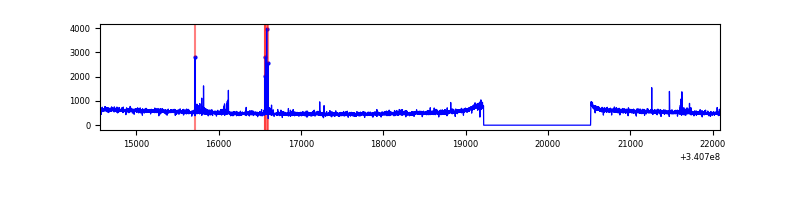 |
| B | 7530 | 6230 | 12 | 12 | 0.16% | 0.19% | 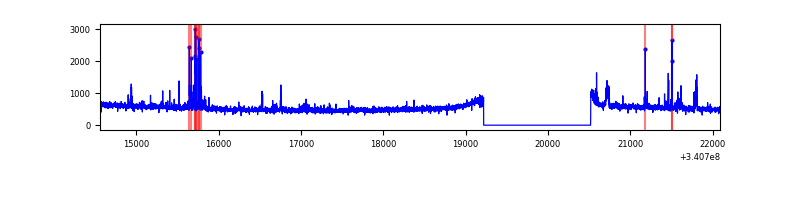 |
| C | 7530 | 6230 | 244 | 244 | 3.24% | 3.92% | 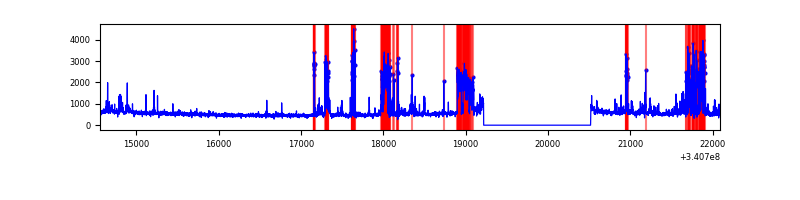 |
| D | 7530 | 6231 | 171 | 171 | 2.27% | 2.74% | 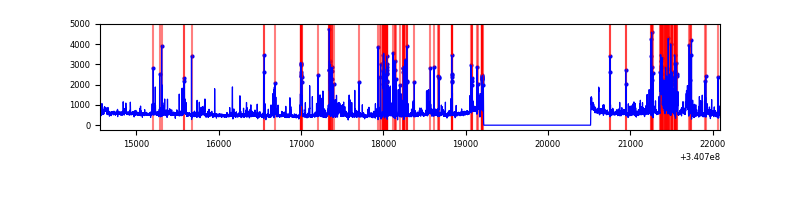 |
Top three noisy pixels from each quadrant. If the there are fewer than three noisy pixels in the level2.evt file, extra rows are filled as -1
| Pixel properties | Quadrant properties | ||||||
|---|---|---|---|---|---|---|---|
| Quadrant | DetID | PixID | Counts | Sigma | Mean | Median | Sigma |
| A | 13 | 248 | 48781 | 280.78 | 857 | 845 | 170.7 |
| A | 13 | 254 | 10272 | 55.22 | 857 | 845 | 170.7 |
| A | 0 | 226 | 7735 | 40.36 | 857 | 845 | 170.7 |
| B | 5 | 172 | 73927 | 464.47 | 839 | 822 | 157.4 |
| B | 0 | 190 | 61112 | 383.05 | 839 | 822 | 157.4 |
| B | 12 | 111 | 17789 | 107.8 | 839 | 822 | 157.4 |
| C | 2 | 16 | 751096 | 4197.3 | 771 | 778 | 178.8 |
| C | 8 | 208 | 339461 | 1894.6 | 771 | 778 | 178.8 |
| C | 14 | 238 | 125913 | 700.01 | 771 | 778 | 178.8 |
| D | 1 | 52 | 828100 | 4135.77 | 799 | 783 | 200.0 |
| D | 2 | 250 | 222941 | 1110.57 | 799 | 783 | 200.0 |
| D | 10 | 103 | 66715 | 329.6 | 799 | 783 | 200.0 |
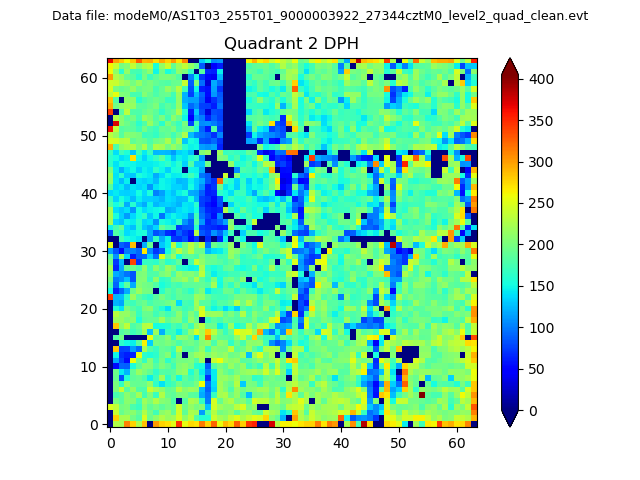
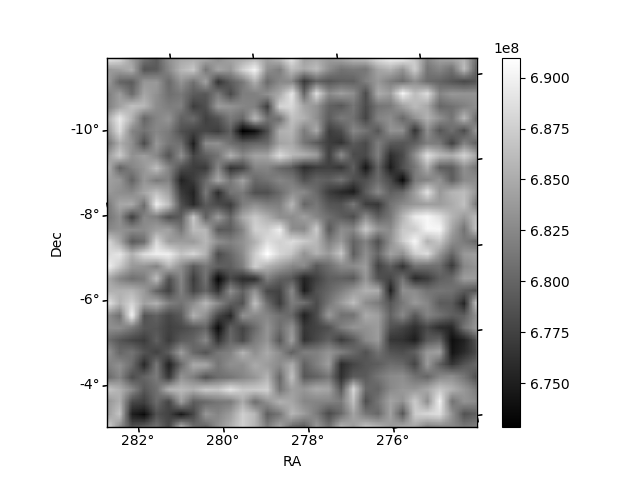
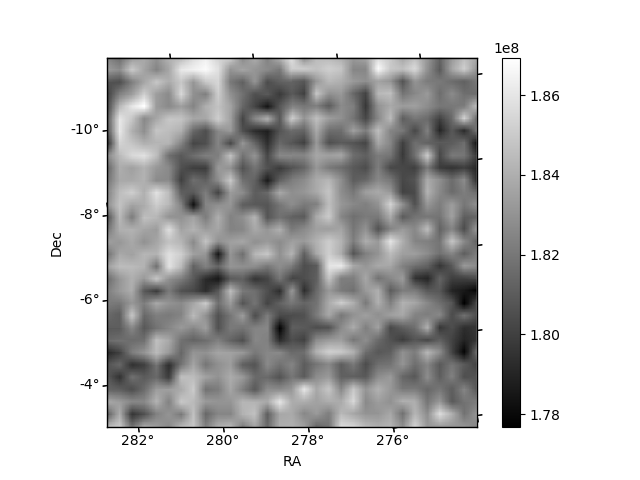
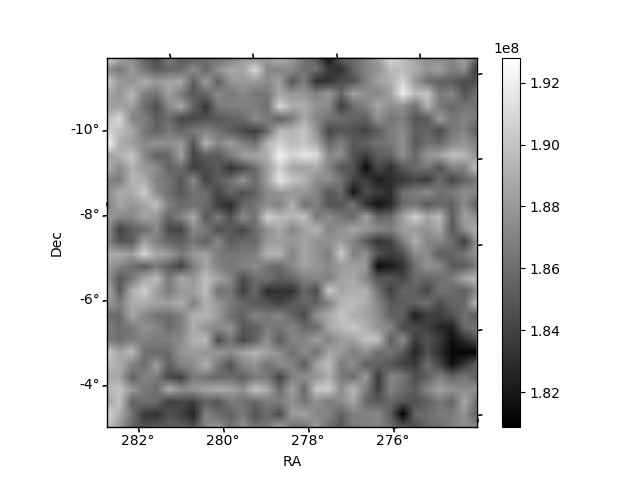
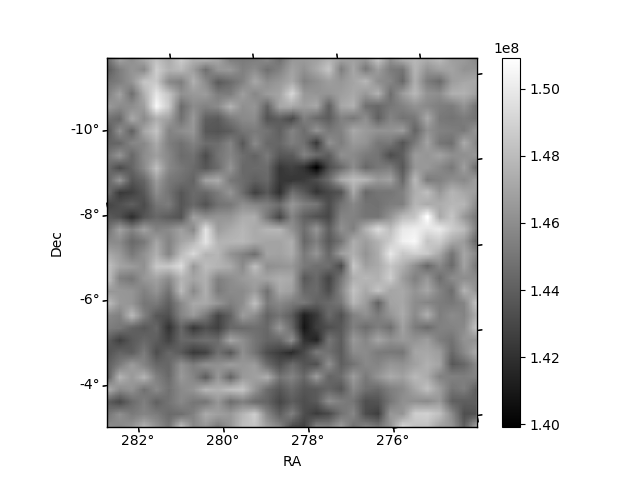
Histogram calculated using DETX and DETY for each event in the final _common_clean file
| Quadrant A | 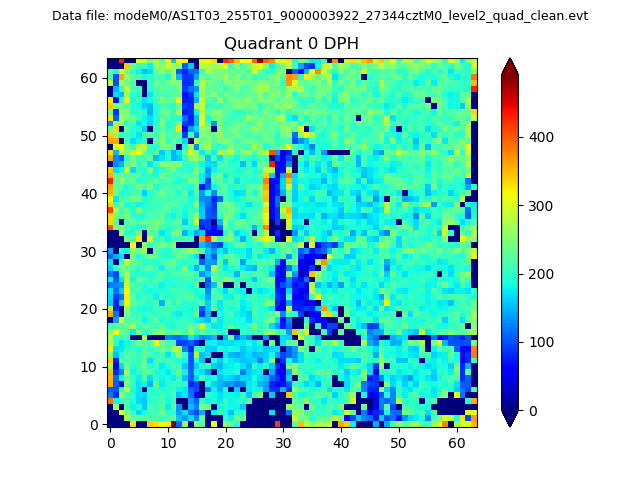 |
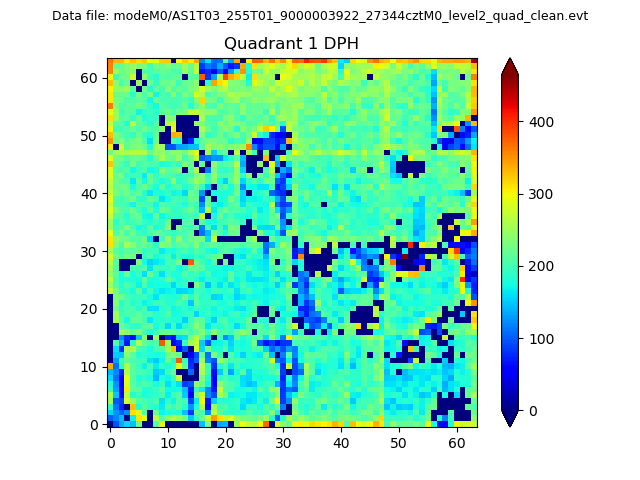 |
Quadrant B |
|---|---|---|---|
| Quadrant D | 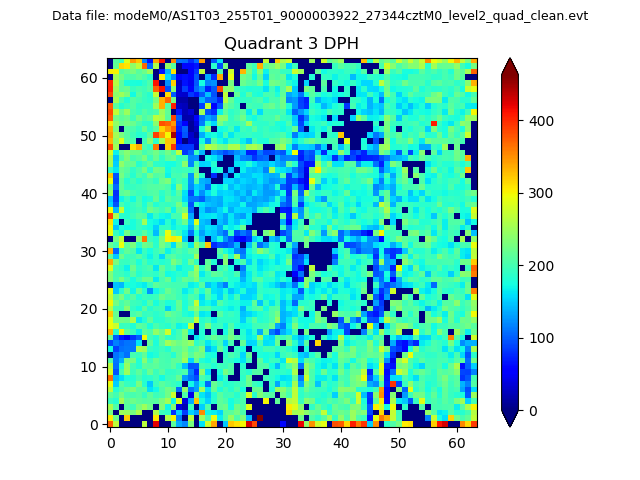 |
 |
Quadrant C |
| Plot type | Count rate plots | Images |
|---|---|---|
| Comparison with Poisson distribution Blue bars denote a histogram of data divided into 1 sec bins. Red curve is a Poisson curve with rate = median count rate of data. |
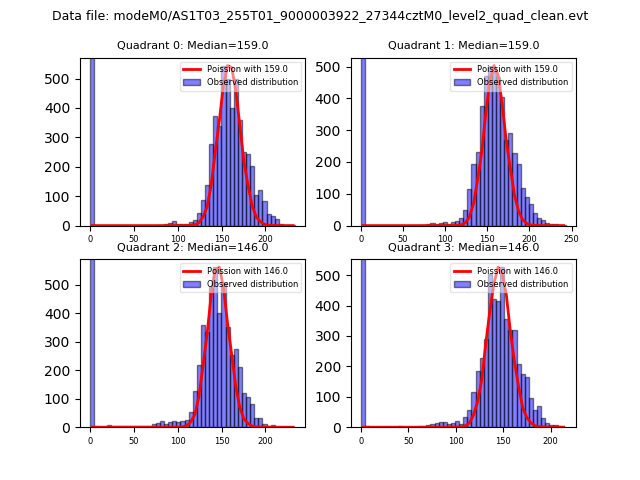 |
 |
| Quadrant-wise count rates Data is divided into 100 sec bins |
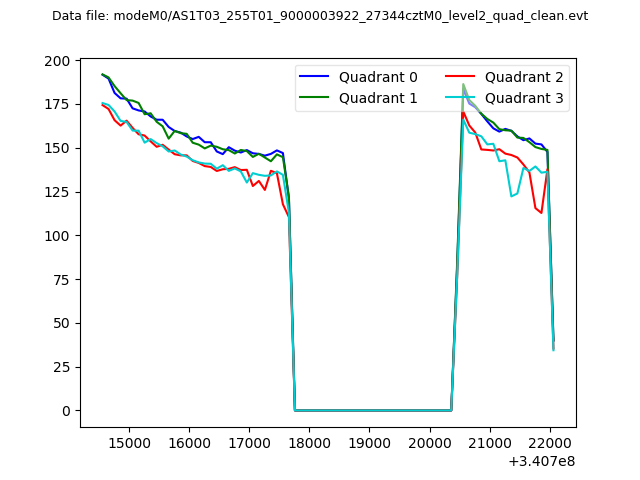 |
|
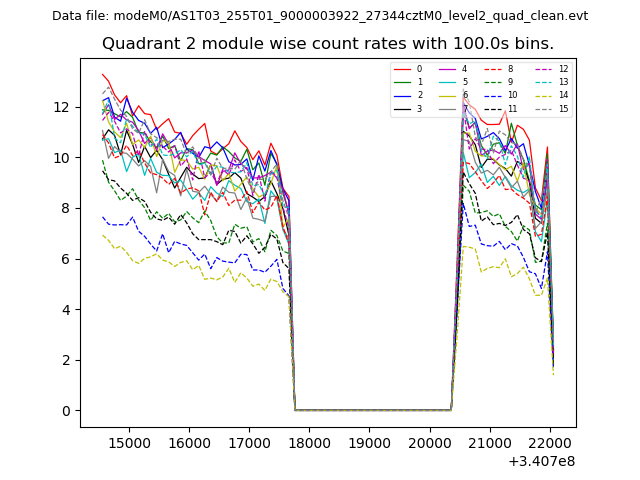
| Module-wise count rates for Quadrant A Data is divided into 100 sec bins |
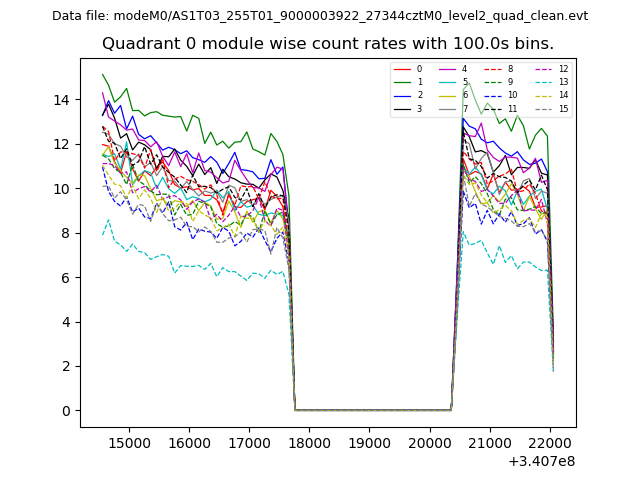 |
 |
| Module-wise count rates for Quadrant B Data is divided into 100 sec bins |
 |
 |
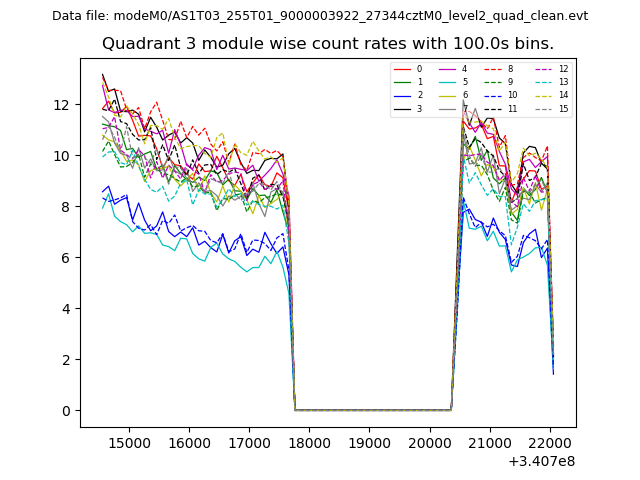
| Module-wise count rates for Quadrant C Data is divided into 100 sec bins |
 |
 |
| Module-wise count rates for Quadrant D Data is divided into 100 sec bins |
 |
 |
| Parameter | Plot |
|---|---|
| CZT HV Monitor |  |
| D_VDD | 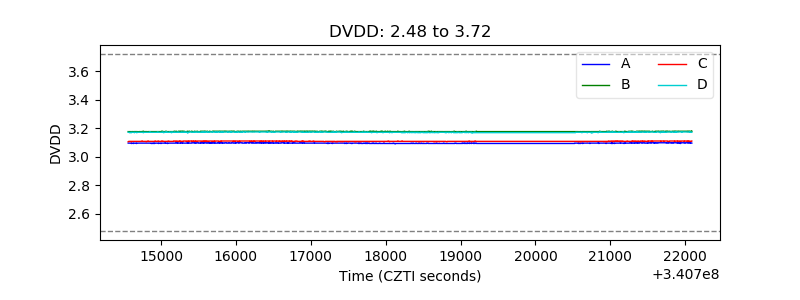 |
| Temperature 1 | 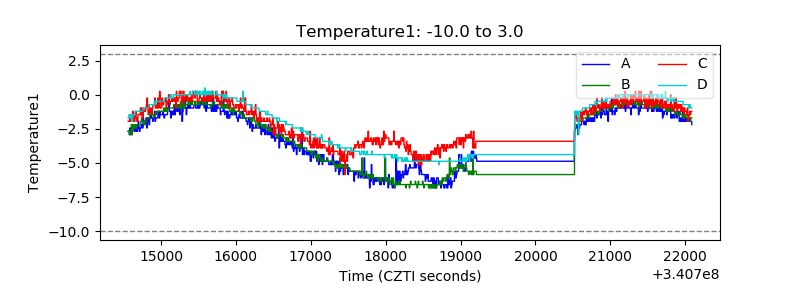 |
| Veto HV Monitor | 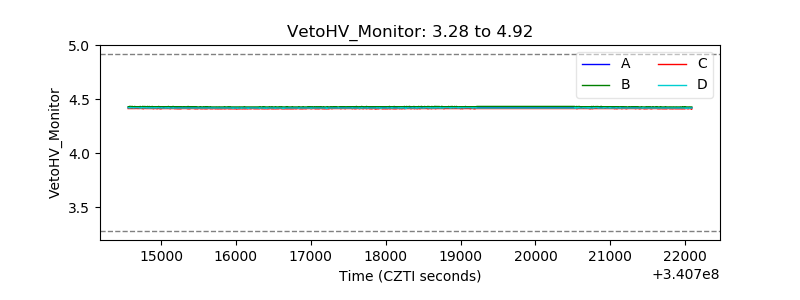 |
| Veto LLD | 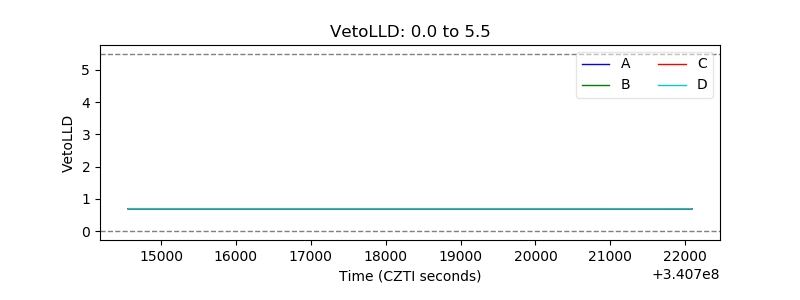 |
| Alpha Counter | 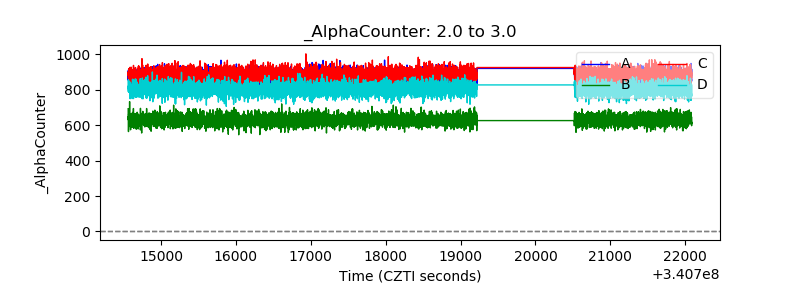 |
| _CPM_Rate | 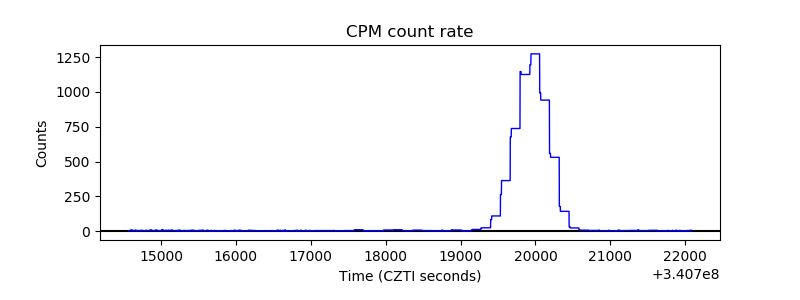 |
| CZT Counter |  |
| +2.5 Volts monitor |  |
| +5 Volts monitor |  |
| _ROLL_ROT | 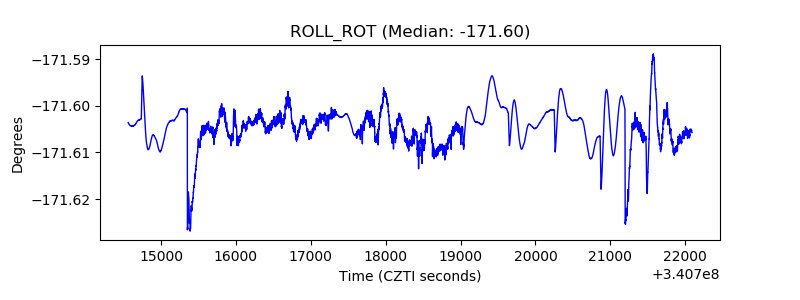 |
| _Roll_DEC | 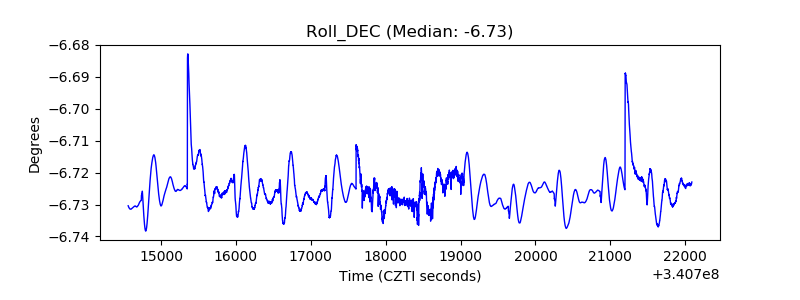 |
| _Roll_RA | 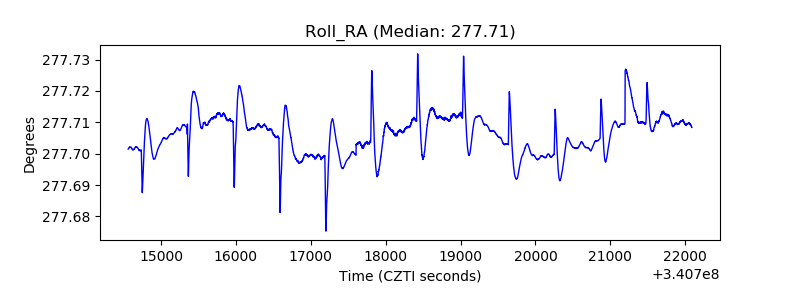 |
| Veto Counter | 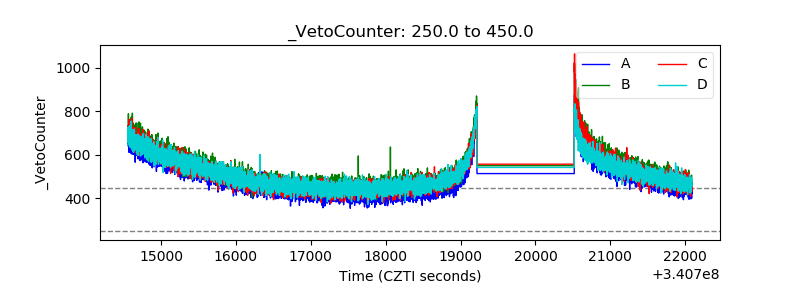 |