| Param | Original file | Final file |
|---|---|---|
| Filename | modeM0/AS1T03_255T01_9000003922_27345cztM0_level2.evt | modeM0/AS1T03_255T01_9000003922_27345cztM0_level2_quad_clean.evt |
| Size (bytes) | 581,555,520 | 81,408,960 |
| Size | 554.6 MB | 77.6 MB |
| Events in quadrant A | 2,969,493 | 549,451 |
| Events in quadrant B | 3,279,916 | 546,324 |
| Events in quadrant C | 5,781,965 | 483,467 |
| Events in quadrant D | 5,184,727 | 476,883 |
| Mode M9 | |||
|---|---|---|---|
| Quadrant | BADHDUFLAG | Total packets | Discarded packets |
| A | 0 | 11 | 0 |
| B | 0 | 11 | 0 |
| C | 0 | 11 | 0 |
| D | 0 | 11 | 0 |
| Mode M0 | |||
|---|---|---|---|
| Quadrant | BADHDUFLAG | Total packets | Discarded packets |
| A | 0 | 12464 | 0 |
| B | 0 | 13388 | 0 |
| C | 0 | 21017 | 0 |
| D | 0 | 19227 | 0 |
| Quadrant | Total seconds | Saturated seconds | Saturation percentage |
|---|---|---|---|
| A | 5853 | 82 | 1.400991% |
| B | 5853 | 145 | 2.477362% |
| C | 5853 | 1119 | 19.118401% |
| D | 5854 | 620 | 10.591049% |
Noise dominated data is calculated using 1-second bins in cleaned event files. If a bin has >2000 counts, and if more than 50% of those come from <1% of pixels, then it is considered to be noise-dominated and hence unusable.
| Quadrant | # 1 sec bins | Bins with >0 counts | Bins with >2000 counts | High rate bins dominated by noise | Noise dominated (total time) | Noise dominated (detector-on time) | Marked lightcurve |
|---|---|---|---|---|---|---|---|
| A | 6933 | 5854 | 1 | 1 | 0.01% | 0.02% | 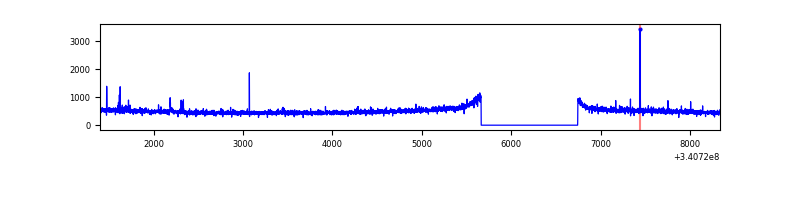 |
| B | 6933 | 5854 | 46 | 46 | 0.66% | 0.79% | 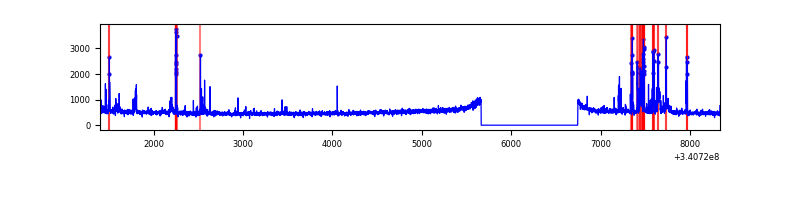 |
| C | 6933 | 5854 | 741 | 741 | 10.69% | 12.66% | 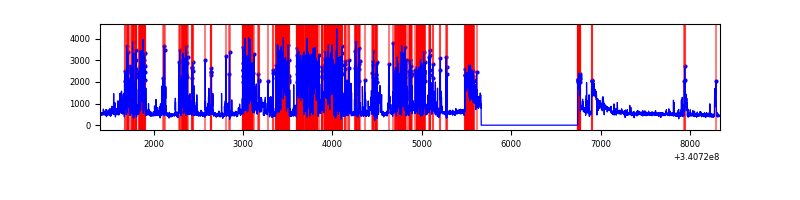 |
| D | 6934 | 5854 | 534 | 534 | 7.70% | 9.12% | 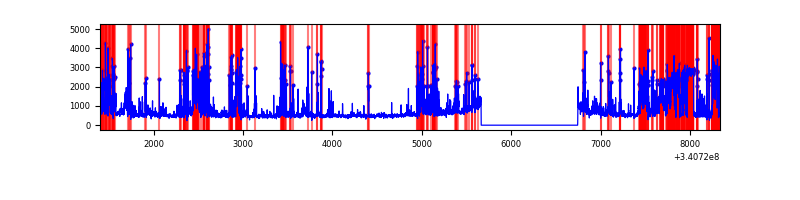 |
Top three noisy pixels from each quadrant. If the there are fewer than three noisy pixels in the level2.evt file, extra rows are filled as -1
| Pixel properties | Quadrant properties | ||||||
|---|---|---|---|---|---|---|---|
| Quadrant | DetID | PixID | Counts | Sigma | Mean | Median | Sigma |
| A | 13 | 248 | 27150 | 172.64 | 759 | 746 | 152.9 |
| A | 13 | 254 | 10232 | 62.02 | 759 | 746 | 152.9 |
| A | 0 | 226 | 6668 | 38.72 | 759 | 746 | 152.9 |
| B | 5 | 172 | 244726 | 1716.62 | 748 | 731 | 142.1 |
| B | 10 | 245 | 55288 | 383.83 | 748 | 731 | 142.1 |
| B | 0 | 190 | 24772 | 169.14 | 748 | 731 | 142.1 |
| C | 2 | 16 | 1842361 | 11919.66 | 658 | 663 | 154.5 |
| C | 8 | 208 | 1181903 | 7645.11 | 658 | 663 | 154.5 |
| C | 14 | 238 | 104269 | 670.55 | 658 | 663 | 154.5 |
| D | 1 | 52 | 1859746 | 10291.83 | 697 | 681 | 180.6 |
| D | 2 | 250 | 361686 | 1998.53 | 697 | 681 | 180.6 |
| D | 15 | 0 | 189178 | 1043.52 | 697 | 681 | 180.6 |
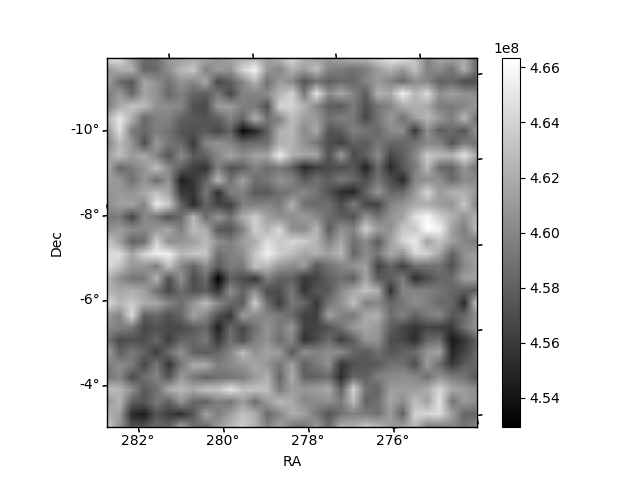
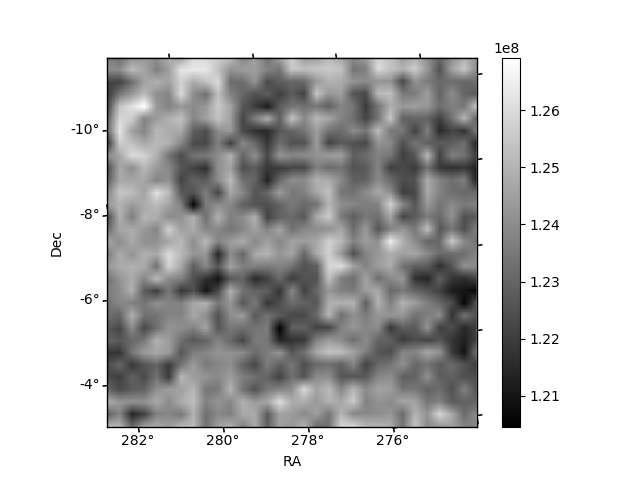
Histogram calculated using DETX and DETY for each event in the final _common_clean file
| Quadrant A | 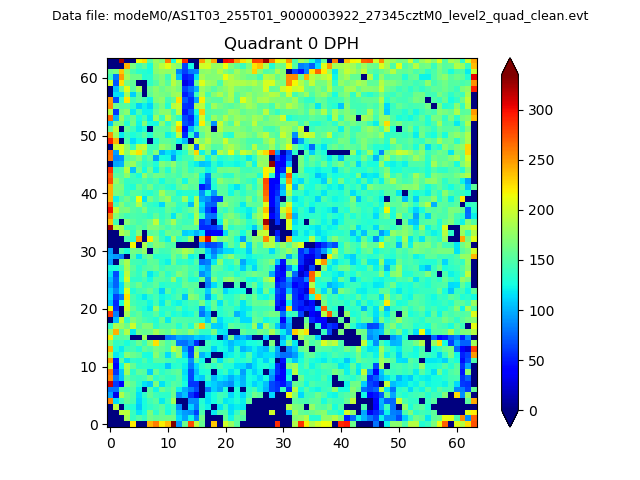 |
 |
Quadrant B |
|---|---|---|---|
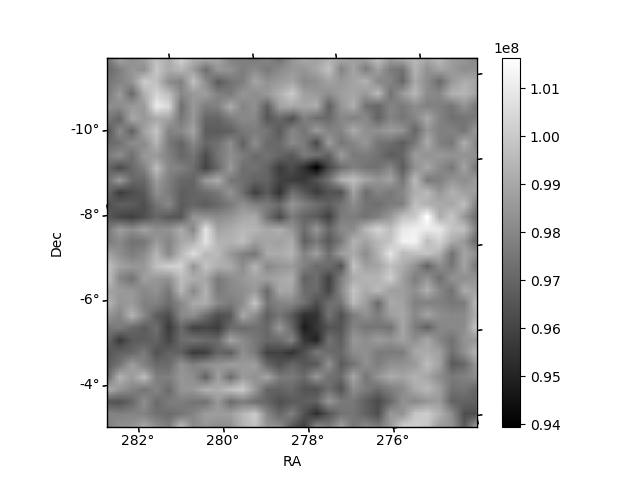
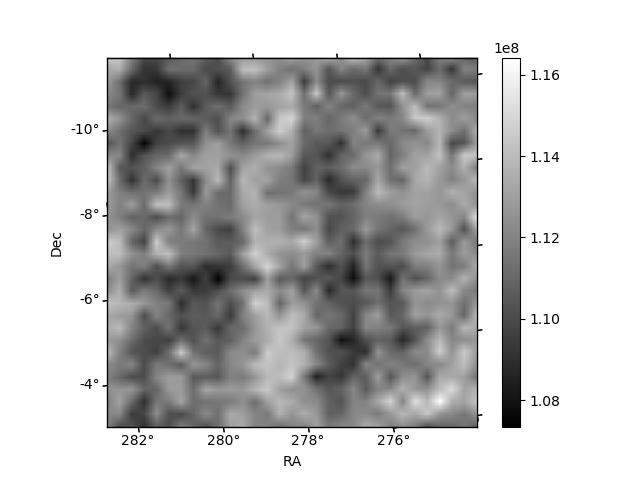
| Quadrant D | 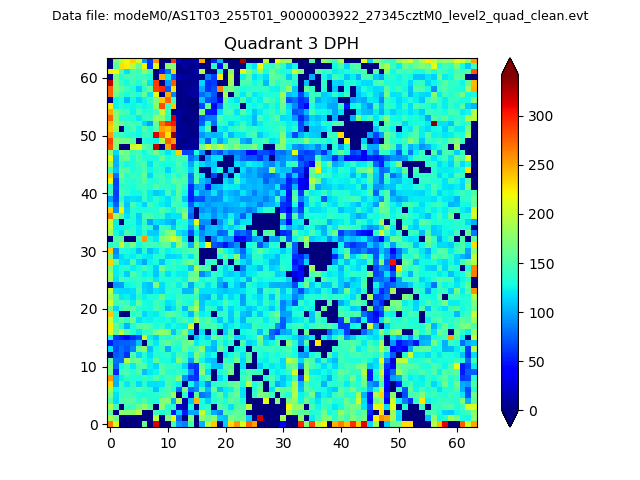 |
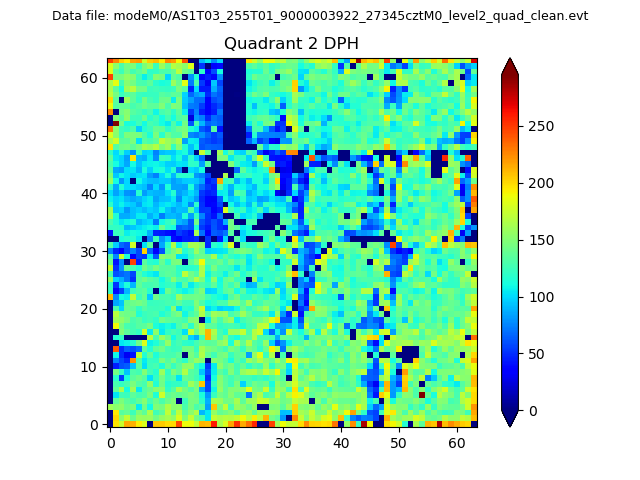 |
Quadrant C |
| Plot type | Count rate plots | Images |
|---|---|---|
| Comparison with Poisson distribution Blue bars denote a histogram of data divided into 1 sec bins. Red curve is a Poisson curve with rate = median count rate of data. |
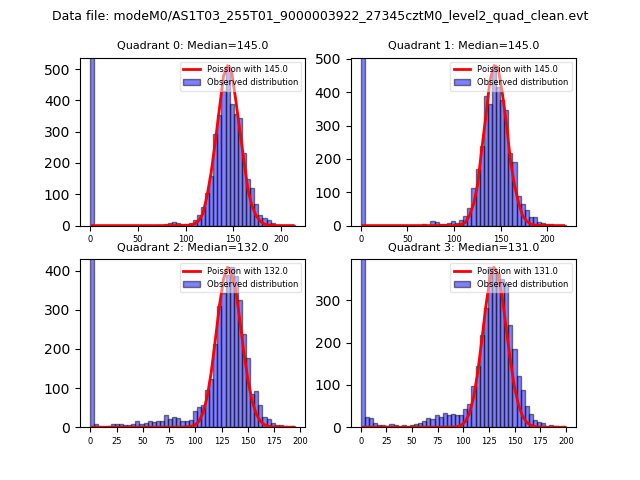 |
 |
| Quadrant-wise count rates Data is divided into 100 sec bins |
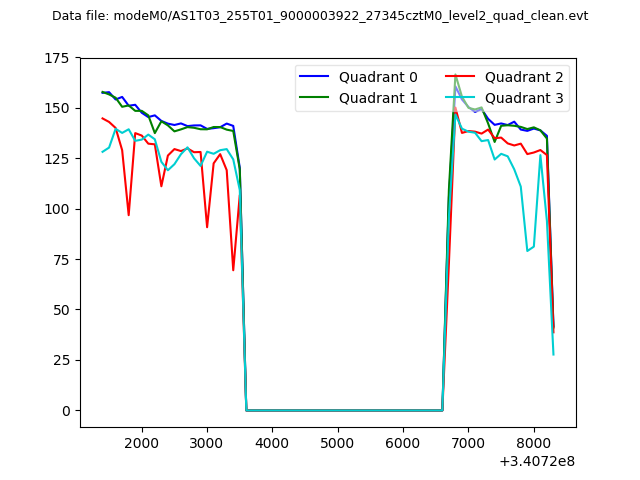 |
|
| Module-wise count rates for Quadrant A Data is divided into 100 sec bins |
 |
 |
| Module-wise count rates for Quadrant B Data is divided into 100 sec bins |
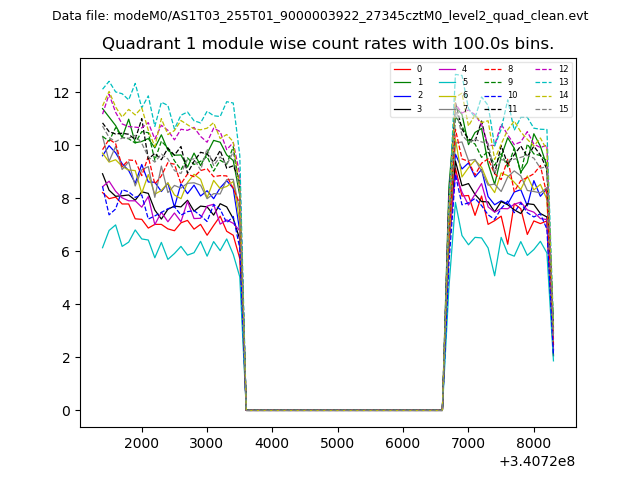 |
 |
| Module-wise count rates for Quadrant C Data is divided into 100 sec bins |
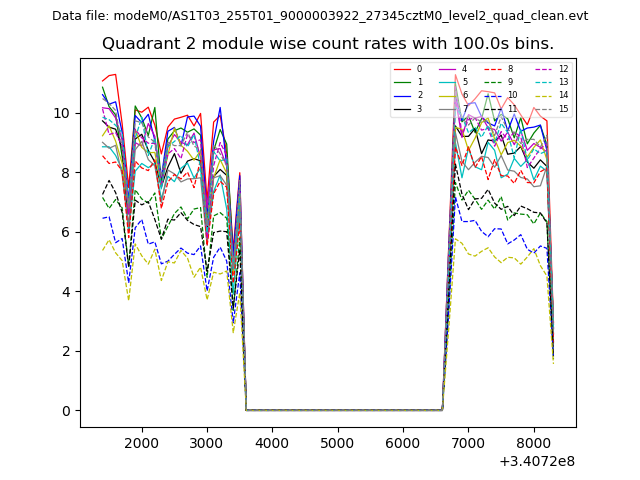 |
 |
| Module-wise count rates for Quadrant D Data is divided into 100 sec bins |
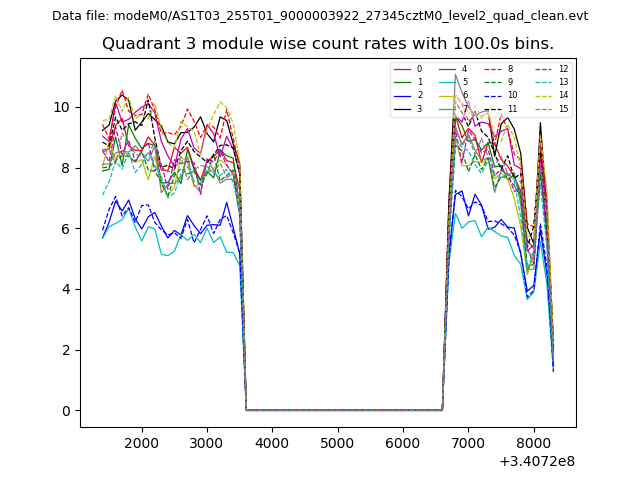 |
 |
| Parameter | Plot |
|---|---|
| CZT HV Monitor |  |
| D_VDD |  |
| Temperature 1 | 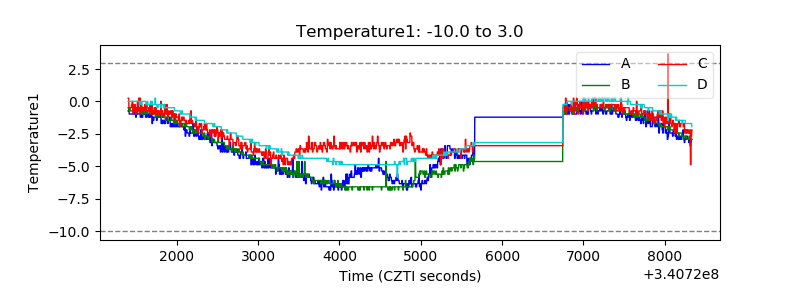 |
| Veto HV Monitor | 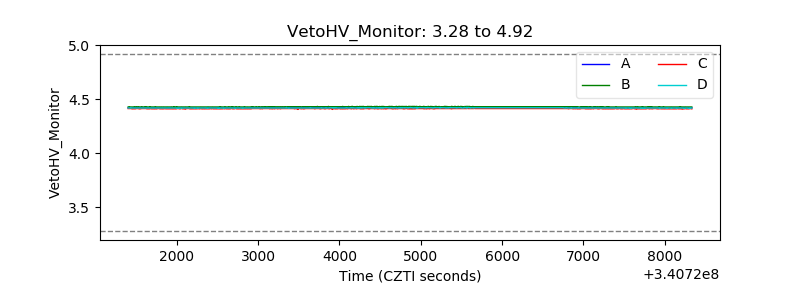 |
| Veto LLD | 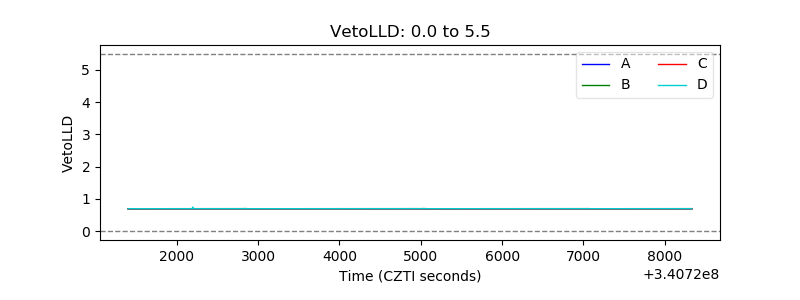 |
| Alpha Counter | 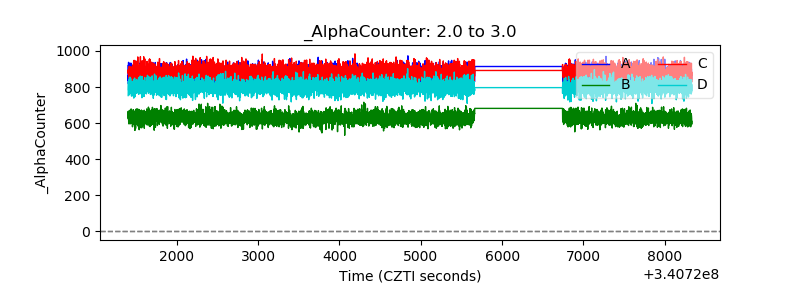 |
| _CPM_Rate | 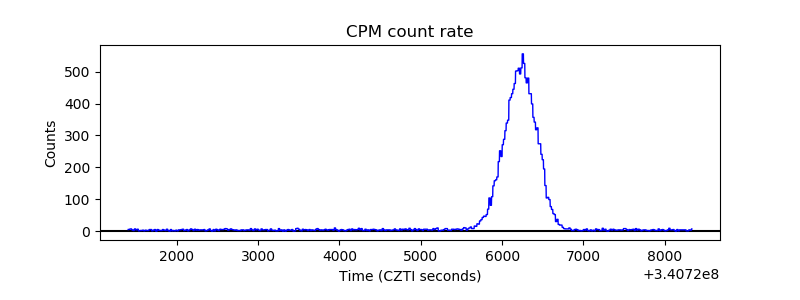 |
| CZT Counter | 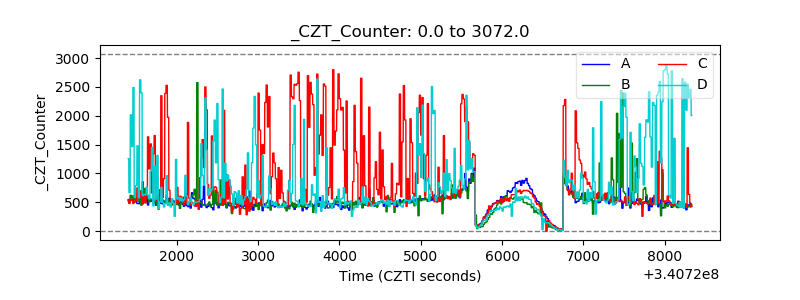 |
| +2.5 Volts monitor |  |
| +5 Volts monitor | 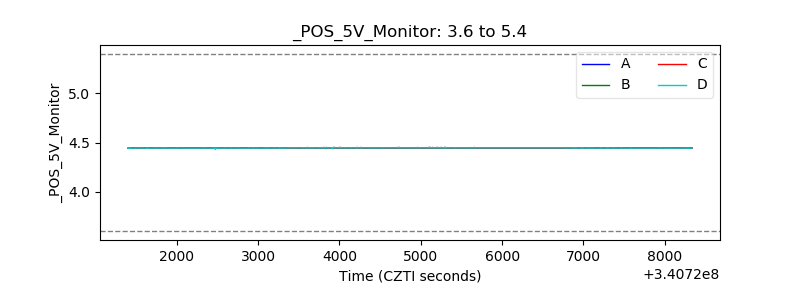 |
| _ROLL_ROT | 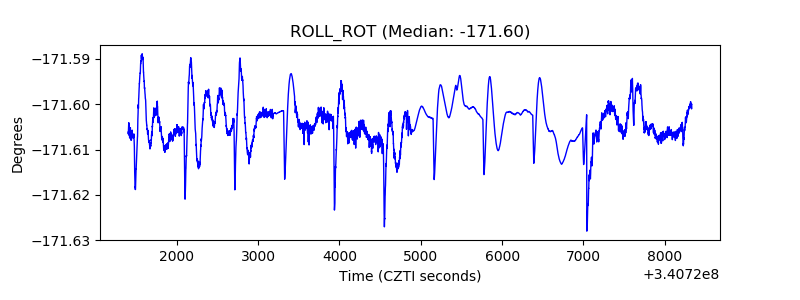 |
| _Roll_DEC | 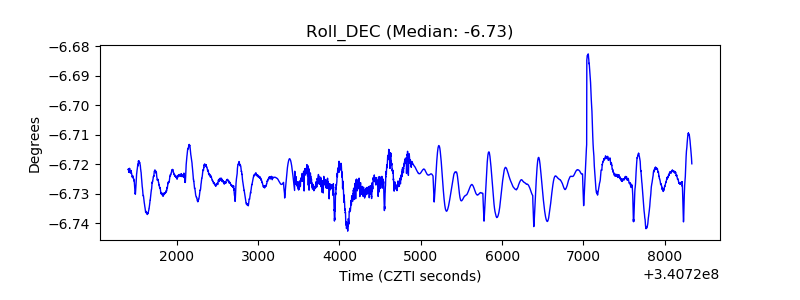 |
| _Roll_RA | 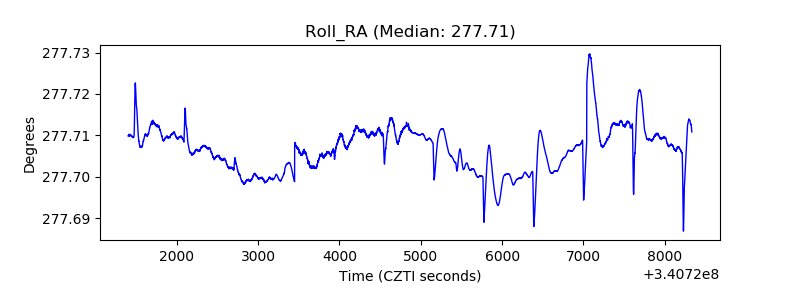 |
| Veto Counter | 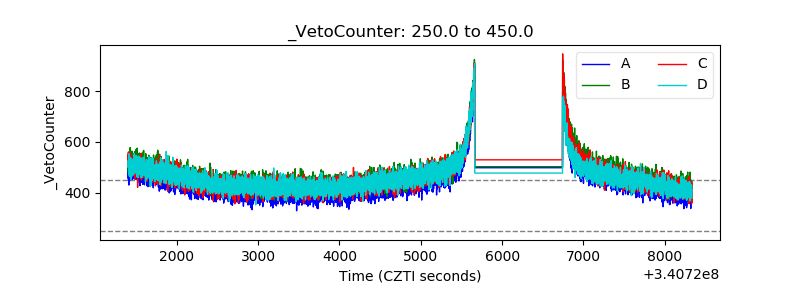 |