| Param | Original file | Final file |
|---|---|---|
| Filename | modeM0/AS1T03_255T01_9000003922_27347cztM0_level2.evt | modeM0/AS1T03_255T01_9000003922_27347cztM0_level2_quad_clean.evt |
| Size (bytes) | 585,576,000 | 96,036,480 |
| Size | 558.4 MB | 91.6 MB |
| Events in quadrant A | 3,347,410 | 630,450 |
| Events in quadrant B | 4,100,373 | 621,261 |
| Events in quadrant C | 4,747,247 | 591,195 |
| Events in quadrant D | 5,068,877 | 581,686 |
| Mode M9 | |||
|---|---|---|---|
| Quadrant | BADHDUFLAG | Total packets | Discarded packets |
| A | 0 | 3 | 0 |
| B | 0 | 3 | 0 |
| C | 0 | 3 | 0 |
| D | 0 | 3 | 0 |
| Mode M0 | |||
|---|---|---|---|
| Quadrant | BADHDUFLAG | Total packets | Discarded packets |
| A | 0 | 14389 | 0 |
| B | 0 | 16674 | 0 |
| C | 0 | 18859 | 0 |
| D | 0 | 19645 | 0 |
| Quadrant | Total seconds | Saturated seconds | Saturation percentage |
|---|---|---|---|
| A | 6936 | 48 | 0.692042% |
| B | 6936 | 296 | 4.267589% |
| C | 6936 | 565 | 8.145905% |
| D | 6937 | 222 | 3.200231% |
Noise dominated data is calculated using 1-second bins in cleaned event files. If a bin has >2000 counts, and if more than 50% of those come from <1% of pixels, then it is considered to be noise-dominated and hence unusable.
| Quadrant | # 1 sec bins | Bins with >0 counts | Bins with >2000 counts | High rate bins dominated by noise | Noise dominated (total time) | Noise dominated (detector-on time) | Marked lightcurve |
|---|---|---|---|---|---|---|---|
| A | 7276 | 6937 | 1 | 1 | 0.01% | 0.01% | 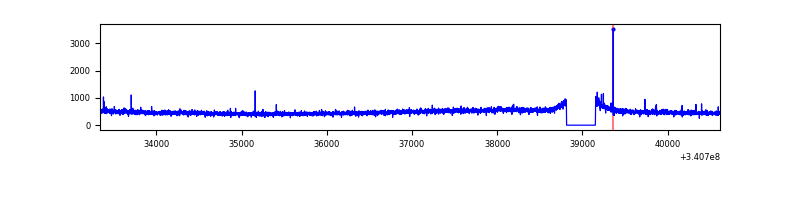 |
| B | 7276 | 6937 | 149 | 149 | 2.05% | 2.15% | 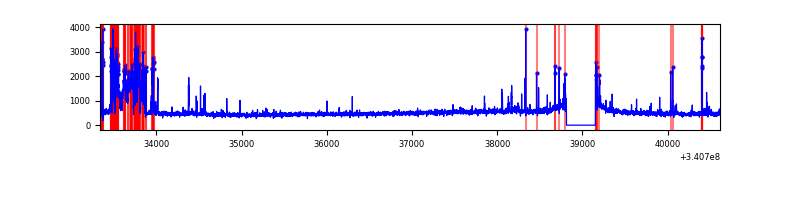 |
| C | 7276 | 6937 | 298 | 298 | 4.10% | 4.30% | 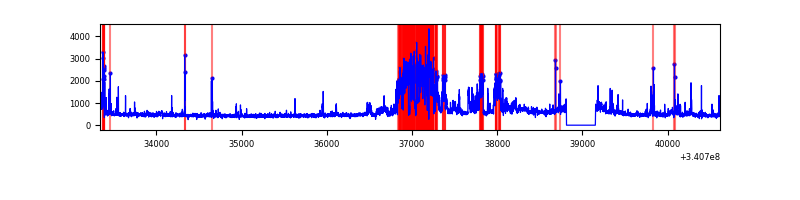 |
| D | 7277 | 6938 | 219 | 219 | 3.01% | 3.16% | 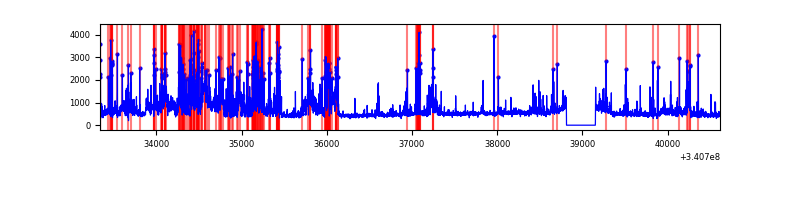 |
Top three noisy pixels from each quadrant. If the there are fewer than three noisy pixels in the level2.evt file, extra rows are filled as -1
| Pixel properties | Quadrant properties | ||||||
|---|---|---|---|---|---|---|---|
| Quadrant | DetID | PixID | Counts | Sigma | Mean | Median | Sigma |
| A | 13 | 254 | 11992 | 63.51 | 862 | 846 | 175.5 |
| A | 13 | 248 | 9687 | 50.38 | 862 | 846 | 175.5 |
| A | 12 | 189 | 9111 | 47.1 | 862 | 846 | 175.5 |
| B | 5 | 172 | 676428 | 4195.1 | 845 | 824 | 161.0 |
| B | 0 | 190 | 45319 | 276.28 | 845 | 824 | 161.0 |
| B | 0 | 229 | 18859 | 111.98 | 845 | 824 | 161.0 |
| C | 8 | 208 | 1239425 | 6630.48 | 793 | 799 | 186.8 |
| C | 2 | 16 | 226590 | 1208.68 | 793 | 799 | 186.8 |
| C | 14 | 238 | 125200 | 665.93 | 793 | 799 | 186.8 |
| D | 1 | 52 | 1465680 | 7028.86 | 814 | 796 | 208.4 |
| D | 2 | 250 | 320296 | 1533.04 | 814 | 796 | 208.4 |
| D | 11 | 176 | 67792 | 321.46 | 814 | 796 | 208.4 |
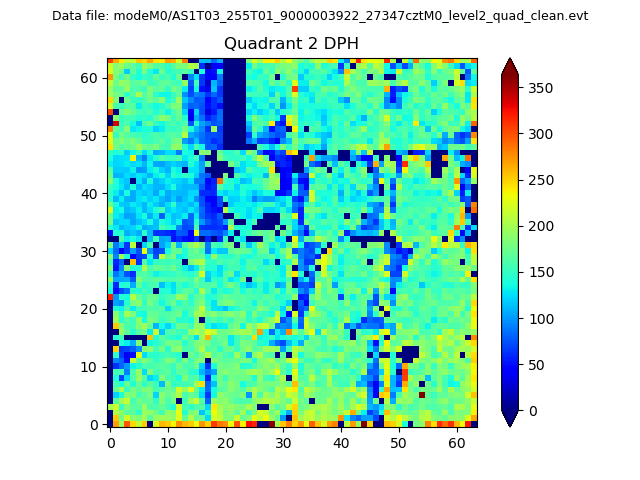
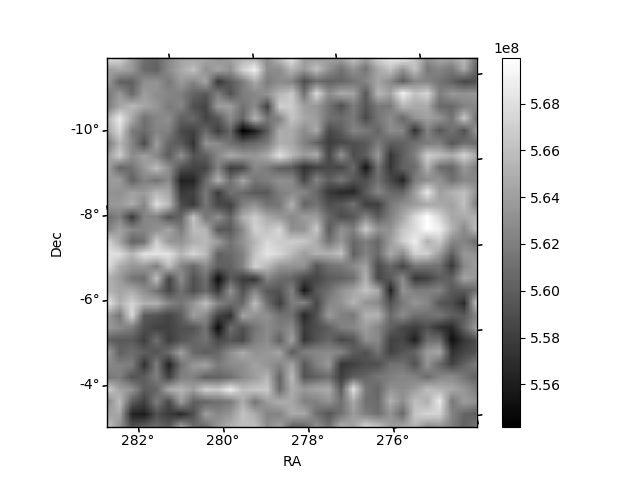
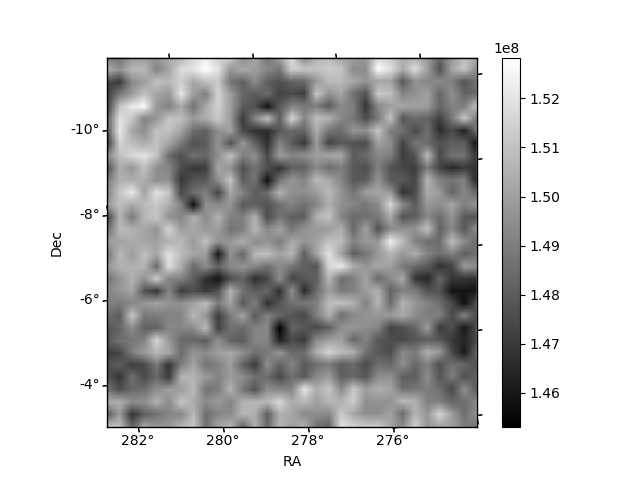
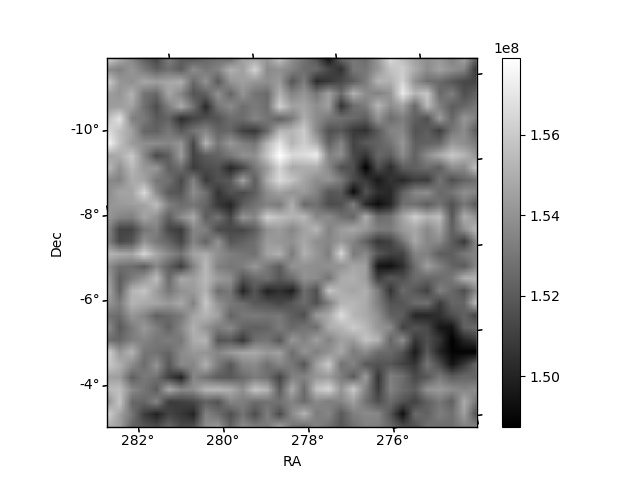
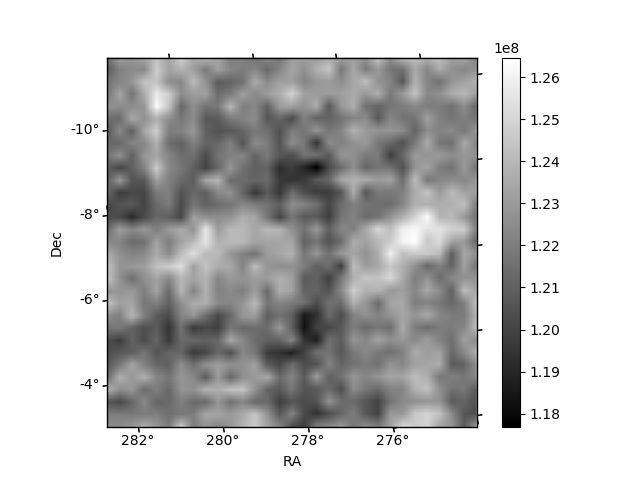
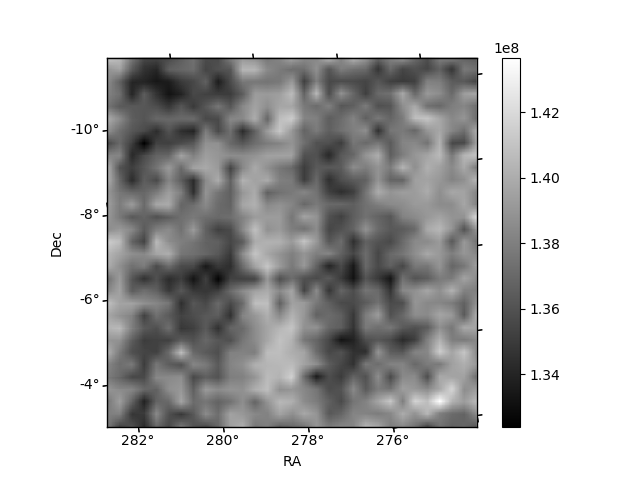
Histogram calculated using DETX and DETY for each event in the final _common_clean file
| Quadrant A | 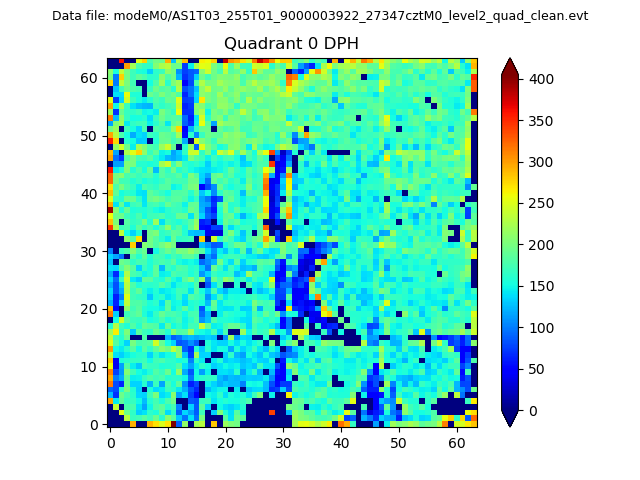 |
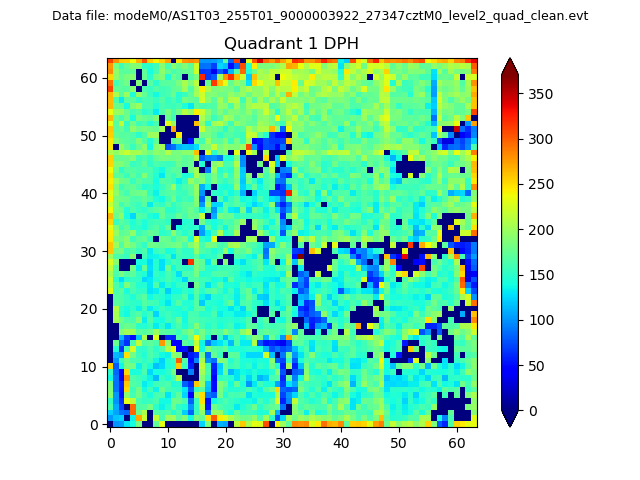 |
Quadrant B |
|---|---|---|---|
| Quadrant D | 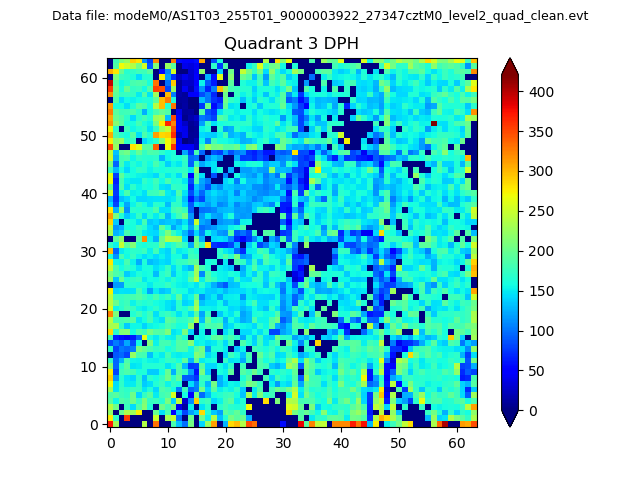 |
 |
Quadrant C |
| Plot type | Count rate plots | Images |
|---|---|---|
| Comparison with Poisson distribution Blue bars denote a histogram of data divided into 1 sec bins. Red curve is a Poisson curve with rate = median count rate of data. |
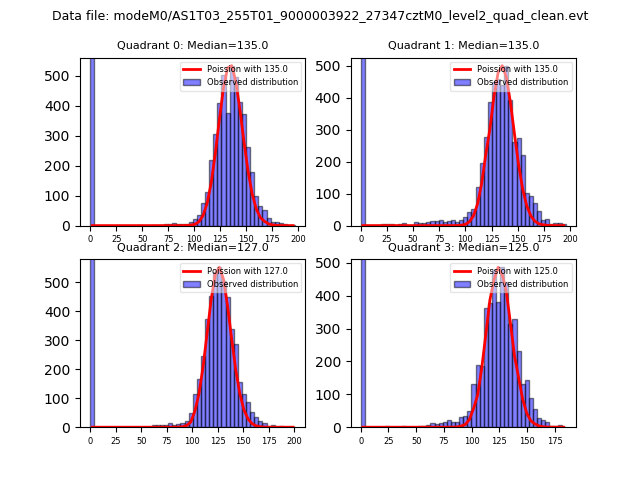 |
 |
| Quadrant-wise count rates Data is divided into 100 sec bins |
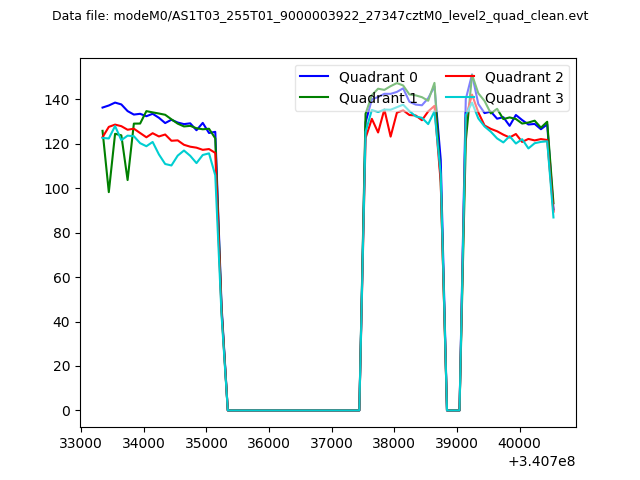 |
|
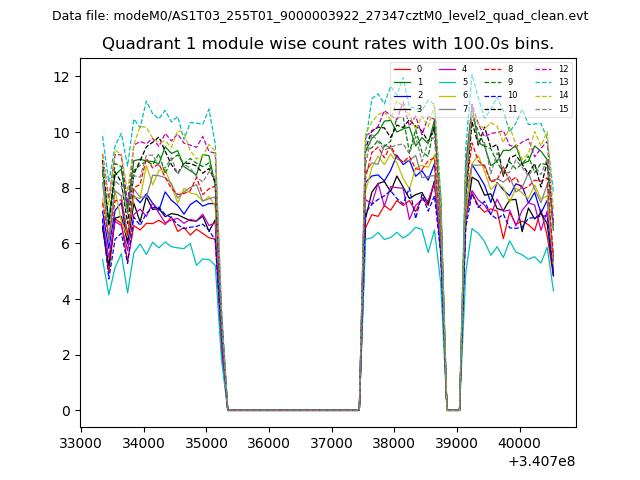
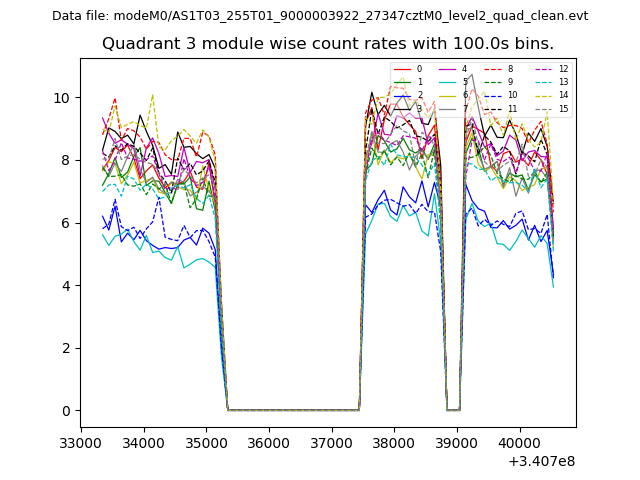
| Module-wise count rates for Quadrant A Data is divided into 100 sec bins |
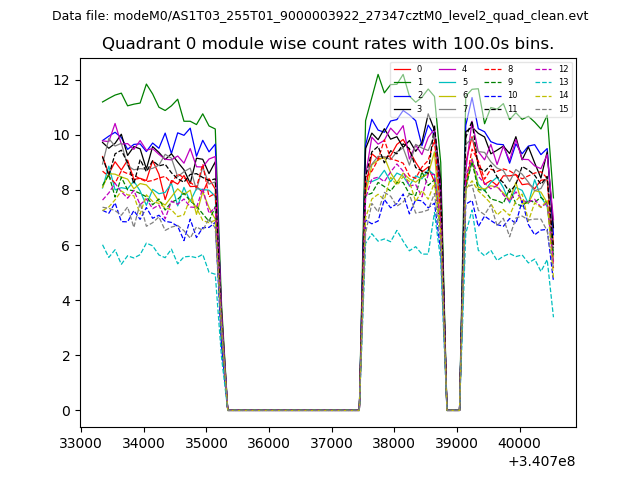 |
 |
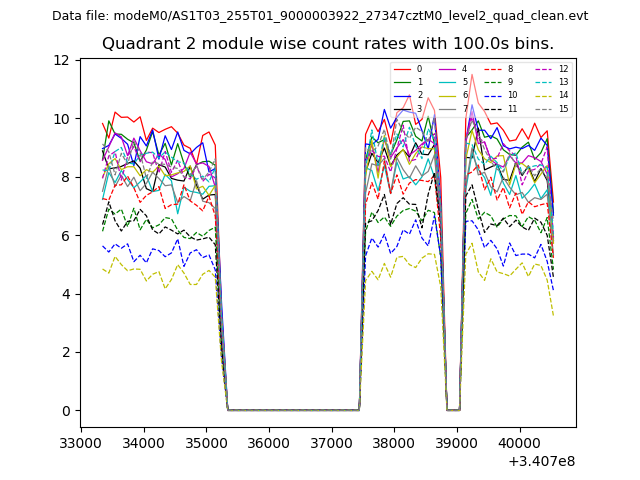
| Module-wise count rates for Quadrant B Data is divided into 100 sec bins |
 |
 |
| Module-wise count rates for Quadrant C Data is divided into 100 sec bins |
 |
 |
| Module-wise count rates for Quadrant D Data is divided into 100 sec bins |
 |
 |
| Parameter | Plot |
|---|---|
| CZT HV Monitor | 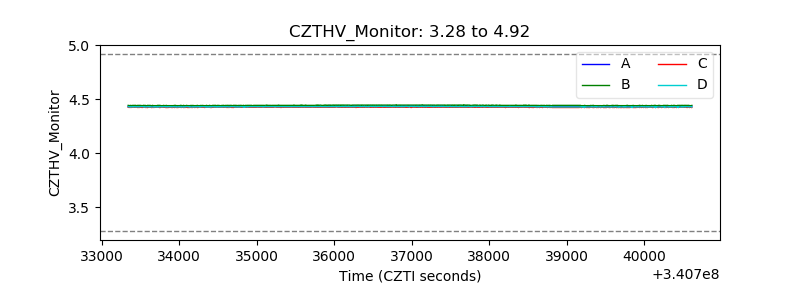 |
| D_VDD | 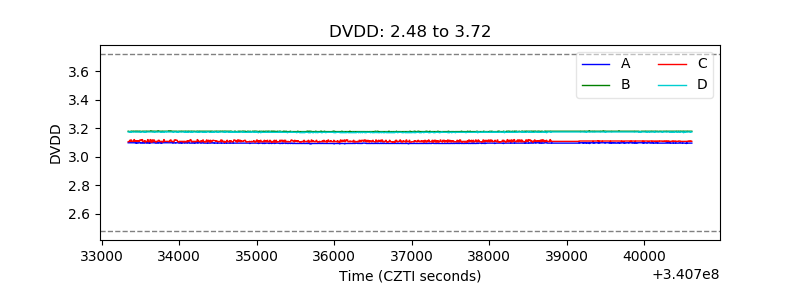 |
| Temperature 1 | 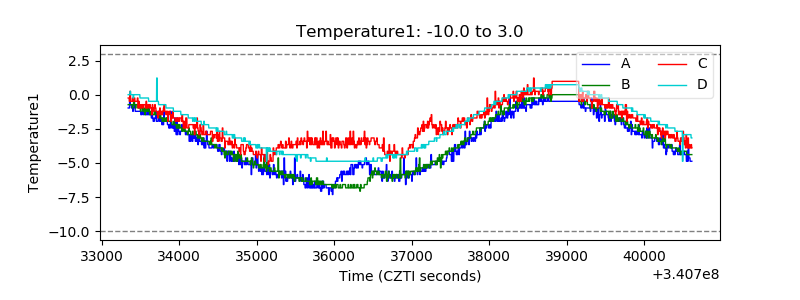 |
| Veto HV Monitor | 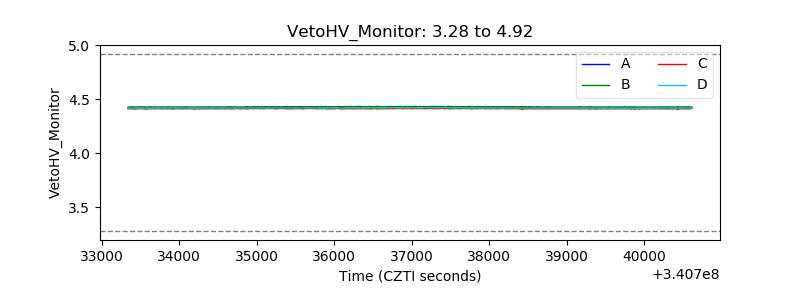 |
| Veto LLD | 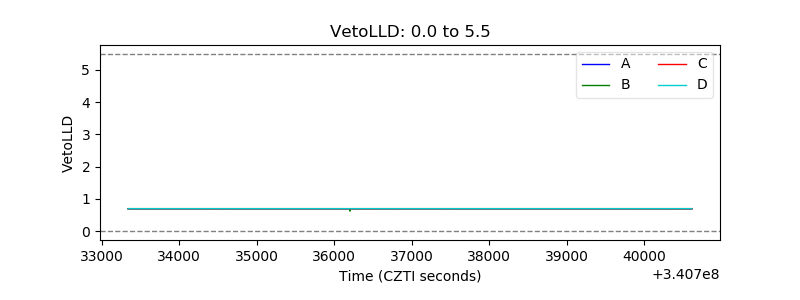 |
| Alpha Counter | 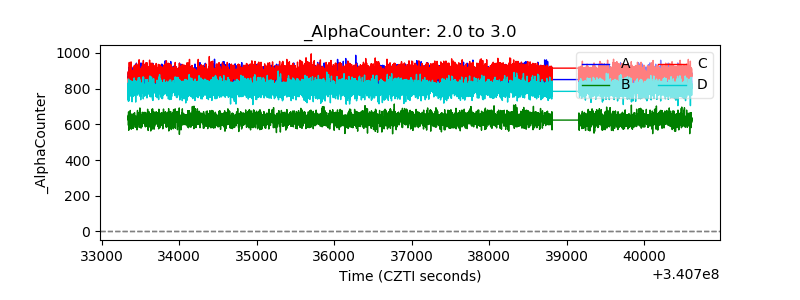 |
| _CPM_Rate | 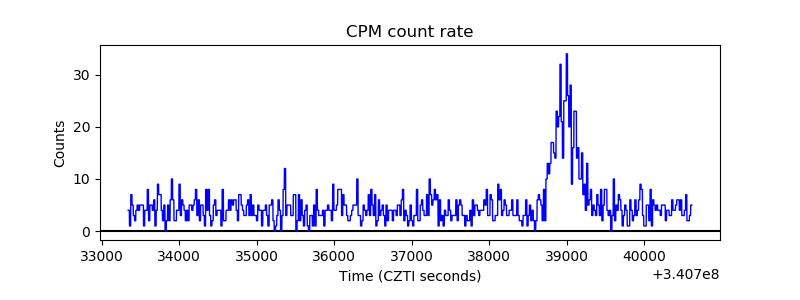 |
| CZT Counter | 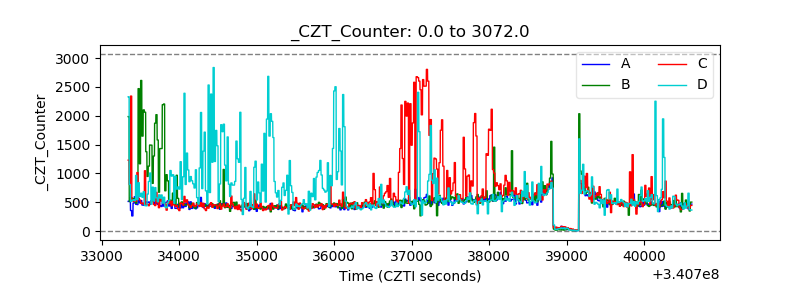 |
| +2.5 Volts monitor | 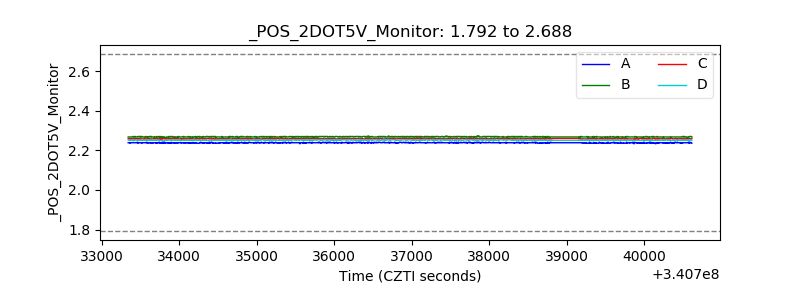 |
| +5 Volts monitor | 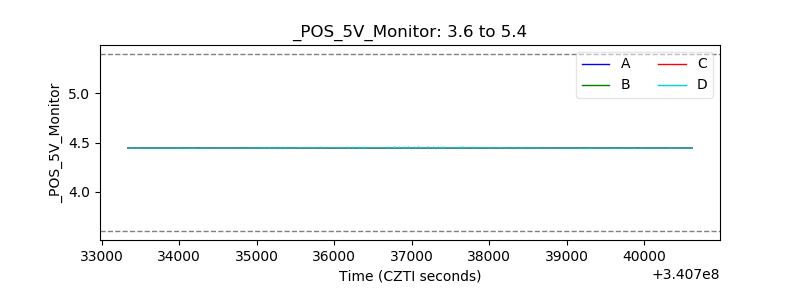 |
| _ROLL_ROT | 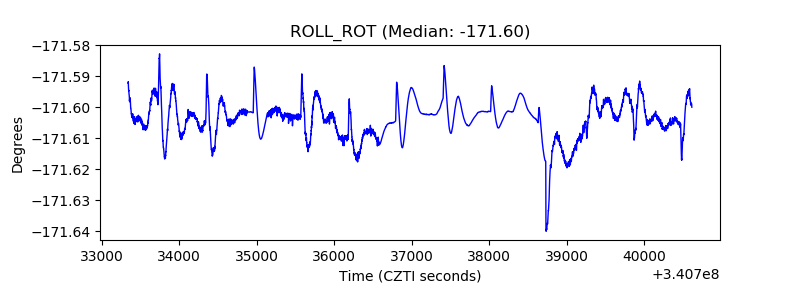 |
| _Roll_DEC |  |
| _Roll_RA | 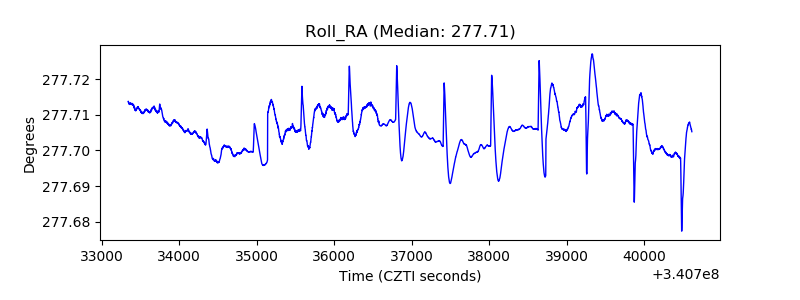 |
| Veto Counter | 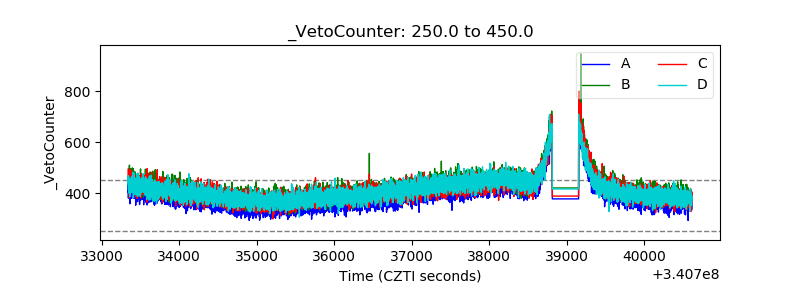 |