| Param | Original file | Final file |
|---|---|---|
| Filename | modeM0/AS1T03_255T01_9000003922_27348cztM0_level2.evt | modeM0/AS1T03_255T01_9000003922_27348cztM0_level2_quad_clean.evt |
| Size (bytes) | 595,491,840 | 107,498,880 |
| Size | 567.9 MB | 102.5 MB |
| Events in quadrant A | 3,714,637 | 708,666 |
| Events in quadrant B | 4,161,707 | 704,830 |
| Events in quadrant C | 4,347,170 | 661,631 |
| Events in quadrant D | 5,291,090 | 646,943 |
| Mode M9 | |||
|---|---|---|---|
| Quadrant | BADHDUFLAG | Total packets | Discarded packets |
| A | 0 | 2 | 0 |
| B | 0 | 3 | 0 |
| C | 0 | 3 | 0 |
| D | 0 | 3 | 0 |
| Mode M0 | |||
|---|---|---|---|
| Quadrant | BADHDUFLAG | Total packets | Discarded packets |
| A | 0 | 15972 | 0 |
| B | 0 | 17268 | 0 |
| C | 0 | 17797 | 0 |
| D | 0 | 20917 | 0 |
| Quadrant | Total seconds | Saturated seconds | Saturation percentage |
|---|---|---|---|
| A | 7658 | 51 | 0.665970% |
| B | 7658 | 230 | 3.003395% |
| C | 7658 | 266 | 3.473492% |
| D | 7658 | 440 | 5.745625% |
Noise dominated data is calculated using 1-second bins in cleaned event files. If a bin has >2000 counts, and if more than 50% of those come from <1% of pixels, then it is considered to be noise-dominated and hence unusable.
| Quadrant | # 1 sec bins | Bins with >0 counts | Bins with >2000 counts | High rate bins dominated by noise | Noise dominated (total time) | Noise dominated (detector-on time) | Marked lightcurve |
|---|---|---|---|---|---|---|---|
| A | 7923 | 7659 | 1 | 1 | 0.01% | 0.01% | 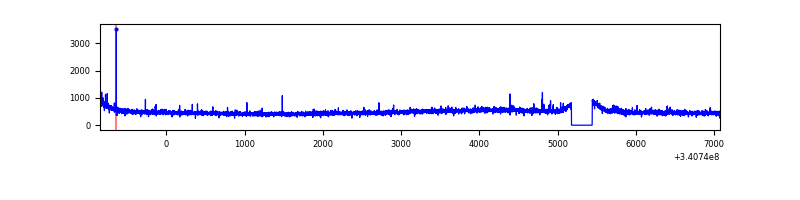 |
| B | 7923 | 7659 | 94 | 94 | 1.19% | 1.23% | 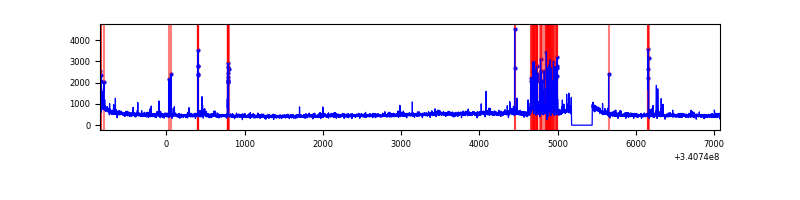 |
| C | 7923 | 7659 | 122 | 122 | 1.54% | 1.59% | 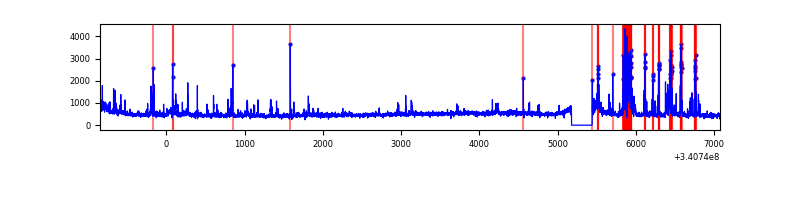 |
| D | 7923 | 7659 | 322 | 322 | 4.06% | 4.20% | 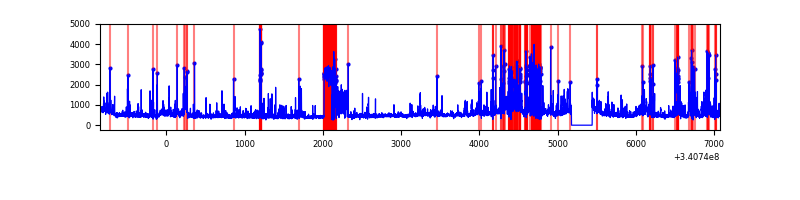 |
Top three noisy pixels from each quadrant. If the there are fewer than three noisy pixels in the level2.evt file, extra rows are filled as -1
| Pixel properties | Quadrant properties | ||||||
|---|---|---|---|---|---|---|---|
| Quadrant | DetID | PixID | Counts | Sigma | Mean | Median | Sigma |
| A | 12 | 189 | 31433 | 159.45 | 948 | 930 | 191.3 |
| A | 13 | 254 | 13461 | 65.51 | 948 | 930 | 191.3 |
| A | 13 | 248 | 13136 | 63.81 | 948 | 930 | 191.3 |
| B | 5 | 172 | 353809 | 1989.64 | 934 | 909 | 177.4 |
| B | 0 | 190 | 40114 | 221.03 | 934 | 909 | 177.4 |
| B | 0 | 229 | 35178 | 193.2 | 934 | 909 | 177.4 |
| C | 2 | 16 | 696109 | 3333.84 | 886 | 892 | 208.5 |
| C | 14 | 238 | 139935 | 666.77 | 886 | 892 | 208.5 |
| C | 15 | 208 | 48217 | 226.94 | 886 | 892 | 208.5 |
| D | 1 | 52 | 1256441 | 5591.28 | 874 | 853 | 224.6 |
| D | 7 | 38 | 273279 | 1213.14 | 874 | 853 | 224.6 |
| D | 2 | 250 | 253610 | 1125.56 | 874 | 853 | 224.6 |
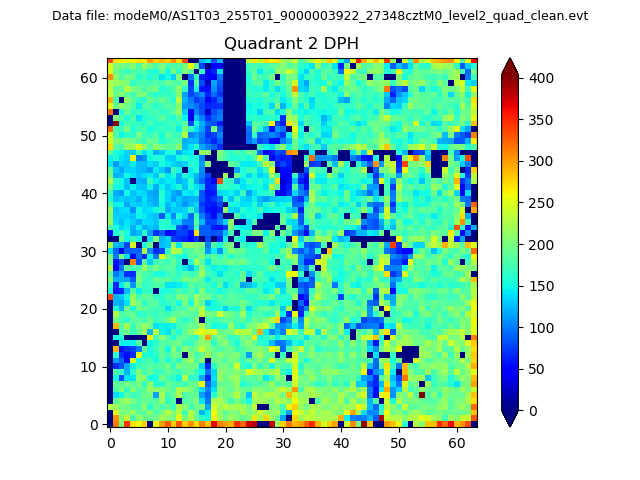
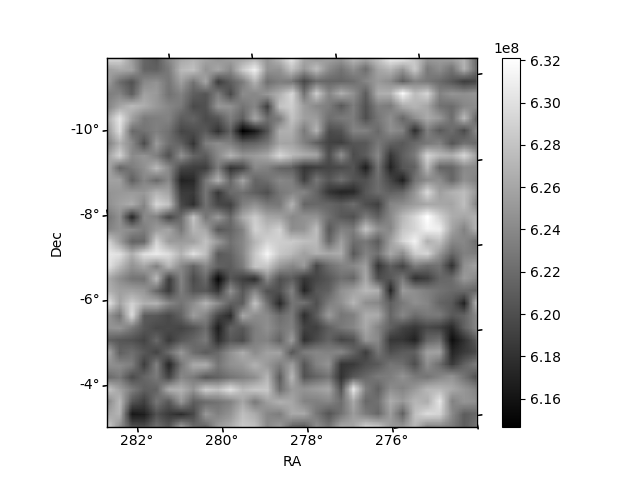
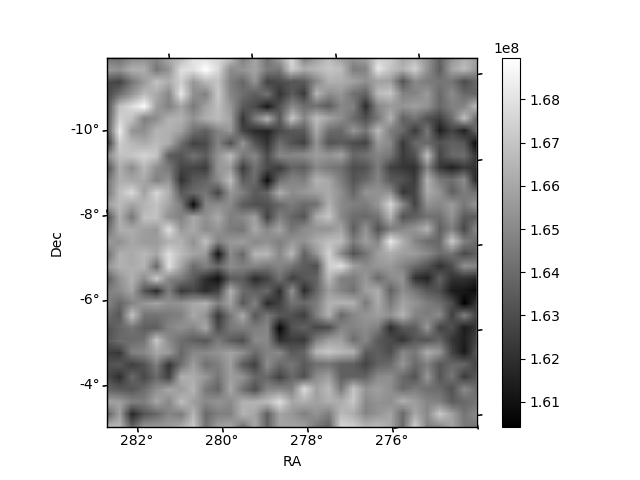
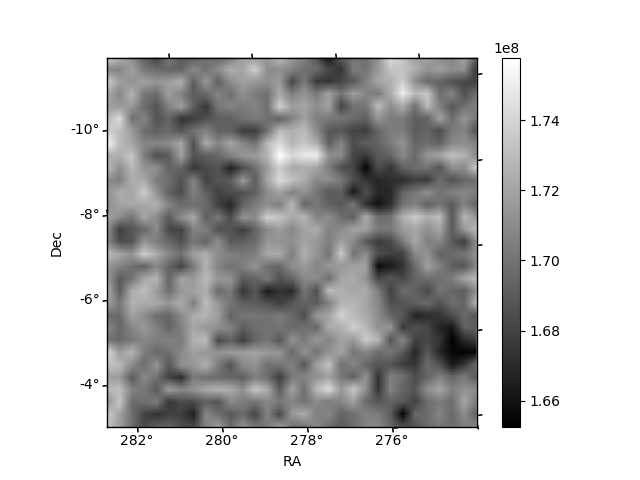
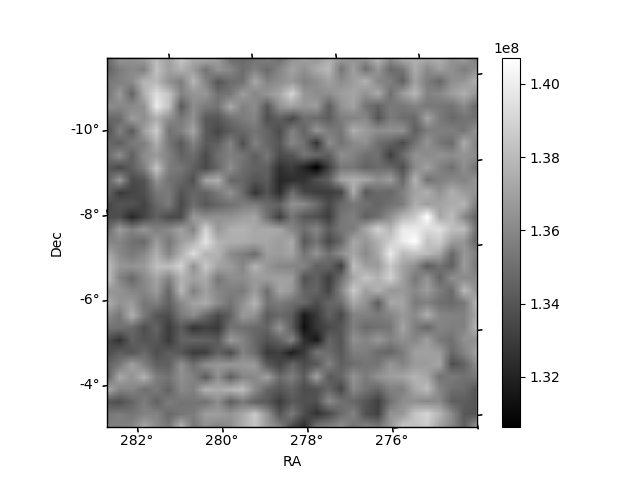
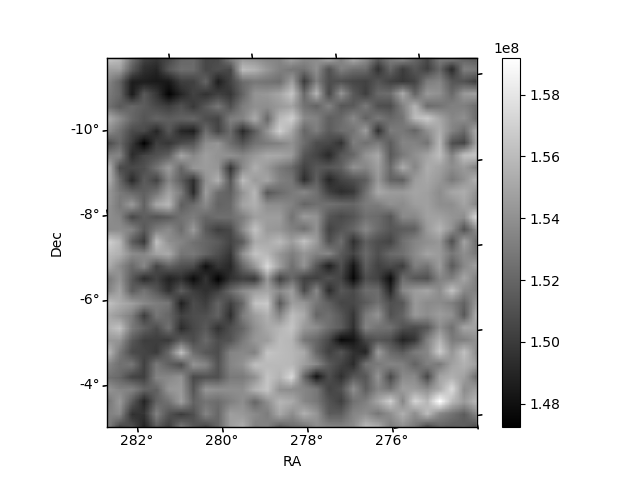
Histogram calculated using DETX and DETY for each event in the final _common_clean file
| Quadrant A | 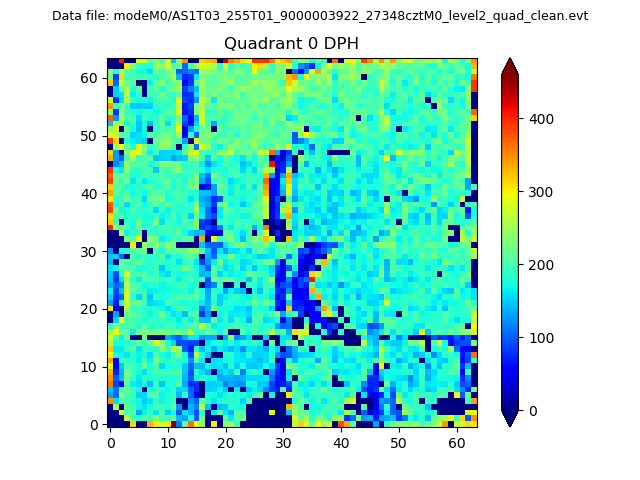 |
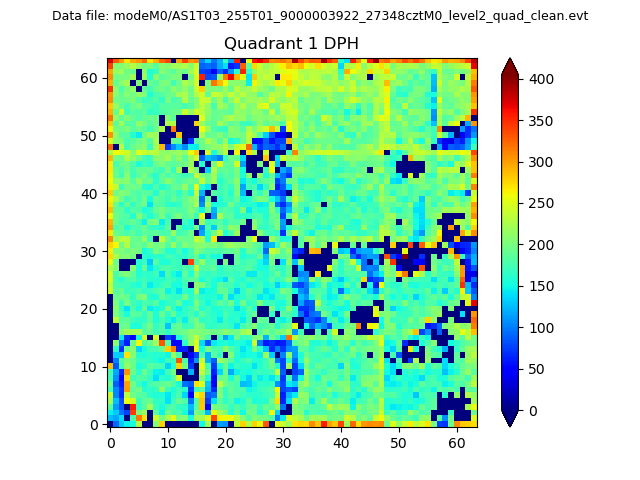 |
Quadrant B |
|---|---|---|---|
| Quadrant D | 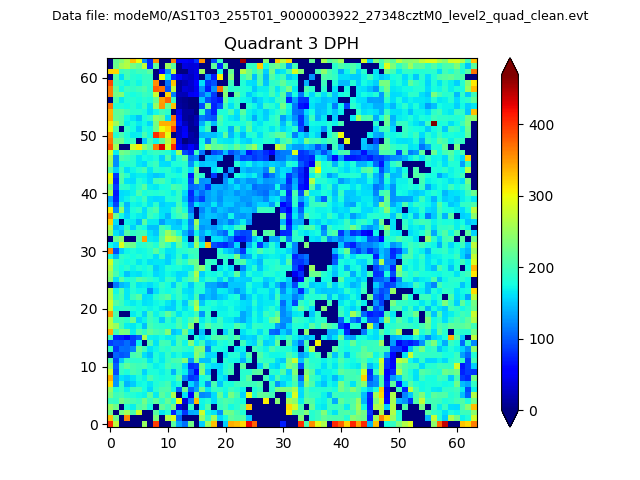 |
 |
Quadrant C |
| Plot type | Count rate plots | Images |
|---|---|---|
| Comparison with Poisson distribution Blue bars denote a histogram of data divided into 1 sec bins. Red curve is a Poisson curve with rate = median count rate of data. |
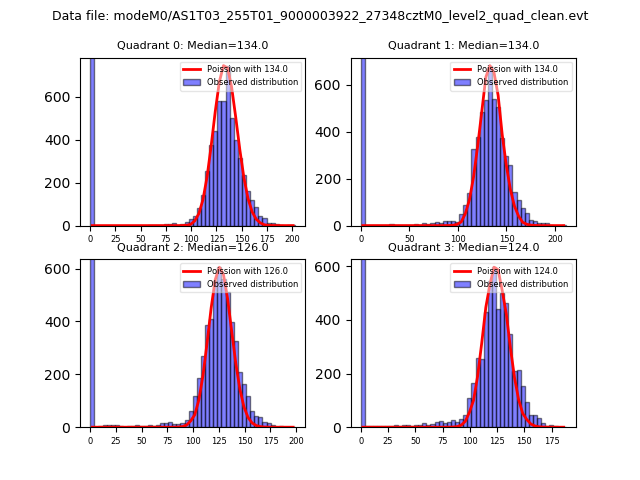 |
 |
| Quadrant-wise count rates Data is divided into 100 sec bins |
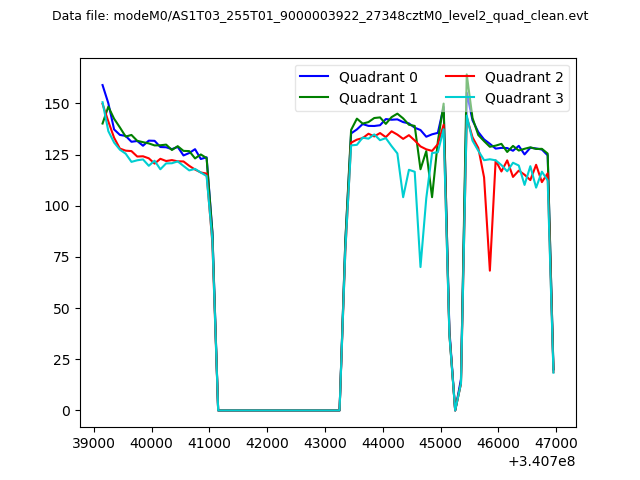 |
|
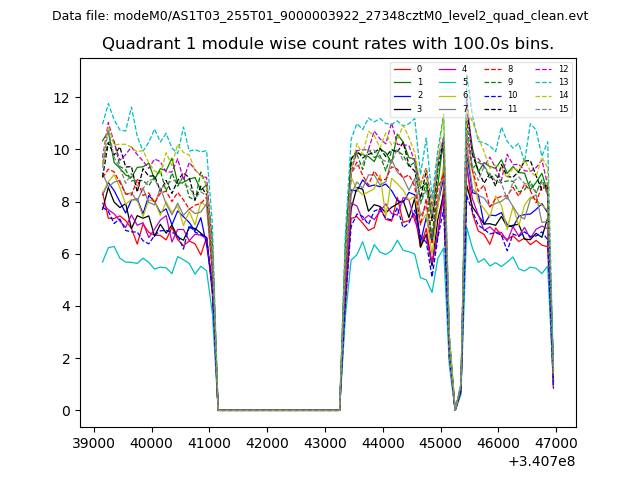
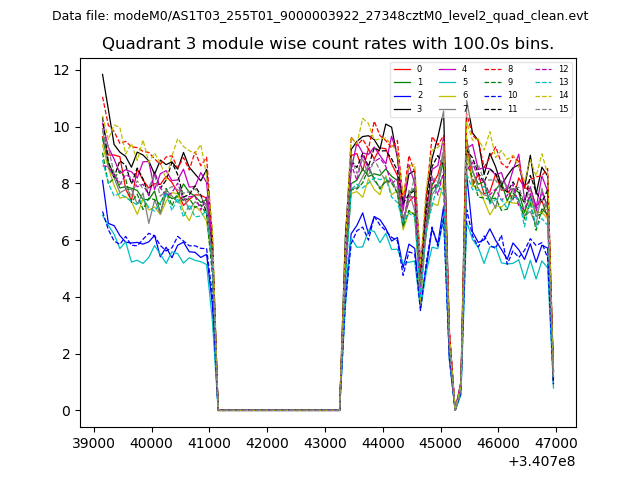
| Module-wise count rates for Quadrant A Data is divided into 100 sec bins |
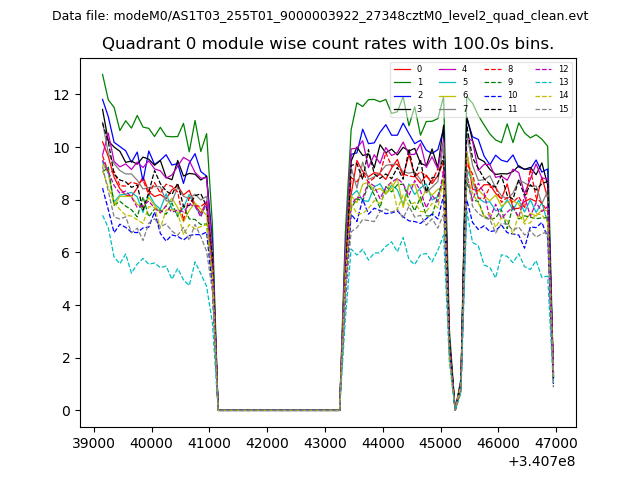 |
 |
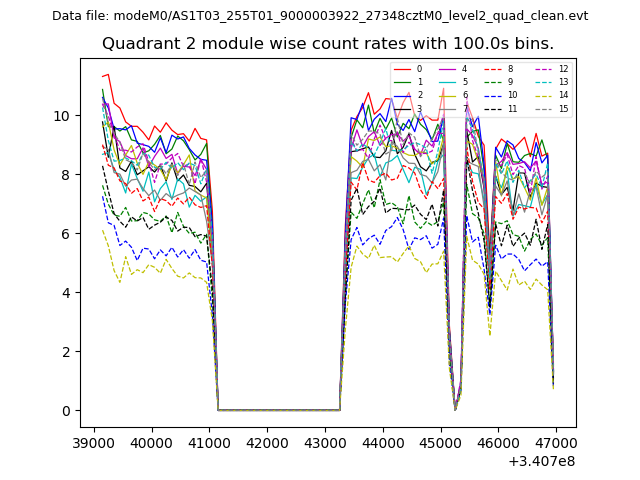
| Module-wise count rates for Quadrant B Data is divided into 100 sec bins |
 |
 |
| Module-wise count rates for Quadrant C Data is divided into 100 sec bins |
 |
 |
| Module-wise count rates for Quadrant D Data is divided into 100 sec bins |
 |
 |
| Parameter | Plot |
|---|---|
| CZT HV Monitor | 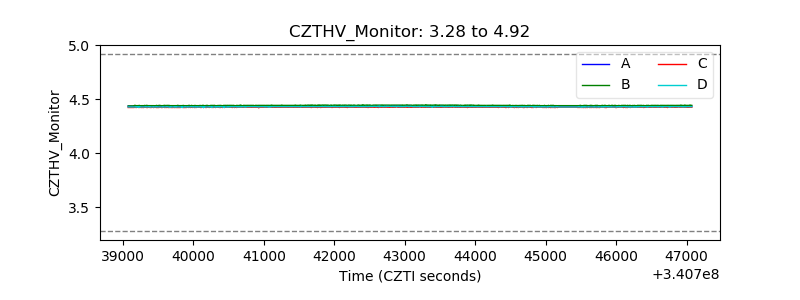 |
| D_VDD | 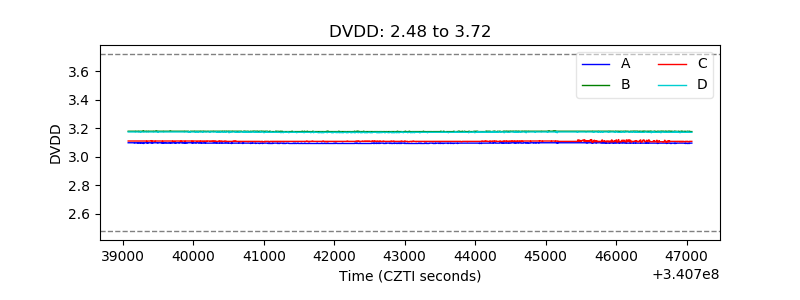 |
| Temperature 1 | 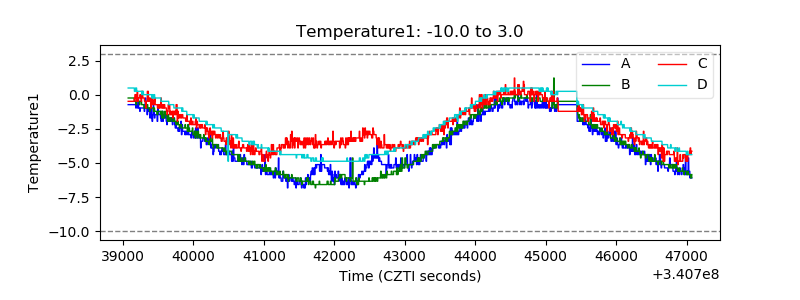 |
| Veto HV Monitor | 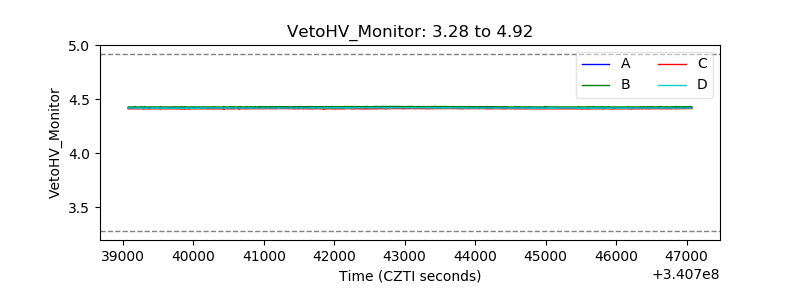 |
| Veto LLD | 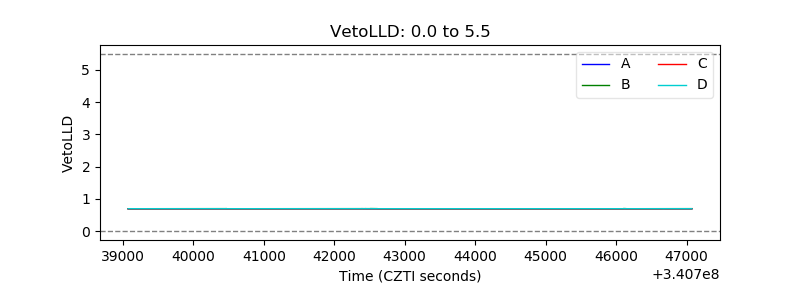 |
| Alpha Counter | 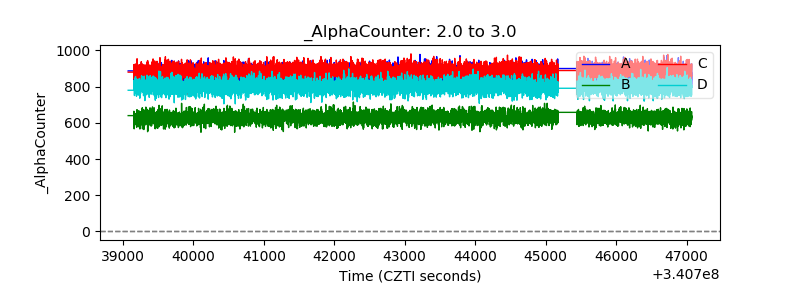 |
| _CPM_Rate | 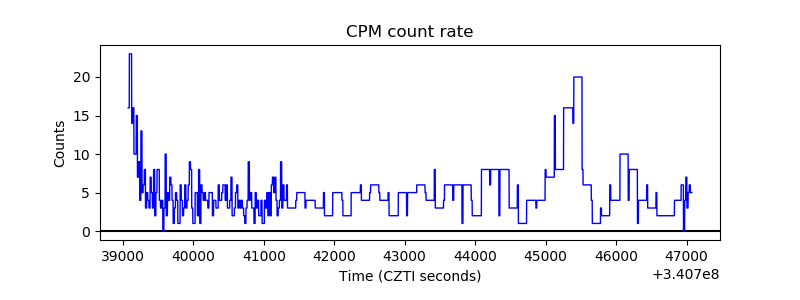 |
| CZT Counter | 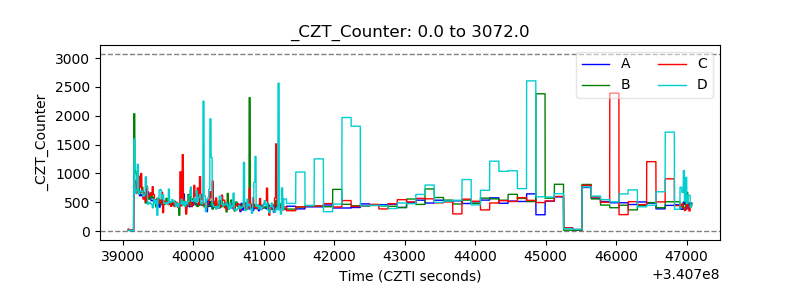 |
| +2.5 Volts monitor | 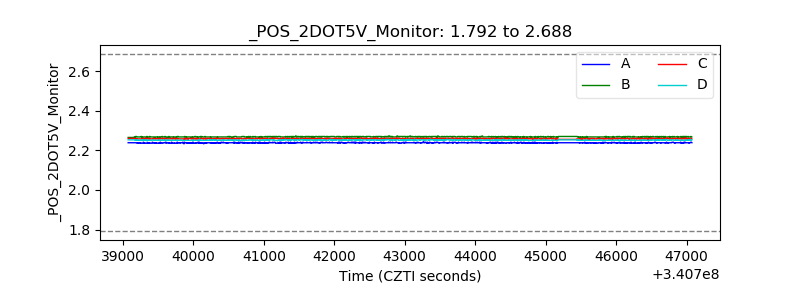 |
| +5 Volts monitor |  |
| _ROLL_ROT | 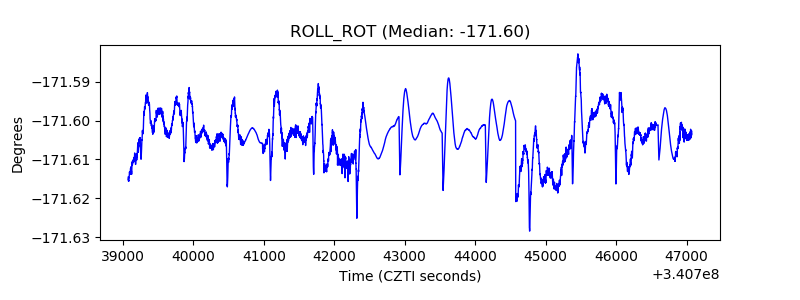 |
| _Roll_DEC | 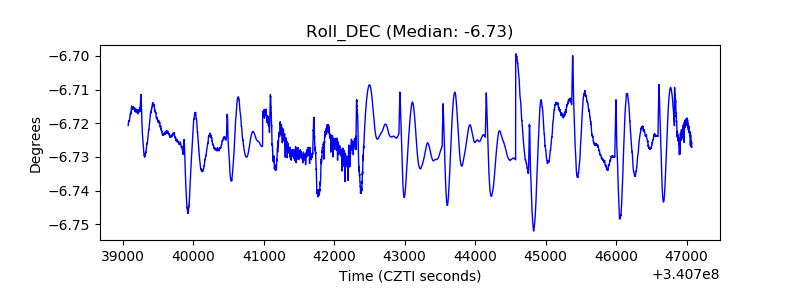 |
| _Roll_RA | 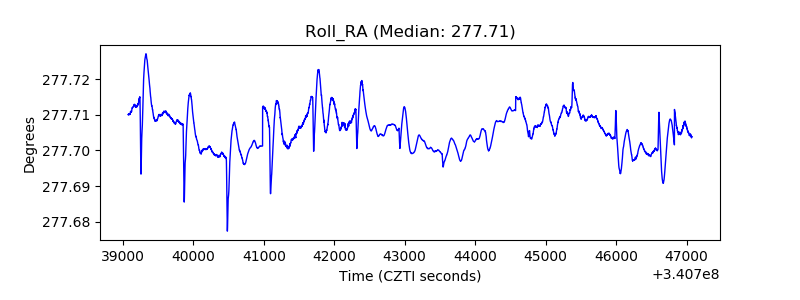 |
| Veto Counter | 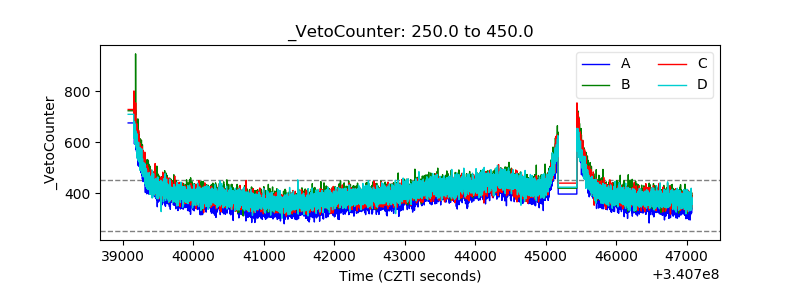 |